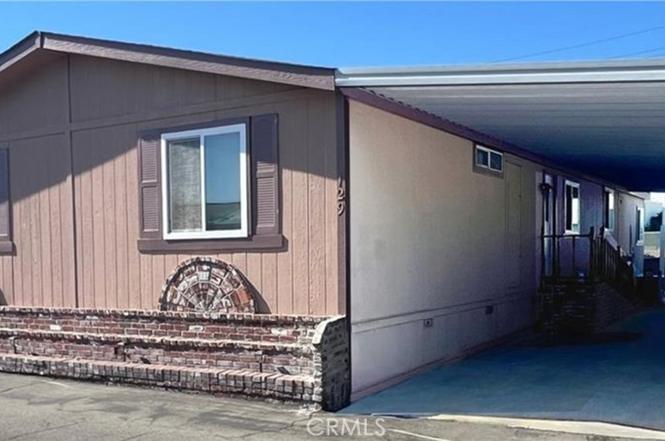
10800 Dale Ave #129 · Stanton, CA
Flood risk 1/10 · Minimal
- FEMA flood zone
- X (shaded)
- Chance of flooding over 30 yrs
- 0.0%
- Est. flood insurance / yr
- $507 – $1,088
Fire risk 1/10 · Minimal
- Est. fire insurance / yr
- $659 – $1,223
Heat risk 6/10 · Moderate
- Hot days now (above 89°F)
- 7 days/yr
- Hot days in 30 yrs
- 24 days/yr
Wind risk 1/10 · Minimal
- Chance of severe wind over 30 yrs
- —
Air-quality risk 5/10 · Moderate
- Unhealthy air days now
- 7 days/yr
- Unhealthy air days in 30 yrs
- 8 days/yr
Risk factors via First Street. Map © Google.
Why this score? — see what drove the B- grade
The composite is a weighted blend of 9 inputs, each scored 0–100. Each bar is that input's sub-score; the figure is the points it added to the 100-point composite (weight × sub-score).
- Cash flow +30.0/30.0
- DSCR +10.0/10.0
- 1% rule +9.3/10.0
- ARV discount +7.5/15.0
- Livability +3.2/5.0
- Rent growth +3.1/5.0
- Condition / age +2.5/5.0
- Schools +2.2/10.0
- Appreciation +0.0/10.0
$259,999
🖨 Deal sheet 📄 Offer letter ✓ Due diligence
Listing remarks MLS
'WOW 'WOW SUPER BIG MOBILE HOME THAT HAS EVERYTHING, LARGE MASTER BEDROOM WITH WALK-IN CLOSET W/ JUCCUZZI, VERY LARGE LAUNDRY ROOM, CUSTOM OAK KITCHEN, DINING ROOM, LARGE LIVING ROOM WITH FIREPLACE, BEAUTIFUL LANDSCAPE, FRONT PORCH IS USE RED BICK, ALSO A TOOL SHED. THIS PARK HAS A COMMUNITY POOL & SPA. OVER $$20,000 IN INPROVEMENTS. THIS MOBILE HOME WAS CUSTOM BUILT .
Key facts
- Covered deck
- Soaking tub
- Stone fireplace
Tags
Property features AI
Finance
- Other: Park name: Katella Mobile Home Estates; Manager approval required for the park; Pets: contact management
- Financial info: Monthly land lease of $1,825
- HOA & community: Land lease in place (seller-reported); Community features include gutters and storm drains
Exterior
- Parking: Located in Katella Mobile Home Estates
- Utilities: Public sewer; District/Public water
- Home design: Single-story mobile home (Silverwood model); Mobile home remains on property; Estimated living area
- Construction: Mobile home, 26 ft wide by 64 ft long; Year built per public records
- Exterior features: Association pool; Yard; Close to clubhouse; Lot is level/flat
Interior
- Bathrooms: Two full bathrooms; Features include walk-in shower, shower in tub, and bathtub
- Interior features: One-level home; East-facing entry
- Laundry & utility: Laundry inside the home
Neighborhood map
What this means for you Summary
Snapshot
- This is a 3-bed/2.0-bath manufactured listed at $260k.
Deal economics
- At list price, monthly cash flow is $1k ($14k/yr) — positive.
- The deal already cash-flows at list — no discount required.
- Meets the 1% rule at list price ($4k rent vs $260k).
- Recommended offer: $237k (9.0% below list) — sets the bar for market timing.
- Cap rate 11.6% vs local median 2.5% in Stanton — top-decile yield for the area; either an underpriced asset or a hidden risk that comps aren't pricing in. Stress-test before assuming the spread holds.
Location & tenants
- Location reads 63/100 on livability (#468 in CA) — a middle-class / working-renter tenant base. Strengths: commute A+; Watch: schools C-, amenities D, health & safety D.
- Magnolia Elementary (urban): math 25% / reading 25% proficiency, ranked #397 of 517 in CA (top 77%) — low school quality limits family demand, transient renter base, plan for 1-2y turnover; 74% free/reduced lunch — lower-income household profile, screen leases tightly.
- Market conditions: Rents rising (+2.3%/yr); 48 active listings in the ZIP; 24 comparable units currently listed for rent nearby; rentals leasing fast (median 6d on market — plan ~1-2 weeks tenant-placement turnaround); solid renter incomes; 6,974 units permitted in Orange County in 2024 (3,839 in 5+ unit buildings).
- At $3,731/mo this rent would consume 52% of the median local household income ($86k/yr) (locally 1745% of renters already pay >50% of income on rent) — very limited rent-growth headroom before tenants either downsize or default.
Forward outlook
- Local home prices are declining (-3.0%/yr); year-one equity from $2k of loan paydown is wiped out by about $8k of value loss. Plan a longer hold.
- Orange County population projected at +14% by 2050 — modest demand growth; plan on rents tracking national, not racing it.
- At projected returns (-3.0% appreciation + 2.3% rent growth), your $73k cash investment doubles in ~7 years — after that, you're playing with house money.
Negotiation context
- It's been on market 106 days — a 9% lower offer ($237k) is reasonable based on typical stale-listing flexibility.
- 4 sale attempts since 21y ago; this cycle's ask is 63% above the opening price — seller raised mid-cycle; expect resistance to lowballs.
- Current owner paid $90k; list at $260k implies a 189% gain — meaningful room to come down on a strong offer.
Risks & watch-outs
- Climate carrying-cost: extreme-heat days projected 7→24/yr by 2055 (HVAC capex compounding) — expect insurance premiums to compound above CPI over the hold.
Questions for the listing agent
- It's been on market 106 days. Have you received any prior offers? Is the seller open to a 9% concession, seller financing, or rate buy-down credit?
- Why hasn't it sold? Are there any deal-killer items the seller is aware of (foundation, flood, title, zoning, code violations)?
- Is there a deadline driving the sale (1031 exchange, divorce, estate, relocation)? That informs how much negotiation room exists.
- Crime grade is D in this area — have there been break-ins, vandalism, or insurance claims at this property in the last 3 years? What carrier currently insures it and at what premium?
- What's the average days-on-market for RENTAL listings here right now (not sales)? A rising rental-DOM trend means longer vacancies and softer asking-rent achievability than the comps imply.
- What's the recent tenant-quality profile in this submarket — average credit score on applications, eviction rate, late-payment / NSF rate, and stable-employment percentage? A property-management company in the area should have these aggregated.
- How much new for-sale + rental construction is in the pipeline within 1–3 miles? Heavy new supply typically softens prices + rents 12–24 months out; constrained supply supports both.
Investment metrics
- 1% rule
- 1.43% ✓
- Cap rate
- 11.60%
- Cash-on-cash
- 18.96%
- DSCR
- 1.84
- GRM
- 5.8
CMA / ARV
- ARV (on-the-fly)
- $173,056
- Comps found
- 8
Show comp detail 8 sales within ~0.75 mi
| Address | Dist | Beds/Ba | Sqft | Sold | Price | $/sf | Match |
|---|---|---|---|---|---|---|---|
| 10800 Dale Ave #125 | 0.00mi | 3/2.0 | 1,440 (-14%) | 11mo | $222,500 | $155 | 69 |
| 8681 Katella Ave #898 | 0.18mi | 3/2.0 | 1,440 (-14%) | 9mo | $230,000 | $160 | 62 |
| 11250 Beach Blvd #2 | 0.53mi | 2/2.0 (-1) | 1,536 (-8%) | 6mo | $125,000 | $81 | 52 |
| 8681 Katella Ave #865 | 0.18mi | 3/2.0 | 1,440 (-14%) | 20mo | $285,000 | $198 | 52 |
| 11250 Beach Blvd #108 | 0.56mi | 2/2.0 (-1) | 1,536 (-8%) | 10mo | $150,000 | $98 | 48 |
| 11250 Beach Blvd #119 | 0.55mi | 2/2.0 (-1) | 1,536 (-8%) | 12mo | $120,000 | $78 | 47 |
| 11250 Beach Blvd #122 | 0.55mi | 2/2.0 (-1) | 1,440 (-14%) | 13mo | $149,900 | $104 | 36 |
| 11250 Beach Blvd #11 | 0.55mi | 2/2.0 (-1) | 1,440 (-14%) | 17mo | $140,000 | $97 | 32 |
Match score weights: distance 35% · size 25% · config 20% · recency 20%. Top-matched comps best support the ARV.
Projected returns pro-forma
-3.0% appreciation · 2.33% rent growth · sell at horizon
- IRR
- 10.1%
- Equity multiple
- 1.39×
- Total profit
- $28,699
- Equity at exit
- $38,767
- IRR
- 18.6%
- Equity multiple
- 2.50×
- Total profit
- $109,454
- Equity at exit
- $22,480
Cash invested: $72,800 (down + closing). Projections, not guarantees.
Landlord ↔ Tenant lean methodology
- Overall (STATE)
- 18 Strongly Tenant-Friendly
- State California
- 18 Strongly Tenant-Friendly · D+13
- County
- — inherits STATE
- City
- — inherits STATE
ZIP-level market 90680
- Rents YoY
- 2.3%
- Active inventory
- 48
- Price-to-rent
- 5.8×
Monthly cashflow live
- Estimated rent
- $3,731 high interval (Pro) →
- Mortgage (P&I)
- −$1,363
- Tax est. 1.5%
- −$325 /mo · $3,900/yr
- Insurance
- −$108
- HOA
- −$0
- Vacancy / Maint / Mgmt
- −$783
- Net cashflow
- $1,150
Break-even live
UW: 25.0% down · 7.5% · 30yr · 1.5% tax · 5.0% vac · 8.0% maint · 8.0% mgmt
Financing live
Cash to close
- Down payment
- $65,000
- Closing costs
- $7,800
- Reserves months
- —
- Total cash needed
- —
Loan-product check · same deal, 3 products live
Conventional
25% down · 7.5% · 30yr
- Down + closing
- —
- Monthly P&I
- —
- Monthly cashflow
- —
- DSCR
- —
- Eligible?
- —
Personal DTI + credit; lowest rate.
DSCR
20% down · 8.5% · 30yr
- Down + closing
- —
- Monthly P&I
- —
- Monthly cashflow
- —
- DSCR
- —
- Eligible?
- —
No personal income docs; deal must DSCR.
Hard money
10% down · 12.0% · 12mo
- Down + closing
- —
- Monthly P&I
- —
- Monthly cashflow
- —
- DSCR
- —
- Eligible?
- —
Short-term bridge; refi at stabilization.
Rent comps 24 comps
| Address | Beds | Baths | Sqft | Rent | $/sqft | DOM | Units | Dist |
|---|---|---|---|---|---|---|---|---|
| 8853 Stardust Ln Anaheim, CA | 3.0 | 1.5 | 1126 | $3,875 | $3.44 | 2d | 1 | 0.43mi |
| 9014 Stacie Ln #28 Anaheim, CA | 3.0 | 2.0 | 1347 | $3,095 | $2.30 | 1d | 1 | 0.50mi |
| 7765 Beechwood Way Stanton, CA | 3.0 | 1.5 | 1232 | $3,750 | $3.04 | 1d | 1 | 0.80mi |
| 7545 Katella Ave Stanton, CA | 1.0–2.0 | 1.0 | 900 | $3,053 | $3.39 | 1d | 7 | 0.99mi |
| 9313 Marchand Ave Garden Grove, CA | 3.0 | 3.0 | 1200 | $4,500 | $3.75 | 5d | 1 | 1.01mi |
| 10321 Courtright Rd Stanton, CA | 3.0 | 2.0 | 1202 | $3,700 | $3.08 | 22d | 1 | 1.04mi |
| 10910 Scottsbluff Dr Stanton, CA | 4.0 | 3.5 | 1924 | $4,350 | $2.26 | 1d | 1 | 1.05mi |
| 11893 Macduff St Garden Grove, CA | 3.0 | 2.0 | 1200 | $3,100 | $2.58 | 24d | 1 | 1.07mi |
| 10361 Iona Way Stanton, CA | 3.0 | 1.5 | 1149 | $3,500 | $3.05 | 1d | 1 | 1.09mi |
| 10250 Masterson Ave Stanton, CA | 3.0 | 2.0 | 1590 | $3,750 | $2.36 | 1d | 1 | 1.10mi |
| 2449 W Ball Rd Anaheim, CA | 1.0–2.0 | 1.0–2.0 | 1000 | $2,855 | $2.85 | 12d | 4 | 1.21mi |
| 2551 W Rome Ave Anaheim, CA | 3.0 | 1.5 | 1130 | $3,850 | $3.41 | 6d | 1 | 1.24mi |
| 12101 Dale Ave #80 Stanton, CA | 3.0 | 2.0 | 1493 | $1,500 | $1.00 | 7d | 1 | 1.26mi |
| 10070 Gilbert St Anaheim, CA | 3.0 | 2.0 | 1250 | $3,095 | $2.48 | 1d | 1 | 1.28mi |
| 3208 W Ravenswood Dr Anaheim, CA | 3.0 | 2.0 | 1636 | $4,000 | $2.44 | 12d | 1 | 1.31mi |
| 627 S Velare St Anaheim, CA | 2.0 | 1.0 | 1095 | $2,494 | $2.28 | 18d | 1 | 1.40mi |
| 2970 W Orange Ave Unit B028 Anaheim, CA | 2.0 | 2.0 | 1100 | $2,880 | $2.62 | 17d | 1 | 1.43mi |
| 33 Bigsby Dr Stanton, CA | 3.0 | 3.5 | 1625 | $3,950 | $2.43 | 43d | 1 | 1.45mi |
| 35 Bigsby Dr Stanton, CA | 3.0 | 3.0 | 1355 | $4,000 | $2.95 | 24d | 1 | 1.45mi |
| 3 Bigsby Dr Stanton, CA | 3.0 | 3.0 | 1355 | $3,950 | $2.92 | 16d | 1 | 1.45mi |
| 31909 Saint Joseph Ln Stanton, CA | 4.0 | 3.5 | 1825 | $4,950 | $2.71 | 1d | 1 | 1.45mi |
| 31907 Saint Joseph Ln Stanton, CA | 4.0 | 3.5 | 1800 | $4,950 | $2.75 | 1d | 1 | 1.45mi |
| 31911 Saint Joseph Ln Stanton, CA | 4.0 | 3.5 | 1825 | $4,950 | $2.71 | 1d | 1 | 1.45mi |
| 12312 Louise St Garden Grove, CA | 3.0 | 2.0 | 1300 | $3,500 | $2.69 | 24d | 1 | 1.47mi |
Listing history 22 events
-
2026-06-18days on market $259,999 Active 106 DOM
-
2026-06-17days on market $259,999 Active 105 DOM
-
2026-06-16days on market $259,999 Active 104 DOM
-
2026-06-15days on market $259,999 Active 103 DOM
-
2026-06-13days on market $259,999 Active 101 DOM
-
2026-06-13days on market $259,999 Active 100 DOM
-
2026-06-09days on market $259,999 Active 97 DOM
-
2026-06-08days on market $259,999 Active 96 DOM
-
2026-06-07days on market $259,999 Active 95 DOM
-
2026-06-04days on market $259,999 Active 92 DOM
-
2026-06-03days on market $259,999 Active 91 DOM
-
2026-06-02days on market $259,999 Active 90 DOM
-
2026-06-01days on market $259,999 Active 89 DOM
-
2026-05-31days on market $259,999 Active 88 DOM
-
2026-03-06price $259,999
-
2026-03-04$159,999 Active
-
2026-02-03historical
-
2025-09-06$264,000 Active
-
2006-12-15soldstatus $89,950 377-char remark
Show marketing remark (377 chars)
'WOW 'WOW SUPER BIG MOBILE HOME THAT HAS EVERYTHING, LARGE MASTER BEDROOM WITH WALK-IN CLOSET W/ JUCCUZZI, VERY LARGE LAUNDRY ROOM, CUSTOM OAK KITCHEN, DINING ROOM, LARGE LIVING ROOM WITH FIREPLACE, BEAUTIFUL LANDSCAPE, FRONT PORCH IS USE RED BICK, ALSO A TOOL SHED. THIS PARK HAS A COMMUNITY POOL & SPA. OVER $$20,000 IN INPROVEMENTS. THIS MOBILE HOME WAS CUSTOM BUILT .
-
2006-06-02historical
Show marketing remark (377 chars)
'WOW 'WOW SUPER BIG MOBILE HOME THAT HAS EVERYTHING, LARGE MASTER BEDROOM WITH WALK-IN CLOSET W/ JUCCUZZI, VERY LARGE LAUNDRY ROOM, CUSTOM OAK KITCHEN, DINING ROOM, LARGE LIVING ROOM WITH FIREPLACE, BEAUTIFUL LANDSCAPE, FRONT PORCH IS USE RED BICK, ALSO A TOOL SHED. THIS PARK HAS A COMMUNITY POOL & SPA. OVER $$20,000 IN INPROVEMENTS. THIS MOBILE HOME WAS CUSTOM BUILT .
-
2006-06-02$99,950 377-char remark
Show marketing remark (377 chars)
'WOW 'WOW SUPER BIG MOBILE HOME THAT HAS EVERYTHING, LARGE MASTER BEDROOM WITH WALK-IN CLOSET W/ JUCCUZZI, VERY LARGE LAUNDRY ROOM, CUSTOM OAK KITCHEN, DINING ROOM, LARGE LIVING ROOM WITH FIREPLACE, BEAUTIFUL LANDSCAPE, FRONT PORCH IS USE RED BICK, ALSO A TOOL SHED. THIS PARK HAS A COMMUNITY POOL & SPA. OVER $$20,000 IN INPROVEMENTS. THIS MOBILE HOME WAS CUSTOM BUILT .
-
2005-12-12$99,950
ⓘ Source: listings_history table (triggers on properties + properties_extension) + one-shot
backfill from property_details.listing_events for pre-trigger history.
Climate risk First Street
- Flood 1/10 Low FEMA zone X (shaded) · 0% chance over 30 yrs
- Wildfire 1/10 Low
- Heat 6/10 Major 7 d/yr ≥89°F today · 24 d/yr by 30 yrs out
- Wind 1/10 Low
- Air quality 5/10 Major 7 unhealthy d/yr today · 8 by 30 yrs out
Nearby sold comps map
Loading sold comps map…
Walkable amenities ~0.75 mi
Loading nearby amenities…
Taxation est. · year 1
- Rental income
- $44,768
- − Mortgage interest
- −$14,564
- − Property taxes
- −$3,900
- − Insurance
- −$1,300
- − Repairs & maintenance
- −$3,581
- − Management
- −$3,581
- − Depreciation
- −$7,564
- Taxable income
- $10,278
- Est. tax owed @ 24.0%
- −$2,467
- After-tax cash flow
- $11,339/yr
For passive investors: Depreciation is non-cash, so a rental often shows a tax loss while cash-flowing — sheltering income. Rental losses are passive: they offset passive income freely, and up to $25,000/yr can offset ordinary (W-2) income if you actively participate and your MAGI is under $100k (phasing out to $0 by $150k); unused losses carry forward. On sale, claimed depreciation is recaptured at up to 25%, and gains may owe capital-gains tax (a 1031 exchange can defer both). Figures are a year-1 estimate at your 24.0% rate — not tax advice; consult a CPA.
Schools (NCES district)
- District
- Magnolia Elementary
- NCES district ID
- 0623430
- Math proficiency
- 25% ▼ -21.00%
- Reading proficiency
- 25% ▼ -29.00%
- Median HH income
- $50,320
- Composite
- 22.09/100
- National rank
- #8181
- State rank
- #397 of 517 in CA
Livability — Stanton
- Score
- 63/100
- State rank
- #468
- US rank
- #15945
Category grades
Schools grade is shown separately in the Schools card above.
Census & demographics
- Census place
- Stanton, CA
- County
- Orange County · 3,096,323 people
- City population
- 31,991
- Metro
- Los Angeles-Long Beach-Anaheim, CA
- Population (ZIP)
- 31,991
- Household income
- $85,592
- Rent vs Own
- Severe rent burden
- 1745.0
Population outlook (Orange County) Hauer SSP2
- Today (2025)
- 3,477,456 people
- By 2030
- 3,613,117 · +3.9%
- By 2040
- 3,835,945 · +10.3%
- By 2050
- 3,968,736 · +14.1%
- By 2075
- 4,097,053 · +17.8%
- By 2100
- 3,903,633 · +12.3%
Race, ethnicity, and origin ACS 2023
- Neighborhood character
- Diverse neighborhood (Simpson 0.64)
- Race & ethnicity
- Hispanic / Latino 50% Asian 27% White 17% Two or more races 12% Black 2% Native American 1%
- Hispanic origin (detail)
- Mexican 42%
- Common ancestry
- Italian 1% Iranian 0%
- Foreign-born
- 42% · Canada, Vietnam, South Korea
- Languages at home
- 35% English-only · Spanish 39% Vietnamese 17% Tagalog/Filipino 2%
Political lean MEDSL · Orange
- 2024 margin
- Toss-up / Even · D 49.7% · R 47.1% · Other 3.2%
- 2008→2024 swing
- +5.2pp toward D · 2008: -2.6pp · 2024: 2.6pp
- All cycles
- 2024: D+2.6 2020: D+9.0 2016: D+7.7 2012: R+8.3 2008: R+2.6
Not yet ingested
- Civics
- —
Market trends
- HPI YoY
- ▼ -529.54%
- Current HPI
- 447.9557
- Rent YoY
- ▲ 2.33%
- Metro
- Los Angeles-Long Beach-Anaheim, CA
- State GDP YoY
- ▲ 3.21%
- F500 in state
- 116
Industry mix (Fortune 500 HQ in CA)
| Industry | F500 HQs | Revenue |
|---|---|---|
| Technology | 27 | $1,492B |
|
||
| Financial Services | 3 | $174B |
|
||
| Retail | 3 | $44B |
|
||
| Insurance | 3 | $26B |
|
||
| Media / Entertainment | 2 | $115B |
|
||
| Pharmaceuticals / Biotech | 2 | $62B |
|
||
Price history
+160.1% since first listed8 events — show timeline
- 2026-03-06 Price Changed $259,999 CRMLS
- 2026-03-04 Listed $159,999 CRMLS
- 2026-02-03 Listing Removed — CRMLS
- 2025-09-06 Listed $264,000 CRMLS
- 2006-12-15 Sold (MLS) $89,950 CRMLS
- 2006-06-02 Listed $99,950 CRMLS
- 2006-06-02 Listing Removed — CRMLS
- 2005-12-12 Listed $99,950 CRMLS
Property tax history
-8.7%/yrLatest (2025): $72 · +2.3% YoY. Source: county tax records.
Cash-flow waterfall
monthlySold comps — $/sqft
last 12 mo · ≤1 miLoading sold comps…