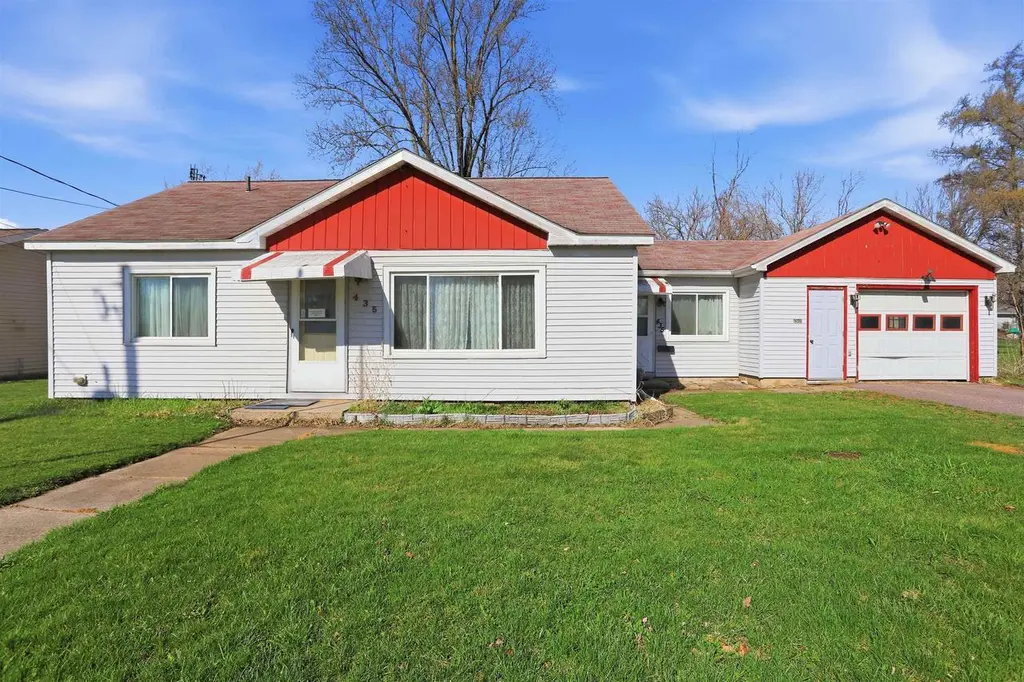
435 S Union St · Mauston, WI
Flood risk 4/10 · Minor
- FEMA flood zone
- X (unshaded)
- Chance of flooding over 30 yrs
- 0.22%
- Est. flood insurance / yr
- $473 – $860
Fire risk 1/10 · Minimal
- Est. fire insurance / yr
- $636 – $1,182
Heat risk 2/10 · Minimal
- Hot days now (above 98°F)
- 7 days/yr
- Hot days in 30 yrs
- 14 days/yr
Wind risk 2/10 · Minimal
- Chance of severe wind over 30 yrs
- —
Air-quality risk 1/10 · Minimal
- Unhealthy air days now
- 0 days/yr
- Unhealthy air days in 30 yrs
- 0 days/yr
Risk factors via First Street. Map © Google.
Why this score? — see what drove the B+ grade
The composite is a weighted blend of 9 inputs, each scored 0–100. Each bar is that input's sub-score; the figure is the points it added to the 100-point composite (weight × sub-score).
- Cash flow +30.0/30.0
- ARV discount +15.0/15.0
- DSCR +10.0/10.0
- 1% rule +9.4/10.0
- Livability +3.6/5.0
- Schools +2.9/10.0
- Rent growth +2.5/5.0
- Condition / age +2.5/5.0
- Appreciation +0.0/10.0
$85,000
🖨 Deal sheet 📄 Offer letter ✓ Due diligence
Listing remarks
Ready to stop renting? Step into homeownership with this affordable 2 bedroom, 1 bath starter home iLocated within walking distance of Lions Park and the Splashpad. It features an attached garage and a surprisingly large backyard ready for pets, play, or a garden. Inside offers a practical layout that just needs some cosmetic freshening to quickly build equity and make it your own. With great bones, an attached garage for Wisconsin winters, and outdoor space you rarely find at this price point, this one is perfect for first-time buyers or investors looking for a project. Home has smoke and pet odors.
Key facts
- Attached garage
- Large backyard
- Outdoor space
Tags
Neighborhood map
What this means for you Summary
Snapshot
- This is a 2-bed/1.0-bath single-family listed at $85k.
Deal economics
- At list price, monthly cash flow is $330 ($4k/yr) — positive.
- The deal already cash-flows at list — no discount required.
- Meets the 1% rule at list price ($1k rent vs $85k).
- Cap rate 11.0% vs local median 4.4% in Mauston — top-decile yield for the area; either an underpriced asset or a hidden risk that comps aren't pricing in. Stress-test before assuming the spread holds.
Location & tenants
- Location reads 71/100 on livability (#258 in WI) — a middle-class / working-renter tenant base. Strengths: crime A+, cost of living A+, housing A+; Watch: employment C-, amenities F, commute F.
- Mauston School District (rural): math 36% / reading 31% proficiency, ranked #248 of 342 in WI (top 72%) — families likely to look elsewhere, expect single-tenant / working-renter base with shorter leases.
- Zoned schools: Mauston High (math 17% / reading 17%, grade F, #400 of 483 statewide, top 85%, 381 students, 41% FRL).
- Zoned-school proficiency averages 17% at this address vs 34% district-wide (-16 pts) — the specific schools serving this property underperform the Mauston School District average; the district grade overstates school quality for this exact location.
- Market conditions: 61 active listings in the ZIP; 3 comparable units currently listed for rent nearby; rentals at typical pace (median 14d on market — plan ~3-4 weeks tenant-placement turnaround); 154 units permitted in Juneau County in 2024 (0 in 5+ unit buildings).
Forward outlook
- Local home prices are declining (-3.0%/yr); year-one equity from $588 of loan paydown is wiped out by about $3k of value loss. Plan a longer hold.
- Juneau County population projected at -19% by 2050 — secular population decline; favor cash flow + early exit over multi-decade hold.
- At projected returns (-3.0% appreciation + 3.0% rent growth), your $24k cash investment doubles in ~8 years — after that, you're playing with house money.
Negotiation context
- Only 1 days on market — expect competitive offers; lowballing is unlikely to land.
- Current owner paid $50k; list at $85k implies a 70% gain — meaningful room to come down on a strong offer.
Risks & watch-outs
- Watch-outs: built in 1950 — expect roof / HVAC / electrical / plumbing capex.
Questions for the listing agent
- Built in 1950 — when were the roof, HVAC, electrical panel, plumbing, and water heater last replaced?
- Is there a deadline driving the sale (1031 exchange, divorce, estate, relocation)? That informs how much negotiation room exists.
- Schools are F-rated, which usually means shorter tenancies and higher turnover. Who's the typical renter profile here, and what's been the actual vacancy rate?
- What's the average days-on-market for RENTAL listings here right now (not sales)? A rising rental-DOM trend means longer vacancies and softer asking-rent achievability than the comps imply.
- What's the recent tenant-quality profile in this submarket — average credit score on applications, eviction rate, late-payment / NSF rate, and stable-employment percentage? A property-management company in the area should have these aggregated.
- How much new for-sale + rental construction is in the pipeline within 1–3 miles? Heavy new supply typically softens prices + rents 12–24 months out; constrained supply supports both.
Investment metrics
- 1% rule
- 1.44% ✓
- Cap rate
- 10.96%
- Cash-on-cash
- 16.65%
- DSCR
- 1.74
- GRM
- 5.8
CMA / ARV
- ARV (on-the-fly)
- $116,144
- Comps found
- 12
Show comp detail 12 sales within ~0.75 mi
| Address | Dist | Beds/Ba | Sqft | Sold | Price | $/sf | Match |
|---|---|---|---|---|---|---|---|
| 435 S Union St | 0.00mi | 2/1.0 | 976 (0%) | 1mo | $85,000 | $87 | 99 |
| 120 W Milwaukee St | 0.25mi | 3/1.0 (+1) | 1,032 (+6%) | 8mo | $200,000 | $194 | 67 |
| 417 S Union St | 0.05mi | 3/1.0 (+1) | 1,075 (+10%) | 18mo | $112,900 | $105 | 61 |
| 825 E State St | 0.39mi | 1/1.0 (-1) | 900 (-8%) | 6mo | $88,500 | $98 | 59 |
| 139 Beach St | 0.59mi | 3/1.0 (+1) | 954 (-2%) | 8mo | $47,352 | $50 | 57 |
| 208 Hageman Ct | 0.14mi | 2/1.0 | 843 (-14%) | 18mo | $105,000 | $125 | 56 |
| 515 Grove St | 0.69mi | 2/1.0 | 900 (-8%) | 5mo | $82,500 | $92 | 51 |
| 108 Hanover St | 0.55mi | 2/1.0 | 1,100 (+13%) | 8mo | $188,500 | $171 | 46 |
| 333 Maine St | 0.64mi | 1/1.0 (-1) | 920 (-6%) | 12mo | $126,000 | $137 | 45 |
| 303 N Union St | 0.67mi | 2/1.0 | 884 (-9%) | 12mo | $105,000 | $119 | 43 |
| 300 Jackson St | 0.70mi | 3/1.0 (+1) | 1,040 (+7%) | 12mo | $207,000 | $199 | 42 |
| 509 Loomis Dr | 0.66mi | 3/1.0 (+1) | 1,068 (+9%) | 11mo | $100,000 | $94 | 39 |
Match score weights: distance 35% · size 25% · config 20% · recency 20%. Top-matched comps best support the ARV.
Projected returns pro-forma
-3.0% appreciation · 3.0% rent growth · sell at horizon
- IRR
- 7.8%
- Equity multiple
- 1.31×
- Total profit
- $7,310
- Equity at exit
- $12,674
- IRR
- 17.1%
- Equity multiple
- 2.41×
- Total profit
- $33,652
- Equity at exit
- $7,349
Cash invested: $23,800 (down + closing). Projections, not guarantees.
Landlord ↔ Tenant lean methodology
- Overall (STATE)
- 73 Landlord-Friendly
- State Wisconsin
- 73 Landlord-Friendly · R+2
- County
- — inherits STATE
- City
- — inherits STATE
ZIP-level market 53948
- Home prices YoY
- -29.4%
- Active inventory
- 61
- Price-to-rent
- 5.8×
Monthly cashflow live
- Estimated rent
- $1,226 medium interval (Pro) →
- Mortgage (P&I)
- −$446
- Tax from tax record
- −$157 /mo · $1,886/yr
- Insurance
- −$35
- HOA
- −$0
- Vacancy / Maint / Mgmt
- −$257
- Net cashflow
- $330
Break-even live
UW: 25.0% down · 7.5% · 30yr · 1.5% tax · 5.0% vac · 8.0% maint · 8.0% mgmt
Financing live
Cash to close
- Down payment
- $21,250
- Closing costs
- $2,550
- Reserves months
- —
- Total cash needed
- —
Loan-product check · same deal, 3 products live
Conventional
25% down · 7.5% · 30yr
- Down + closing
- —
- Monthly P&I
- —
- Monthly cashflow
- —
- DSCR
- —
- Eligible?
- —
Personal DTI + credit; lowest rate.
DSCR
20% down · 8.5% · 30yr
- Down + closing
- —
- Monthly P&I
- —
- Monthly cashflow
- —
- DSCR
- —
- Eligible?
- —
No personal income docs; deal must DSCR.
Hard money
10% down · 12.0% · 12mo
- Down + closing
- —
- Monthly P&I
- —
- Monthly cashflow
- —
- DSCR
- —
- Eligible?
- —
Short-term bridge; refi at stabilization.
Rent comps 3 comps
| Address | Beds | Baths | Sqft | Rent | $/sqft | DOM | Units | Dist |
|---|---|---|---|---|---|---|---|---|
| 510 McEvoy St Mauston, WI | 2.0 | 1.0 | 825 | $1,200 | $1.45 | 14d | 1 | 0.47mi |
| 400 Stonefield Cir Unit 804 Mauston, WI | 1.0 | 1.0 | 800 | $1,135 | $1.42 | 23d | 1 | 0.51mi |
| 400 Stonefield Cir Unit 931 Mauston, WI | 2.0 | 1.0 | 1080 | $1,335 | $1.24 | 14d | 1 | 0.51mi |
Listing history 4 events
-
2026-04-16status Pending
-
2026-04-14$85,000 Active
-
2014-05-01soldstatus $49,900
-
2010-02-05soldstatus $54,900
ⓘ Source: listings_history table (triggers on properties + properties_extension) + one-shot
backfill from property_details.listing_events for pre-trigger history.
Tax reassessment forecast WI · Partial reset (capped growth)
- Current annual tax
- $1,886 · $157/mo
- Projected year-2 tax
- $1,886 · $157/mo
- Expected delta
- $0/yr ($0/mo · 0.0%)
ⓘ Screening estimate from a state-policy table — verify with the county assessor before closing.
Climate risk First Street
- Flood 4/10 Moderate FEMA zone X (unshaded) · 22% chance over 30 yrs
- Wildfire 1/10 Low
- Heat 2/10 Low 7 d/yr ≥98°F today · 14 d/yr by 30 yrs out
- Wind 2/10 Low
- Air quality 1/10 Low 0 unhealthy d/yr today · 0 by 30 yrs out
Nearby sold comps map
Loading sold comps map…
Walkable amenities ~0.75 mi
Loading nearby amenities…
Taxation est. · year 1
- Rental income
- $14,712
- − Mortgage interest
- −$4,761
- − Property taxes
- −$1,886
- − Insurance
- −$425
- − Repairs & maintenance
- −$1,177
- − Management
- −$1,177
- − Depreciation
- −$2,473
- Taxable income
- $2,814
- Est. tax owed @ 24.0%
- −$675
- After-tax cash flow
- $3,288/yr
For passive investors: Depreciation is non-cash, so a rental often shows a tax loss while cash-flowing — sheltering income. Rental losses are passive: they offset passive income freely, and up to $25,000/yr can offset ordinary (W-2) income if you actively participate and your MAGI is under $100k (phasing out to $0 by $150k); unused losses carry forward. On sale, claimed depreciation is recaptured at up to 25%, and gains may owe capital-gains tax (a 1031 exchange can defer both). Figures are a year-1 estimate at your 24.0% rate — not tax advice; consult a CPA.
Schools (NCES district)
- District
- Mauston School District
- NCES district ID
- 5508850
- Math proficiency
- 36% ▼ -3.00%
- Reading proficiency
- 31% ▼ -1.00%
- Median HH income
- $46,779
- Composite
- 28.82/100
- National rank
- #6658
- State rank
- #248 of 342 in WI
Livability — Mauston
- Score
- 71/100
- State rank
- #258
- US rank
- #6593
Category grades
Schools grade is shown separately in the Schools card above.
Census & demographics
- Census place
- Mauston, WI
- Population (ZIP)
- 8,221
Population outlook (Juneau County) Hauer SSP2
- Today (2025)
- 25,013 people
- By 2030
- 24,154 · -3.4%
- By 2040
- 22,217 · -11.2%
- By 2050
- 20,276 · -18.9%
- By 2075
- 15,919 · -36.4%
- By 2100
- 11,351 · -54.6%
Race, ethnicity, and origin ACS 2023
- Neighborhood character
- Predominantly White (90%)
- Race & ethnicity
- White 90% Two or more races 5% Black 3% Hispanic / Latino 2%
- Common ancestry
- Romanian 10% Portuguese 8% Lithuanian 2%
- Foreign-born
- 4% · Canada
- Languages at home
- 95% English-only · Russian/Polish/Slavic 2% Spanish 2% German/W. Germanic 1%
Political lean MEDSL · Juneau
- 2024 margin
- Solid R (+32.1) · D 33.4% · R 65.6% · Other 1.0%
- 2008→2024 swing
- -41.1pp toward R · 2008: 9.0pp · 2024: -32.1pp
- All cycles
- 2024: R+32.1 2020: R+29.2 2016: R+26.3 2012: D+7.1 2008: D+9.0
Not yet ingested
- Civics
- —
Market trends
- HPI YoY
- ▼ -109.90%
- Current HPI
- 263.4253
- Rent YoY
- —
- Metro
- —
- State GDP YoY
- ▲ 2.10%
- F500 in state
- 20
Industry mix (Fortune 500 HQ in WI)
| Industry | F500 HQs | Revenue |
|---|---|---|
| Industrial Machinery | 4 | $23B |
|
||
| Industrial Technology | 2 | $36B |
|
||
| Insurance | 1 | $36B |
|
||
| Professional Services | 1 | $19B |
|
||
| Utilities | 1 | $9B |
|
||
| Consumer Goods | 1 | $3B |
|
||
Price history
+54.8% since first listed4 events — show timeline
- 2026-04-16 Pending — SCWMLS
- 2026-04-14 Listed $85,000 SCWMLS
- 2014-05-01 Sold (Public Records) $49,900 Public Records
- 2010-02-05 Sold (Public Records) $54,900 Public Records
Property tax history
+2.0%/yrLatest (2025): $1,886 · -1.2% YoY. Source: county tax records.
Cash-flow waterfall
monthlySold comps — $/sqft
last 12 mo · ≤1 miLoading sold comps…