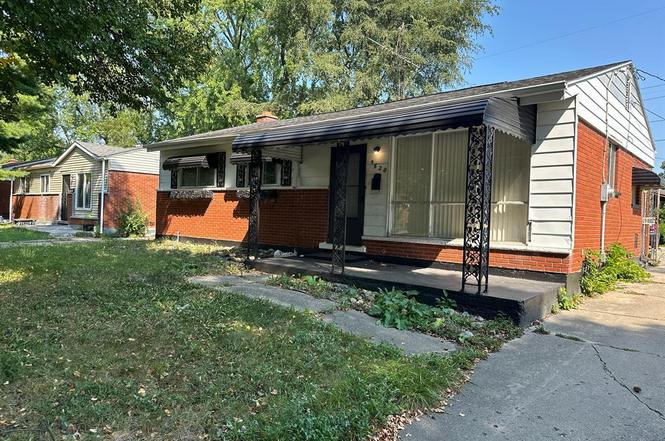
5620 Marlowe Dr · Flint, MI
Flood risk 1/10 · Minimal
- FEMA flood zone
- X (unshaded)
- Chance of flooding over 30 yrs
- 0.0%
- Est. flood insurance / yr
- $473 – $860
Fire risk 1/10 · Minimal
- Est. fire insurance / yr
- $784 – $1,456
Heat risk 2/10 · Minimal
- Hot days now (above 96°F)
- 7 days/yr
- Hot days in 30 yrs
- 15 days/yr
Wind risk 2/10 · Minimal
- Chance of severe wind over 30 yrs
- —
Air-quality risk 2/10 · Minimal
- Unhealthy air days now
- 1 days/yr
- Unhealthy air days in 30 yrs
- 3 days/yr
Risk factors via First Street. Map © Google.
Why this score? — see what drove the C grade
The composite is a weighted blend of 9 inputs, each scored 0–100. Each bar is that input's sub-score; the figure is the points it added to the 100-point composite (weight × sub-score).
- Cash flow +30.0/30.0
- 1% rule +10.0/10.0
- DSCR +10.0/10.0
- Livability +3.7/5.0
- Rent growth +2.5/5.0
- Condition / age +2.5/5.0
- Schools +1.1/10.0
- ARV discount +0.0/15.0
- Appreciation +0.0/10.0
$55,000
🖨 Deal sheet (PDF) 📄 Offer letter ✓ Due diligence
Listing remarks MLS
This property offers the convenience of city living while being tucked away in a peaceful neighborhood. Close to shopping, schools, and parks, it's the perfect location for your next home!
Key facts
- Close to parks
- Close to schools
- Close to shopping
Tags
Neighborhood map
What this means for you Summary
Snapshot
- This is a 3-bed/1.0-bath single-family listed at $55k.
Deal economics
- At list price, monthly cash flow is $336 ($4k/yr) — positive.
- The deal already cash-flows at list — no discount required.
- Meets the 1% rule at list price ($966 rent vs $55k).
- Recommended offer: $53k (3.0% below list) — sets the bar for market timing.
Location & tenants
- Location reads 74/100 on livability (#196 in MI, #4,946 nationally) — a middle-class / working-renter tenant base. Strengths: commute A+, cost of living A+, housing A+; Watch: schools F, crime F, employment F.
- Flint School District (urban): math 7% / reading 13% proficiency, ranked #714 of 760 in MI (top 94%) — low school quality limits family demand, transient renter base, plan for 1-2y turnover; 83% free/reduced lunch — lower-income household profile, screen leases tightly.
- Market conditions: 132 active listings in the ZIP; 8 comparable units currently listed for rent nearby; rentals at typical pace (median 15d on market — plan ~3-4 weeks tenant-placement turnaround); 419 units permitted in Genesee County in 2024 (68 in 5+ unit buildings).
Forward outlook
- Local home prices are declining (-3.0%/yr); year-one equity from $380 of loan paydown is wiped out by about $2k of value loss. Plan a longer hold.
- Genesee County population projected at -27% by 2050 — secular population decline; favor cash flow + early exit over multi-decade hold.
- At projected returns (-3.0% appreciation + 3.0% rent growth), your $15k cash investment doubles in ~5 years — after that, you're playing with house money.
Negotiation context
- It's been on market 49 days — a 3% lower offer ($53k) is reasonable based on typical stale-listing flexibility.
- 10 sale attempts since 26y ago; this cycle's ask has dropped $5k (8%) from the opening price — seller is motivated, your offer sets the floor, not the list.
Risks & watch-outs
- Watch-outs: property tax is 2.5% of price; built in 1958 — expect roof / HVAC / electrical / plumbing capex.
Questions for the listing agent
- It's been on market 49 days. Have you received any prior offers? Is the seller open to a 3% concession, seller financing, or rate buy-down credit?
- Built in 1958 — when were the roof, HVAC, electrical panel, plumbing, and water heater last replaced?
- Property tax is high relative to price — has the assessment been appealed recently, and will the sale trigger a re-assessment?
- Is there a deadline driving the sale (1031 exchange, divorce, estate, relocation)? That informs how much negotiation room exists.
- Schools are F-rated, which usually means shorter tenancies and higher turnover. Who's the typical renter profile here, and what's been the actual vacancy rate?
- Crime grade is F in this area — have there been break-ins, vandalism, or insurance claims at this property in the last 3 years? What carrier currently insures it and at what premium?
- What's the average days-on-market for RENTAL listings here right now (not sales)? A rising rental-DOM trend means longer vacancies and softer asking-rent achievability than the comps imply.
- What's the recent tenant-quality profile in this submarket — average credit score on applications, eviction rate, late-payment / NSF rate, and stable-employment percentage? A property-management company in the area should have these aggregated.
- How much new for-sale + rental construction is in the pipeline within 1–3 miles? Heavy new supply typically softens prices + rents 12–24 months out; constrained supply supports both.
Investment metrics
- 1% rule
- 1.76% ✓
- Cap rate
- 13.63%
- Cash-on-cash
- 26.22%
- DSCR
- 2.17
- GRM
- 4.7
CMA / ARV
- ARV (on-the-fly)
- $45,072
- Comps found
- 12
Show comp detail 12 sales within ~0.75 mi
| Address | Dist | Beds/Ba | Sqft | Sold | Price | $/sf | Match |
|---|---|---|---|---|---|---|---|
| 5905 Cloverlawn Dr | 0.16mi | 3/1.0 | 983 (+5%) | 2mo | $30,000 | $31 | 83 |
| 2017 Chateau Dr | 0.31mi | 3/1.5 | 915 (-3%) | 5mo | $50,000 | $55 | 75 |
| 1710 Shamrock Ln | 0.32mi | 3/1.0 | 878 (-6%) | 2mo | $43,500 | $50 | 72 |
| 2106 Janice Dr | 0.47mi | 3/1.0 | 913 (-3%) | 2mo | $74,000 | $81 | 71 |
| 5014 Miami Ln St | 0.38mi | 3/1.0 | 878 (-6%) | 4mo | $24,000 | $27 | 68 |
| 813 Chatham Dr | 0.69mi | 3/1.5 | 942 (+0%) | 1mo | $33,700 | $36 | 65 |
| 1511 W Home Ave | 0.27mi | 3/1.5 | 1,042 (+11%) | 3mo | $35,500 | $34 | 65 |
| 1913 Cherrylawn Dr | 0.45mi | 3/1.0 | 878 (-6%) | 5mo | $19,000 | $22 | 64 |
| 6310 Valorie Ln | 0.36mi | 3/1.0 | 1,040 (+11%) | 4mo | $49,900 | $48 | 62 |
| 2210 Canniff St | 0.64mi | 3/1.5 | 905 (-4%) | 1mo | $83,000 | $92 | 61 |
| 4702 Warrington Dr | 0.51mi | 3/1.0 | 1,010 (+8%) | 3mo | $82,900 | $82 | 61 |
| 4807 Birchcrest Dr | 0.52mi | 3/1.5 | 878 (-6%) | 4mo | $35,000 | $40 | 60 |
Match score weights: distance 35% · size 25% · config 20% · recency 20%. Top-matched comps best support the ARV.
Projected returns pro-forma
-3.0% appreciation · 3.0% rent growth · sell at horizon
- IRR
- 20.0%
- Equity multiple
- 1.82×
- Total profit
- $12,560
- Equity at exit
- $8,201
- IRR
- 28.3%
- Equity multiple
- 3.51×
- Total profit
- $38,707
- Equity at exit
- $4,755
Cash invested: $15,400 (down + closing). Projections, not guarantees.
Landlord ↔ Tenant lean methodology
- Overall (STATE)
- 62 Landlord-Friendly
- State Michigan
- 62 Landlord-Friendly · EVEN
- County
- — inherits STATE
- City
- — inherits STATE
ZIP-level market 48504
- Active inventory
- 132
- Price-to-rent
- 4.7×
Monthly cashflow live
- Estimated rent
- $966 high interval (Pro) →
- Mortgage (P&I)
- −$288
- Tax from tax record
- −$115 /mo · $1,385/yr
- Insurance
- −$23
- HOA
- −$0
- Vacancy / Maint / Mgmt
- −$203
- Net cashflow
- $336
Break-even live
Sensitivity live
| Price | -10% $368 | -5% $352 | +0% $336 | +5% $321 | +10% $305 |
|---|---|---|---|---|---|
| Rent | -10% $260 | -5% $298 | +0% $336 | +5% $375 | +10% $413 |
| Rate | -1.0pp $364 | -0.5pp $350 | base $336 | +0.5pp $322 | +1.0pp $308 |
UW: 25.0% down · 7.5% · 30yr · 1.5% tax · 5.0% vac · 8.0% maint · 8.0% mgmt
Financing live
Cash to close
- Down payment
- $13,750
- Closing costs
- $1,650
- Reserves months
- —
- Total cash needed
- —
Loan-product check · same deal, 3 products live
Conventional
25% down · 7.5% · 30yr
- Down + closing
- —
- Monthly P&I
- —
- Monthly cashflow
- —
- DSCR
- —
- Eligible?
- —
Personal DTI + credit; lowest rate.
DSCR
20% down · 8.5% · 30yr
- Down + closing
- —
- Monthly P&I
- —
- Monthly cashflow
- —
- DSCR
- —
- Eligible?
- —
No personal income docs; deal must DSCR.
Hard money
10% down · 12.0% · 12mo
- Down + closing
- —
- Monthly P&I
- —
- Monthly cashflow
- —
- DSCR
- —
- Eligible?
- —
Short-term bridge; refi at stabilization.
Rent comps 8 comps
| Address | Beds | Baths | Sqft | Rent | $/sqft | DOM | Units | Dist |
|---|---|---|---|---|---|---|---|---|
| 5905 Griggs Dr Flint, MI | 3.0 | 1.0 | 940 | $1,000 | $1.06 | 14d | 1 | 0.10mi |
| 5413 DuPont St Flint, MI | 4.0 | 1.5 | 1038 | $900 | $0.87 | 22d | 1 | 0.65mi |
| 514 W Alma Ave Flint, MI | 3.0 | 1.0 | 894 | $925 | $1.03 | 14d | 1 | 0.99mi |
| 3424 W Mott Ave Flint, MI | 2.0 | 1.0 | 682 | $725 | $1.06 | 45d | 1 | 1.14mi |
| 3506 Brownell Blvd Flint, MI | 2.0 | 1.0 | 600 | $825 | $1.38 | 14d | 1 | 1.23mi |
| 5280 Cedar Shores Ct Flint, MI | 2.0–3.0 | 2.0 | 1150 | $1,148 | $1.00 | 14d | 6 | 1.28mi |
| 3221 Burgess St Flint, MI | 2.0 | 1.0 | 755 | $875 | $1.16 | 22d | 1 | 1.38mi |
| 246 E York Ave Flint, MI | 2.0 | 1.0 | 800 | $895 | $1.12 | 14d | 1 | 1.40mi |
Listing history 29 events
-
2024-12-17status Pending
-
2024-12-04soldstatus $48,000
-
2024-11-07status Pending 188-char remark
Show marketing remark (188 chars)
This property offers the convenience of city living while being tucked away in a peaceful neighborhood. Close to shopping, schools, and parks, it's the perfect location for your next home!
-
2024-11-07status Pending
Show marketing remark (188 chars)
This property offers the convenience of city living while being tucked away in a peaceful neighborhood. Close to shopping, schools, and parks, it's the perfect location for your next home!
-
2024-10-11price $55,000 188-char remark
Show marketing remark (188 chars)
This property offers the convenience of city living while being tucked away in a peaceful neighborhood. Close to shopping, schools, and parks, it's the perfect location for your next home!
-
2024-10-10price $55,000
-
2024-09-18$60,000 Active
Show marketing remark (188 chars)
This property offers the convenience of city living while being tucked away in a peaceful neighborhood. Close to shopping, schools, and parks, it's the perfect location for your next home!
-
2024-09-18$60,000 Active 188-char remark
Show marketing remark (188 chars)
This property offers the convenience of city living while being tucked away in a peaceful neighborhood. Close to shopping, schools, and parks, it's the perfect location for your next home!
-
2020-07-01historical
-
2020-07-01historical
-
2020-05-05price $23,000
-
2020-05-04price $23,000
-
2020-04-16$25,000 Active
-
2020-04-16$25,000 Active
-
2008-04-24soldstatus $7,250
-
2008-04-24soldstatus $7,250
-
2008-04-14historical
-
2008-04-01$12,350
-
2008-04-01$12,350
-
2002-04-22soldstatus $62,000
-
2002-04-12soldstatus $61,800
-
2002-04-12soldstatus $61,800
-
2001-12-03historical
-
2001-11-05$55,000
-
2001-11-05$55,000
-
2000-11-30$60,000
-
2000-11-30historical
-
2000-11-30historical
-
2000-11-30$60,000
ⓘ Source: listings_history table (triggers on properties + properties_extension) + one-shot
backfill from property_details.listing_events for pre-trigger history.
Tax reassessment forecast MI · Partial reset (capped growth)
- Current annual tax
- $1,385 · $115/mo
- Projected year-2 tax
- $1,385 · $115/mo
- Expected delta
- $0/yr ($0/mo · 0.0%)
ⓘ Screening estimate from a state-policy table — verify with the county assessor before closing.
Climate risk First Street
- Flood 1/10 Low FEMA zone X (unshaded) · 0% chance over 30 yrs
- Wildfire 1/10 Low
- Heat 2/10 Low 7 d/yr ≥96°F today · 15 d/yr by 30 yrs out
- Wind 2/10 Low
- Air quality 2/10 Low 1 unhealthy d/yr today · 3 by 30 yrs out
Nearby sold comps map
Loading sold comps map…
Walkable amenities ~0.75 mi
Loading nearby amenities…
Taxation est. · year 1
- Rental income
- $11,593
- − Mortgage interest
- −$3,081
- − Property taxes
- −$1,385
- − Insurance
- −$275
- − Repairs & maintenance
- −$927
- − Management
- −$927
- − Depreciation
- −$1,600
- Taxable income
- $3,397
- Est. tax owed @ 24.0%
- −$815
- After-tax cash flow
- $3,222/yr
For passive investors: Depreciation is non-cash, so a rental often shows a tax loss while cash-flowing — sheltering income. Rental losses are passive: they offset passive income freely, and up to $25,000/yr can offset ordinary (W-2) income if you actively participate and your MAGI is under $100k (phasing out to $0 by $150k); unused losses carry forward. On sale, claimed depreciation is recaptured at up to 25%, and gains may owe capital-gains tax (a 1031 exchange can defer both). Figures are a year-1 estimate at your 24.0% rate — not tax advice; consult a CPA.
Schools (NCES district)
- District
- Flint School District
- NCES district ID
- 2614520
- Math proficiency
- 7% ▬ 0.00%
- Reading proficiency
- 13% ▲ 3.00%
- Median HH income
- $25,954
- Composite
- 10.97/100
- National rank
- #14642
- State rank
- #714 of 760 in MI
Livability — Flint
- Score
- 74/100
- State rank
- #196
- US rank
- #4946
Category grades
Schools grade is shown separately in the Schools card above.
Census & demographics
- Census place
- Flint, MI
- City population
- 93,814
- Population (ZIP)
- 23,873
Population outlook (Genesee County) Hauer SSP2
- Today (2025)
- 381,312 people
- By 2030
- 362,731 · -4.9%
- By 2040
- 321,550 · -15.7%
- By 2050
- 279,212 · -26.8%
- By 2075
- 193,336 · -49.3%
- By 2100
- 128,118 · -66.4%
Race, ethnicity, and origin ACS 2023
- Neighborhood character
- Predominantly Black (66%)
- Race & ethnicity
- Black 66% White 24% Two or more races 6% Hispanic / Latino 5% Asian 1%
- Common ancestry
- Romanian 2% Lithuanian 1% Italian 1%
- Foreign-born
- 3% · Canada, China
- Languages at home
- 96% English-only · Spanish 2%
Political lean MEDSL · Genesee
- 2024 margin
- Toss-up / Even · D 51.4% · R 47.2% · Other 1.4%
- 2008→2024 swing
- -28.3pp toward R · 2008: 32.5pp · 2024: 4.2pp
- All cycles
- 2024: D+4.2 2020: D+9.3 2016: D+9.5 2012: D+28.2 2008: D+32.5
Not yet ingested
- Civics
- —
Market trends
- HPI YoY
- ▼ -101.67%
- Current HPI
- 94.3111
- Rent YoY
- —
- Metro
- —
- State GDP YoY
- ▲ 1.37%
- F500 in state
- 28
Industry mix (Fortune 500 HQ in MI)
| Industry | F500 HQs | Revenue |
|---|---|---|
| Automotive Parts | 3 | $48B |
|
||
| Automotive | 2 | $372B |
|
||
| Chemicals | 1 | $45B |
|
||
| Automotive Retail | 1 | $29B |
|
||
| Healthcare / Medical Devices | 1 | $23B |
|
||
| Automotive Technology | 1 | $20B |
|
||
Price history
-20.0% since first listed29 events — show timeline
- 2024-12-17 Pending — REALCOMP
- 2024-12-04 Sold (Public Records) $48,000 Public Records
- 2024-11-07 Pending — MiRealSource-MiMLS
- 2024-11-07 Pending — REALCOMP
- 2024-10-11 Price Changed $55,000 MiRealSource-MiMLS
- 2024-10-10 Price Changed $55,000 REALCOMP
- 2024-09-18 Listed $60,000 MiRealSource-MiMLS
- 2024-09-18 Listed $60,000 REALCOMP
- 2020-07-01 Listing Removed — MiRealSource-MiMLS
- 2020-07-01 Listing Removed — REALCOMP
- 2020-05-05 Price Changed $23,000 MiRealSource-MiMLS
- 2020-05-04 Price Changed $23,000 REALCOMP
- 2020-04-16 Listed $25,000 MiRealSource-MiMLS
- 2020-04-16 Listed $25,000 REALCOMP
- 2008-04-24 Sold (MLS) $7,250 REALCOMP
- 2008-04-24 Sold (MLS) $7,250 MiRealSource-MiMLS
- 2008-04-14 Listing Removed — MiRealSource-MiMLS
- 2008-04-01 Listed $12,350 REALCOMP
- 2008-04-01 Listed $12,350 MiRealSource-MiMLS
- 2002-04-22 Sold (Public Records) $62,000 Public Records
- 2002-04-12 Sold (MLS) $61,800 MiRealSource-MiMLS
- 2002-04-12 Sold (MLS) $61,800 REALCOMP
- 2001-12-03 Listing Removed — MiRealSource-MiMLS
- 2001-11-05 Listed $55,000 MiRealSource-MiMLS
- 2001-11-05 Listed $55,000 REALCOMP
- 2000-11-30 Listed $60,000 MiRealSource-MiMLS
- 2000-11-30 Listing Removed — MiRealSource-MiMLS
- 2000-11-30 Listing Removed — REALCOMP
- 2000-11-30 Listed $60,000 REALCOMP
Property tax history
+3.5%/yrLatest (2025): $1,385 · +43.3% YoY. Source: county tax records.
Cash-flow waterfall
monthlySold comps — $/sqft
last 12 mo · ≤1 miLoading sold comps…