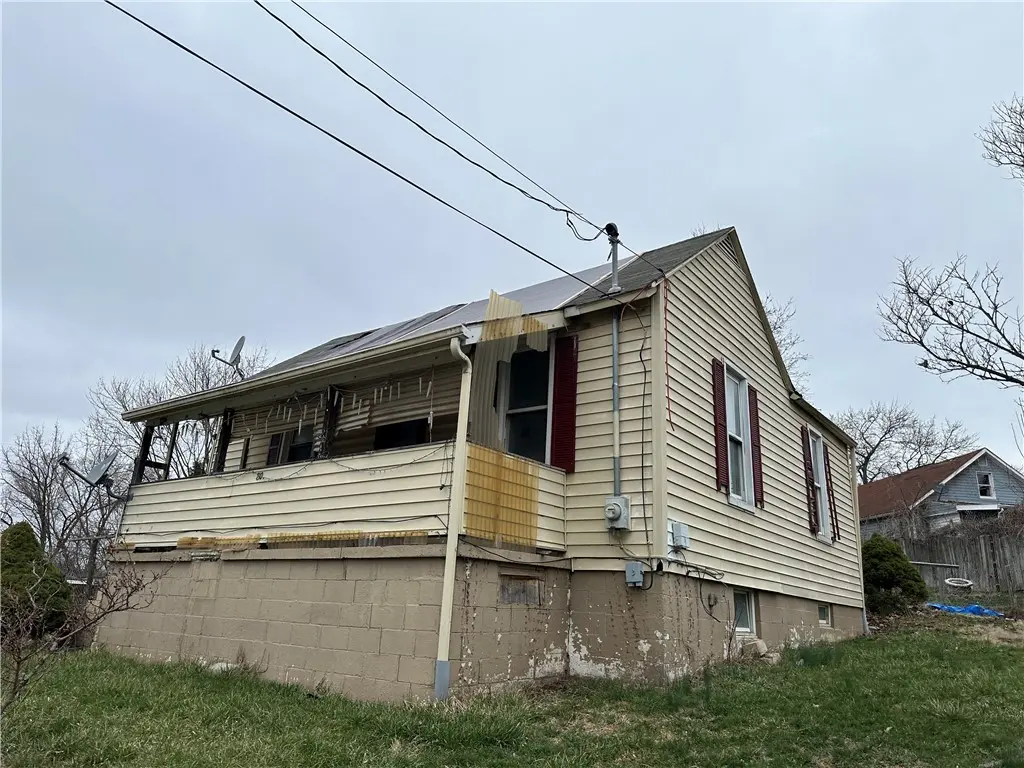
80 Caldwell Ave · Washington, PA
Flood risk 1/10 · Minimal
- FEMA flood zone
- X (unshaded)
- Chance of flooding over 30 yrs
- 0.0%
- Est. flood insurance / yr
- $473 – $860
Fire risk 1/10 · Minimal
- Est. fire insurance / yr
- $511 – $949
Heat risk 3/10 · Minor
- Hot days now (above 97°F)
- 7 days/yr
- Hot days in 30 yrs
- 18 days/yr
Wind risk 2/10 · Minimal
- Chance of severe wind over 30 yrs
- 0.0%
Air-quality risk 2/10 · Minimal
- Unhealthy air days now
- 1 days/yr
- Unhealthy air days in 30 yrs
- 1 days/yr
Risk factors via First Street. Map © Google.
Why this score? — see what drove the B grade
The composite is a weighted blend of 9 inputs, each scored 0–100. Each bar is that input's sub-score; the figure is the points it added to the 100-point composite (weight × sub-score).
- Cash flow +30.0/30.0
- 1% rule +10.0/10.0
- DSCR +10.0/10.0
- ARV discount +7.5/15.0
- Schools +4.3/10.0
- Livability +4.2/5.0
- Rent growth +3.3/5.0
- Condition / age +2.5/5.0
- Appreciation +0.0/10.0
$44,700
🖨 Deal sheet 📄 Offer letter ✓ Due diligence
Listing remarks MLS
Located on a corner lot and features a covered front porch, rear patio, and detached garage.
Key facts
- Covered front porch
- Rear patio
- Corner lot
Tags
Neighborhood map
What this means for you Summary
Snapshot
- This is a 2-bed/1.0-bath single-family listed at $45k.
Deal economics
- At list price, monthly cash flow is $410 ($5k/yr) — positive.
- The deal already cash-flows at list — no discount required.
- Meets the 1% rule at list price ($963 rent vs $45k).
- Recommended offer: $39k (12.0% below list) — sets the bar for market timing.
- Cap rate 17.3% vs local median 2.8% in Washington — top-decile yield for the area; either an underpriced asset or a hidden risk that comps aren't pricing in. Stress-test before assuming the spread holds.
Location & tenants
- Location reads 85/100 on livability (#77 in PA, #558 nationally) — a professional / high-income tenant draw. Strengths: amenities A+, commute A+, cost of living A+; Watch: employment D-.
- Trinity Area SD (suburban): math 39% / reading 61% proficiency, ranked #172 of 539 in PA (top 32%) — acceptable for families but not a draw, mixed tenant base, ~2y average lease.
- Market conditions: Rents rising (+3.4%/yr); 163 active listings in the ZIP; 3 comparable units currently listed for rent nearby; rentals leasing fast (median 11d on market — plan ~1-2 weeks tenant-placement turnaround); 489 units permitted in Washington County in 2024 (30 in 5+ unit buildings).
- This rent is only 16% of the median local income ($70k/yr) — well below the 30% rent-burden line; pricing power to push rent on renewal without tenant pushback.
Forward outlook
- Local home prices are declining (-3.0%/yr); year-one equity from $309 of loan paydown is wiped out by about $1k of value loss. Plan a longer hold.
- Washington County population projected to shrink 6% by 2050 — rents likely to lag national; underwrite the cash flow, not the appreciation.
- At projected returns (-3.0% appreciation + 3.4% rent growth), your $13k cash investment doubles in ~3 years — after that, you're playing with house money.
Negotiation context
- It's been on market 336 days — a 12% lower offer ($39k) is reasonable based on typical stale-listing flexibility.
- 4 sale attempts since 23y ago; this cycle's ask has dropped $15k (25%) from the opening price — seller is motivated, your offer sets the floor, not the list.
- Current owner paid $19k; list at $45k implies a 135% gain — meaningful room to come down on a strong offer.
Risks & watch-outs
- Watch-outs: property tax is 2.6% of price; built in 1933 — expect roof / HVAC / electrical / plumbing capex.
Questions for the listing agent
- It's been on market 336 days. Have you received any prior offers? Is the seller open to a 12% concession, seller financing, or rate buy-down credit?
- Built in 1933 — when were the roof, HVAC, electrical panel, plumbing, and water heater last replaced?
- Property tax is high relative to price — has the assessment been appealed recently, and will the sale trigger a re-assessment?
- Why hasn't it sold? Are there any deal-killer items the seller is aware of (foundation, flood, title, zoning, code violations)?
- Is there a deadline driving the sale (1031 exchange, divorce, estate, relocation)? That informs how much negotiation room exists.
- Schools are B-rated — typically a magnet for longer-tenancy family renters. What's the average tenant stay here, and is there a school-zone premium baked into asking?
- What's the average days-on-market for RENTAL listings here right now (not sales)? A rising rental-DOM trend means longer vacancies and softer asking-rent achievability than the comps imply.
- What's the recent tenant-quality profile in this submarket — average credit score on applications, eviction rate, late-payment / NSF rate, and stable-employment percentage? A property-management company in the area should have these aggregated.
- How much new for-sale + rental construction is in the pipeline within 1–3 miles? Heavy new supply typically softens prices + rents 12–24 months out; constrained supply supports both.
Investment metrics
- 1% rule
- 2.16% ✓
- Cap rate
- 17.31%
- Cash-on-cash
- 39.35%
- DSCR
- 2.75
- GRM
- 3.9
CMA / ARV
- ARV (median comp)
- $144,968
- List price
- $44,700
- Delta
- -69.17%
- Verdict
- UNDERPRICED
- Comps
- 20 within 1.0 mi
Show comp detail 5 sales within ~0.75 mi
| Address | Dist | Beds/Ba | Sqft | Sold | Price | $/sf | Match |
|---|---|---|---|---|---|---|---|
| 160 Franklin Farms Rd | 0.71mi | 3/1.0 (+1) | 922 (+2%) | 0mo | $221,000 | $240 | 58 |
| 750 Weirich Ave | 0.59mi | 2/1.0 | 825 (-8%) | 4mo | $129,500 | $157 | 55 |
| 700 Wilmington St | 0.40mi | 2/2.0 | 972 (+8%) | 15mo | $150,000 | $154 | 52 |
| 1660 The Cir | 0.64mi | 2/1.0 | 825 (-8%) | 5mo | $137,000 | $166 | 51 |
| 114 Marra Ave | 0.70mi | 3/1.0 (+1) | 1,035 (+15%) | 14mo | $160,000 | $155 | 26 |
Match score weights: distance 35% · size 25% · config 20% · recency 20%. Top-matched comps best support the ARV.
Projected returns pro-forma
-3.0% appreciation · 3.38% rent growth · sell at horizon
- IRR
- 36.1%
- Equity multiple
- 2.54×
- Total profit
- $19,305
- Equity at exit
- $6,665
- IRR
- 43.0%
- Equity multiple
- 5.17×
- Total profit
- $52,160
- Equity at exit
- $3,865
Cash invested: $12,516 (down + closing). Projections, not guarantees.
Landlord ↔ Tenant lean methodology
- Overall (STATE)
- 62 Landlord-Friendly
- State Pennsylvania
- 62 Landlord-Friendly · EVEN
- County
- — inherits STATE
- City
- — inherits STATE
ZIP-level market 15301
- Home prices YoY
- -21.9%
- Rents YoY
- 3.4%
- Active inventory
- 163
- Price-to-rent
- 3.9×
Monthly cashflow live
- Estimated rent
- $963 medium interval (Pro) →
- Mortgage (P&I)
- −$234
- Tax from tax record
- −$98 /mo · $1,172/yr
- Insurance
- −$19
- HOA
- −$0
- Vacancy / Maint / Mgmt
- −$202
- Net cashflow
- $410
Break-even live
UW: 25.0% down · 7.5% · 30yr · 1.5% tax · 5.0% vac · 8.0% maint · 8.0% mgmt
Financing live
Cash to close
- Down payment
- $11,175
- Closing costs
- $1,341
- Reserves months
- —
- Total cash needed
- —
Loan-product check · same deal, 3 products live
Conventional
25% down · 7.5% · 30yr
- Down + closing
- —
- Monthly P&I
- —
- Monthly cashflow
- —
- DSCR
- —
- Eligible?
- —
Personal DTI + credit; lowest rate.
DSCR
20% down · 8.5% · 30yr
- Down + closing
- —
- Monthly P&I
- —
- Monthly cashflow
- —
- DSCR
- —
- Eligible?
- —
No personal income docs; deal must DSCR.
Hard money
10% down · 12.0% · 12mo
- Down + closing
- —
- Monthly P&I
- —
- Monthly cashflow
- —
- DSCR
- —
- Eligible?
- —
Short-term bridge; refi at stabilization.
Rent comps 3 comps
| Address | Beds | Baths | Sqft | Rent | $/sqft | DOM | Units | Dist |
|---|---|---|---|---|---|---|---|---|
| 360 Duncan Ave Washington, PA | 1.0 | 1.0 | 600 | $800 | $1.33 | 10d | 1 | 0.92mi |
| 410 W Hallam Ave Unit 410 Washington, PA | 1.0 | 1.0 | 830 | $850 | $1.02 | 23d | 1 | 0.93mi |
| 235 W Chestnut St Washington, PA | 1.0–3.0 | 1.0 | 975 | $1,110 | $1.14 | 1d | 4 | 0.95mi |
Listing history 14 events
-
2026-05-19status Pending 92-char remark
Show marketing remark (92 chars)
Located on a corner lot and features a covered front porch, rear patio, and detached garage.
-
2026-03-24price $44,700 92-char remark
Show marketing remark (92 chars)
Located on a corner lot and features a covered front porch, rear patio, and detached garage.
-
2026-01-22price $49,900 92-char remark
Show marketing remark (92 chars)
Located on a corner lot and features a covered front porch, rear patio, and detached garage.
-
2025-06-13$59,700 Active 92-char remark
Show marketing remark (92 chars)
Located on a corner lot and features a covered front porch, rear patio, and detached garage.
-
2025-05-21soldstatus $19,000
-
2024-12-11soldstatus $81,900
-
2009-07-01soldstatus $63,900
-
2009-06-30price $62,900 299-char remark
Show marketing remark (299 chars)
TOTALLY RENOVATED HOUSE!! TASTEFULLY DONE, NEW KITCHEN WITH CERAMIC TILE, NEWER BATH WITH CERAMIC TILE, NICE DINING ROOM AND LIVING ROOM WITH PERGO FLOORING IN LIVING ROOM ALL FRESHLY PAINTED, NEWER ROOF AND VINYL SIDING, NEWER ELECTRIC SERVICE AND FURNACE, DOUBLE LOT, DETACHED GARAGE, CEMENT PATIO
-
2009-06-26soldstatus $63,900 299-char remark
Show marketing remark (299 chars)
TOTALLY RENOVATED HOUSE!! TASTEFULLY DONE, NEW KITCHEN WITH CERAMIC TILE, NEWER BATH WITH CERAMIC TILE, NICE DINING ROOM AND LIVING ROOM WITH PERGO FLOORING IN LIVING ROOM ALL FRESHLY PAINTED, NEWER ROOF AND VINYL SIDING, NEWER ELECTRIC SERVICE AND FURNACE, DOUBLE LOT, DETACHED GARAGE, CEMENT PATIO
-
2009-03-09$63,900 299-char remark
Show marketing remark (299 chars)
TOTALLY RENOVATED HOUSE!! TASTEFULLY DONE, NEW KITCHEN WITH CERAMIC TILE, NEWER BATH WITH CERAMIC TILE, NICE DINING ROOM AND LIVING ROOM WITH PERGO FLOORING IN LIVING ROOM ALL FRESHLY PAINTED, NEWER ROOF AND VINYL SIDING, NEWER ELECTRIC SERVICE AND FURNACE, DOUBLE LOT, DETACHED GARAGE, CEMENT PATIO
-
2004-06-24soldstatus $19,000
-
2004-04-08$22,900
-
2004-03-11soldstatus $6,300
-
2003-06-06$6,300
ⓘ Source: listings_history table (triggers on properties + properties_extension) + one-shot
backfill from property_details.listing_events for pre-trigger history.
Tax reassessment forecast PA · Partial reset (capped growth)
- Current annual tax
- $1,172 · $98/mo
- Projected year-2 tax
- $1,172 · $98/mo
- Expected delta
- $0/yr ($0/mo · 0.0%)
ⓘ Screening estimate from a state-policy table — verify with the county assessor before closing.
Climate risk First Street
- Flood 1/10 Low FEMA zone X (unshaded) · 0% chance over 30 yrs
- Wildfire 1/10 Low
- Heat 3/10 Moderate 7 d/yr ≥97°F today · 18 d/yr by 30 yrs out
- Wind 2/10 Low 0% chance of damaging wind over 30 yrs
- Air quality 2/10 Low 1 unhealthy d/yr today · 1 by 30 yrs out
Nearby sold comps map
Loading sold comps map…
Walkable amenities ~0.75 mi
Loading nearby amenities…
Taxation est. · year 1
- Rental income
- $11,561
- − Mortgage interest
- −$2,504
- − Property taxes
- −$1,172
- − Insurance
- −$224
- − Repairs & maintenance
- −$925
- − Management
- −$925
- − Depreciation
- −$1,300
- Taxable income
- $4,511
- Est. tax owed @ 24.0%
- −$1,083
- After-tax cash flow
- $3,842/yr
For passive investors: Depreciation is non-cash, so a rental often shows a tax loss while cash-flowing — sheltering income. Rental losses are passive: they offset passive income freely, and up to $25,000/yr can offset ordinary (W-2) income if you actively participate and your MAGI is under $100k (phasing out to $0 by $150k); unused losses carry forward. On sale, claimed depreciation is recaptured at up to 25%, and gains may owe capital-gains tax (a 1031 exchange can defer both). Figures are a year-1 estimate at your 24.0% rate — not tax advice; consult a CPA.
Schools (NCES district)
- District
- Trinity Area SD
- NCES district ID
- 4223760
- Math proficiency
- 39% ▼ -20.00%
- Reading proficiency
- 61% ▼ -12.00%
- Median HH income
- $55,734
- Composite
- 43.24/100
- National rank
- #3056
- State rank
- #172 of 539 in PA
Livability — Washington
- Score
- 85/100
- State rank
- #77
- US rank
- #558
Category grades
Schools grade is shown separately in the Schools card above.
Census & demographics
- County
- Washington County · 106,469 people
- City population
- 50,348
- Metro
- Pittsburgh, PA
- Population (ZIP)
- 50,348
- Household income
- $70,473
- Rent vs Own
- Severe rent burden
- 1378.0
Population outlook (Washington County) Hauer SSP2
- Today (2025)
- 208,060 people
- By 2030
- 207,168 · -0.4%
- By 2040
- 202,738 · -2.6%
- By 2050
- 195,269 · -6.1%
- By 2075
- 175,588 · -15.6%
- By 2100
- 145,827 · -29.9%
Race, ethnicity, and origin ACS 2023
- Neighborhood character
- Predominantly White (87%)
- Race & ethnicity
- White 87% Black 5% Two or more races 5% Hispanic / Latino 3% Asian 1%
- Common ancestry
- Romanian 6% Serbian 3% Lithuanian 2%
- Foreign-born
- 3% · Canada, China
- Languages at home
- 96% English-only · Spanish 2% Other Indo-European 1%
Political lean MEDSL · Washington
- 2024 margin
- Strong R (+25.5) · D 36.9% · R 62.4%
- 2008→2024 swing
- -20.8pp toward R · 2008: -4.7pp · 2024: -25.5pp
- All cycles
- 2024: R+25.5 2020: R+22.8 2016: R+25.3 2012: R+13.3 2008: R+4.7
Not yet ingested
- Civics
- —
Market trends
- HPI YoY
- ▼ -66.91%
- Current HPI
- 238.6516
- Rent YoY
- ▲ 3.38%
- Metro
- Pittsburgh, PA
- State GDP YoY
- ▲ 1.68%
- F500 in state
- 34
Industry mix (Fortune 500 HQ in PA)
| Industry | F500 HQs | Revenue |
|---|---|---|
| Healthcare | 2 | $309B |
|
||
| Insurance | 2 | $27B |
|
||
| Telecommunications / Media | 1 | $124B |
|
||
| Industrial Distribution | 1 | $22B |
|
||
| Financial Services | 1 | $20B |
|
||
| Chemicals / Materials | 1 | $18B |
|
||
Price history
+609.5% since first listed14 events — show timeline
- 2026-05-19 Pending — West Penn MLS
- 2026-03-24 Price Changed $44,700 West Penn MLS
- 2026-01-22 Price Changed $49,900 West Penn MLS
- 2025-06-13 Listed $59,700 West Penn MLS
- 2025-05-21 Sold (Public Records) $19,000 Public Records
- 2024-12-11 Sold (Public Records) $81,900 Public Records
- 2009-07-01 Sold (Public Records) $63,900 Public Records
- 2009-06-30 Price Changed $62,900 West Penn MLS
- 2009-06-26 Sold (MLS) $63,900 West Penn MLS
- 2009-03-09 Listed $63,900 West Penn MLS
- 2004-06-24 Sold (MLS) $19,000 West Penn MLS
- 2004-04-08 Listed $22,900 West Penn MLS
- 2004-03-11 Sold (MLS) $6,300 West Penn MLS
- 2003-06-06 Listed $6,300 West Penn MLS
Property tax history
+4.3%/yrLatest (2026): $1,172 · +2.0% YoY. Source: county tax records.
Cash-flow waterfall
monthlySold comps — $/sqft
last 12 mo · ≤1 miLoading sold comps…