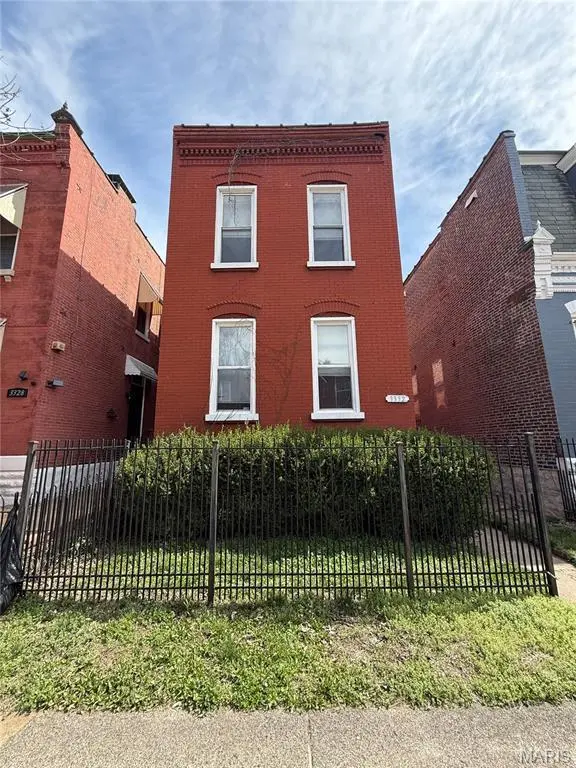
3332 Nebraska Ave · St. Louis, MO
Flood risk 1/10 · Minimal
- FEMA flood zone
- X (unshaded)
- Chance of flooding over 30 yrs
- 0.0%
- Est. flood insurance / yr
- $473 – $860
Fire risk 1/10 · Minimal
- Est. fire insurance / yr
- $1,054 – $1,958
Heat risk 5/10 · Moderate
- Hot days now (above 108°F)
- 7 days/yr
- Hot days in 30 yrs
- 21 days/yr
Wind risk 2/10 · Minimal
- Chance of severe wind over 30 yrs
- 1.0%
Air-quality risk 3/10 · Minor
- Unhealthy air days now
- 3 days/yr
- Unhealthy air days in 30 yrs
- 4 days/yr
Risk factors via First Street. Map © Google.
Why this score? — see what drove the C+ grade
The composite is a weighted blend of 9 inputs, each scored 0–100. Each bar is that input's sub-score; the figure is the points it added to the 100-point composite (weight × sub-score).
- Cash flow +25.0/30.0
- ARV discount +15.0/15.0
- DSCR +8.2/10.0
- 1% rule +5.2/10.0
- Rent growth +3.7/5.0
- Livability +2.5/5.0
- Condition / age +2.5/5.0
- Schools +1.2/10.0
- Appreciation +0.0/10.0
$140,000
🖨 Deal sheet 📄 Offer letter ✓ Due diligence
Listing remarks
If you are looking for your spring project, then you have found it! This charming home is just steps away from Cherokee street is ready it's new owner for an easy renovation. This would make a great fix and flip or BRRRR property. The home has been refreshed since it was built and boasts several modern updates that save both time and money on a renovation. The plaster has been removed and has drywall throughout. The home has an updated electrical panel, electric wiring, PVC stack, PVC plumbing lines, and central HVAC. The kitchen and bathroom on the first floor will need drywall work which was damaged over the winter when the upstairs bathroom sprung a leak. See photos for the damage along
Key facts
- Central hvac
- Modern updates
- Private backyard
Tags
Property features AI
Finance
- Other: Seller may consider concessions
Exterior
- Parking: Parking pad
- Utilities: Public water; Public sewer; Electric service by Ameren; Natural gas available; Electricity connected; Water available; Sewer connected; Cable available
- Home design: Single-family residence; Two levels; Residential property in fixer condition; Private ownership
- Construction: Brick construction; Flat roof; Stone foundation; House structure; Built data from public records
- Exterior features: Private yard; Level lot
Interior
- Kitchen: Dishwasher; Microwave; Electric oven; Free-standing refrigerator
- Bedrooms: 3 bedrooms (all on upper level)
- Flooring: Ceramic tile; Hardwood
- Bathrooms: 2 full bathrooms (1 full bath on main level, 1 full bath on upper level)
- Heating & cooling: Natural gas heating; Central air conditioning; Ceiling fans
- Interior features: Ceiling fans throughout; Crown molding; Eat-in kitchen; Tilt-in windows
- Laundry & utility: Laundry in basement
Neighborhood map
What this means for you Summary
Snapshot
- This is a 3-bed/2.0-bath single-family listed at $140k.
Deal economics
- At list price, monthly cash flow is $307 ($4k/yr) — positive.
- The deal already cash-flows at list — no discount required.
- Meets the 1% rule at list price ($1k rent vs $140k).
- Cap rate 8.9% vs local median 5.0% in St. Louis — top-decile yield for the area; either an underpriced asset or a hidden risk that comps aren't pricing in. Stress-test before assuming the spread holds.
Location & tenants
- Location reads: area grade C — affects rentability + tenant quality, not the cash-flow math above.
- St. Louis City (urban): math 10% / reading 18% proficiency, ranked #312 of 324 in MO (top 96%) — low school quality limits family demand, transient renter base, plan for 1-2y turnover; 80% free/reduced lunch — lower-income household profile, screen leases tightly.
- Zoned schools: Froebel Elem. (math 8% / reading 8%, grade F, #1,052 of 1,115 statewide, top 95%, 176 students, 98% FRL); Roosevelt High (math 2% / reading 8%, grade F, #517 of 521 statewide, top 100%, 460 students, 99% FRL) — zoned schools average 99% FRL vs 80% district-wide (18 pts higher); higher-poverty schools than district average — tighter screening recommended.
- Market conditions: Rents rising fast (+4.9%/yr); 240 active listings in the ZIP; 40 comparable units currently listed for rent nearby; rentals at typical pace (median 24d on market — plan ~3-4 weeks tenant-placement turnaround); 294 units permitted in St. Louis city in 2024 (227 in 5+ unit buildings).
Forward outlook
- Local home prices are declining (-3.0%/yr); year-one equity from $968 of loan paydown is wiped out by about $4k of value loss. Plan a longer hold.
- St. Louis County population projected to shrink 6% by 2050 — rents likely to lag national; underwrite the cash flow, not the appreciation.
- At projected returns (-3.0% appreciation + 4.9% rent growth), your $39k cash investment doubles in ~10 years — after that, you're playing with house money.
Negotiation context
- Only 8 days on market — expect competitive offers; lowballing is unlikely to land.
- 2 sale attempts since 3y ago with the ask held roughly flat each time — persistent listings suggest the price (not the market) is what's stuck; bring a comps-based counter.
Risks & watch-outs
- Watch-outs: built in 1895 — expect roof / HVAC / electrical / plumbing capex.
- Climate carrying-cost: extreme-heat days projected 7→21/yr by 2055 (HVAC capex compounding) — expect insurance premiums to compound above CPI over the hold.
Questions for the listing agent
- Built in 1895 — when were the roof, HVAC, electrical panel, plumbing, and water heater last replaced?
- Is there a deadline driving the sale (1031 exchange, divorce, estate, relocation)? That informs how much negotiation room exists.
- What's the average days-on-market for RENTAL listings here right now (not sales)? A rising rental-DOM trend means longer vacancies and softer asking-rent achievability than the comps imply.
- What's the recent tenant-quality profile in this submarket — average credit score on applications, eviction rate, late-payment / NSF rate, and stable-employment percentage? A property-management company in the area should have these aggregated.
- How much new for-sale + rental construction is in the pipeline within 1–3 miles? Heavy new supply typically softens prices + rents 12–24 months out; constrained supply supports both.
Investment metrics
- 1% rule
- 1.02% ✓
- Cap rate
- 8.92%
- Cash-on-cash
- 9.38%
- DSCR
- 1.42
- GRM
- 8.1
CMA / ARV
- ARV (on-the-fly)
- $259,800
- Comps found
- 12
Show comp detail 12 sales within ~0.75 mi
| Address | Dist | Beds/Ba | Sqft | Sold | Price | $/sf | Match |
|---|---|---|---|---|---|---|---|
| 3332 Nebraska Ave | 0.00mi | 3/2.0 | 1,732 (0%) | 1mo | $140,000 | $81 | 99 |
| 3241 California Ave | 0.15mi | 4/2.5 (+1) | 1,560 (-10%) | 1mo | $125,000 | $80 | 69 |
| 3408 Winnebago St | 0.61mi | 3/2.5 | 1,746 (+1%) | 1mo | $229,500 | $131 | 68 |
| 3000 California Ave | 0.46mi | 3/2.5 | 1,872 (+8%) | 1mo | $280,000 | $150 | 62 |
| 3166 Pennsylvania Ave | 0.28mi | 3/2.5 | 1,982 (+14%) | 0mo | $227,500 | $115 | 61 |
| 3231 Ohio Ave | 0.26mi | 2/2.0 (-1) | 1,510 (-13%) | 1mo | $239,900 | $159 | 61 |
| 2845 Chippewa St | 0.55mi | 3/1.5 | 1,598 (-8%) | 0mo | $205,000 | $128 | 59 |
| 3317 Indiana Ave | 0.42mi | 2/2.5 (-1) | 1,872 (+8%) | 1mo | $345,000 | $184 | 59 |
| 3525 Hartford St | 0.69mi | 4/1.5 (+1) | 1,770 (+2%) | 1mo | $430,000 | $243 | 56 |
| 2921 Virginia Ave | 0.62mi | 3/2.0 | 1,885 (+9%) | 1mo | $335,000 | $178 | 55 |
| 3704 Ohio Ave | 0.51mi | 3/3.5 | 1,938 (+12%) | 1mo | $249,900 | $129 | 50 |
| 2918 Wisconsin Ave | 0.74mi | 3/3.0 | 1,989 (+15%) | 1mo | $379,900 | $191 | 36 |
Match score weights: distance 35% · size 25% · config 20% · recency 20%. Top-matched comps best support the ARV.
Projected returns pro-forma
-3.0% appreciation · 4.89% rent growth · sell at horizon
- IRR
- -0.3%
- Equity multiple
- 0.99×
- Total profit
- $-446
- Equity at exit
- $20,874
- IRR
- 11.0%
- Equity multiple
- 1.93×
- Total profit
- $36,348
- Equity at exit
- $12,105
Cash invested: $39,200 (down + closing). Projections, not guarantees.
Landlord ↔ Tenant lean methodology
- Overall (STATE)
- 81 Strongly Landlord-Friendly
- State Missouri
- 81 Strongly Landlord-Friendly · R+10
- County
- — inherits STATE
- City
- — inherits STATE
ZIP-level market 63118
- Rents YoY
- 4.9%
- Active inventory
- 240
- Price-to-rent
- 8.1×
Monthly cashflow live
- Estimated rent
- $1,435 high interval (Pro) →
- Mortgage (P&I)
- −$734
- Tax from tax record
- −$35 /mo · $415/yr
- Insurance
- −$58
- HOA
- −$0
- Vacancy / Maint / Mgmt
- −$301
- Net cashflow
- $307
Break-even live
UW: 25.0% down · 7.5% · 30yr · 1.5% tax · 5.0% vac · 8.0% maint · 8.0% mgmt
Financing live
Cash to close
- Down payment
- $35,000
- Closing costs
- $4,200
- Reserves months
- —
- Total cash needed
- —
Loan-product check · same deal, 3 products live
Conventional
25% down · 7.5% · 30yr
- Down + closing
- —
- Monthly P&I
- —
- Monthly cashflow
- —
- DSCR
- —
- Eligible?
- —
Personal DTI + credit; lowest rate.
DSCR
20% down · 8.5% · 30yr
- Down + closing
- —
- Monthly P&I
- —
- Monthly cashflow
- —
- DSCR
- —
- Eligible?
- —
No personal income docs; deal must DSCR.
Hard money
10% down · 12.0% · 12mo
- Down + closing
- —
- Monthly P&I
- —
- Monthly cashflow
- —
- DSCR
- —
- Eligible?
- —
Short-term bridge; refi at stabilization.
Rent comps 40 comps
| Address | Beds | Baths | Sqft | Rent | $/sqft | DOM | Units | Dist |
|---|---|---|---|---|---|---|---|---|
| 3259 Oregon Ave St. Louis, MO | 2.0 | 1.0 | 1200 | $1,000 | $0.83 | 43d | 1 | 0.08mi |
| 3233 Oregon Ave Unit 2 St. Louis, MO | 2.0 | 1.0 | 1215 | $995 | $0.82 | 23d | 1 | 0.13mi |
| 3215 Oregon Ave Unit 1F St. Louis, MO | 2.0 | 1.0 | 1373 | $1,150 | $0.84 | 17d | 1 | 0.16mi |
| 3510 California Ave Saint Louis, MO | 3.0 | 2.0 | 1800 | $1,200 | $0.67 | 43d | 1 | 0.25mi |
| 3534 Nebraska Ave Saint Louis, MO | 2.0 | 1.0 | 1100 | $1,100 | $1.00 | 43d | 1 | 0.26mi |
| 3429 Ohio Ave Saint Louis, MO | 3.0 | 3.0 | 1938 | $2,250 | $1.16 | 16d | 1 | 0.26mi |
| 3506 S Compton Ave Saint Louis, MO | 2.0 | 2.0 | 1100 | $1,300 | $1.18 | 10d | 1 | 0.32mi |
| 3410 Virginia Ave Unit B St. Louis, MO | 2.0 | 2.0 | 1442 | $1,375 | $0.95 | 16d | 1 | 0.32mi |
| 3540 Michigan Ave Saint Louis, MO | 4.0 | 2.0 | 1758 | $1,800 | $1.02 | 1d | 1 | 0.33mi |
| 3280 Gravois Ave St. Louis, MO | 2.0 | 1.0 | 1133 | $895 | $0.79 | 23d | 1 | 0.35mi |
| 3411 Cherokee St St. Louis, MO | 4.0 | 2.0 | 1568 | $1,850 | $1.18 | 43d | 1 | 0.41mi |
| 2634 Arsenal St St. Louis, MO | 2.0 | 1.0 | 1500 | $1,400 | $0.93 | 23d | 1 | 0.43mi |
| 2636 Arsenal St St. Louis, MO | 2.0 | 1.0 | 1500 | $1,400 | $0.93 | 23d | 1 | 0.44mi |
| 3009 Pennsylvania Ave Saint Louis, MO | 1.0–2.0 | 1.0–2.0 | 928 | $1,195 | $1.29 | 20d | 6 | 0.48mi |
| 3521 Utah St Unit 3525 St. Louis, MO | 2.0 | 1.0 | 1100 | $1,445 | $1.31 | 4d | 1 | 0.56mi |
| 2918 Louisiana Ave Unit A St. Louis, MO | 2.0 | 1.0 | 1173 | $1,275 | $1.09 | 7d | 1 | 0.64mi |
| 3450 Wisconsin Ave Saint Louis, MO | 1.0–3.0 | 1.0–2.0 | 1219 | $2,300 | $1.89 | 1d | 15 | 0.66mi |
| 3430 Grace Ave Unit 3432 St. Louis, MO | 2.0 | 1.0 | 1106 | $1,475 | $1.33 | 43d | 1 | 0.68mi |
| 3131 Keokuk St #3131 Saint Louis, MO | 3.0 | 2.0 | 1500 | $1,475 | $0.98 | 14d | 1 | 0.70mi |
| 3628 Wyoming St Unit 2F St. Louis, MO | 4.0 | 1.0 | 1700 | $1,950 | $1.15 | 43d | 1 | 0.70mi |
| 2664 Nebraska Ave Unit 2F Saint Louis, MO | 3.0 | 1.0 | 1350 | $1,150 | $0.85 | 23d | 1 | 0.71mi |
| 3146 Keokuk St Saint Louis, MO | 3.0 | 1.0 | 1528 | $1,500 | $0.98 | 23d | 1 | 0.73mi |
| 3458 Giles Ave Saint Louis, MO | 3.0 | 2.5 | 2204 | $2,400 | $1.09 | 7d | 1 | 0.74mi |
| 3914 Michigan Ave Saint Louis, MO | 2.0 | 1.0 | 1376 | $1,150 | $0.84 | 43d | 1 | 0.74mi |
| 3612 Hartford St Unit 3614 St. Louis, MO | 2.0 | 1.0 | 1100 | $1,300 | $1.18 | 10d | 1 | 0.75mi |
| 1917 Arsenal St Saint Louis, MO | 2.0 | 1.0 | 1239 | $1,250 | $1.01 | 19d | 1 | 0.76mi |
| 3501-3503 Pestalozzi St Unit A St. Louis, MO | 2.0 | 1.5 | 1200 | $1,295 | $1.08 | 23d | 1 | 0.78mi |
| 3428 Dunnica Ave Saint Louis, MO | 2.0 | 1.0 | 1050 | $995 | $0.95 | 43d | 1 | 0.78mi |
| 3319 S 18th St Saint Louis, MO | 2.0 | 1.5 | 1368 | $1,600 | $1.17 | 43d | 1 | 0.79mi |
| 2602 Minnesota Ave Saint Louis, MO | 2.0 | 1.5 | 1664 | $1,950 | $1.17 | 4d | 1 | 0.81mi |
| 3526 S Spring Ave Saint Louis, MO | 4.0 | 2.0 | 2244 | $2,877 | $1.28 | 43d | 1 | 0.84mi |
| 2500 Ohio Ave St. Louis, MO | 1.0–2.0 | 1.0–2.0 | 845 | $1,895 | $2.24 | 1d | 19 | 0.86mi |
| 2606 Louisiana Ave Unit 2N St. Louis, MO | 2.0 | 1.0 | 1110 | $1,295 | $1.17 | 14d | 1 | 0.88mi |
| 2327 Texas Ave Unit 211 St. Louis, MO | 3.0 | 2.0 | 1075 | $1,945 | $1.81 | 43d | 1 | 0.92mi |
| 2327 Texas Ave Apt 205 St. Louis, MO | 3.0 | 2.0 | 1375 | $2,095 | $1.52 | 17d | 1 | 0.92mi |
| 2239 California Ave Saint Louis, MO | 2.0 | 2.0 | 1182 | $1,750 | $1.48 | 17d | 1 | 0.99mi |
| 4126 Minnesota Ave Unit 2f St. Louis, MO | 2.0 | 1.0 | 1150 | $1,028 | $0.89 | 23d | 1 | 0.99mi |
| 4130 Minnesota Ave Saint Louis, MO | 2.0 | 1.0 | 1234 | $975 | $0.79 | 14d | 1 | 1.00mi |
| 4127 Minnesota Ave Unit 2F St. Louis, MO | 3.0 | 1.0 | 1155 | $1,200 | $1.04 | 43d | 1 | 1.00mi |
| 4127 Minnesota Ave Unit 1F St. Louis, MO | 3.0 | 1.0 | 1155 | $1,200 | $1.04 | 43d | 1 | 1.00mi |
Listing history 12 events
-
2026-05-01status Pending
-
2026-04-23$140,000 Active
-
2024-01-21historical $1,350
-
2023-11-30$1,350
-
2021-09-22soldstatus
-
2016-03-16soldstatus $637,500
-
2007-04-13soldstatus $52,000
-
2001-03-30soldstatus $75,000
-
2001-02-07soldstatus $22,500
-
2001-01-23soldstatus $65,000
-
1998-06-19soldstatus
-
1997-01-27soldstatus $20,000
ⓘ Source: listings_history table (triggers on properties + properties_extension) + one-shot
backfill from property_details.listing_events for pre-trigger history.
Tax reassessment forecast MO · Resets to sale price
- Current annual tax
- $415 · $35/mo
- Projected year-2 tax
- $1,358 · $113/mo
- Expected delta
- +$943/yr (+$79/mo · 227.4%)
ⓘ Screening estimate from a state-policy table — verify with the county assessor before closing.
Climate risk First Street
- Flood 1/10 Low FEMA zone X (unshaded) · 0% chance over 30 yrs
- Wildfire 1/10 Low
- Heat 5/10 Major 7 d/yr ≥108°F today · 21 d/yr by 30 yrs out
- Wind 2/10 Low 100% chance of damaging wind over 30 yrs
- Air quality 3/10 Moderate 3 unhealthy d/yr today · 4 by 30 yrs out
Nearby sold comps map
Loading sold comps map…
Walkable amenities ~0.75 mi
Loading nearby amenities…
Taxation est. · year 1
- Rental income
- $17,220
- − Mortgage interest
- −$7,842
- − Property taxes
- −$415
- − Insurance
- −$700
- − Repairs & maintenance
- −$1,378
- − Management
- −$1,378
- − Depreciation
- −$4,073
- Taxable income
- $1,435
- Est. tax owed @ 24.0%
- −$344
- After-tax cash flow
- $3,334/yr
For passive investors: Depreciation is non-cash, so a rental often shows a tax loss while cash-flowing — sheltering income. Rental losses are passive: they offset passive income freely, and up to $25,000/yr can offset ordinary (W-2) income if you actively participate and your MAGI is under $100k (phasing out to $0 by $150k); unused losses carry forward. On sale, claimed depreciation is recaptured at up to 25%, and gains may owe capital-gains tax (a 1031 exchange can defer both). Figures are a year-1 estimate at your 24.0% rate — not tax advice; consult a CPA.
Schools (NCES district)
- District
- St. Louis City
- NCES district ID
- 2929280
- Math proficiency
- 10% ▼ -6.00%
- Reading proficiency
- 18% ▼ -3.00%
- Median HH income
- $35,685
- Composite
- 11.54/100
- National rank
- #9699
- State rank
- #312 of 324 in MO
Livability — St. Louis
No livability data for this city. (Only ~50 U.S. cities are tracked.)
Census & demographics
- Census place
- St. Louis, MO
- County
- Saint Louis City · 254,015 people
- City population
- 283,259
- Metro
- St. Louis, MO-IL
- Population (ZIP)
- 25,913
- Household income
- $57,762
- Rent vs Own
- Severe rent burden
- 1495.0
Population outlook (St. Louis County) Hauer SSP2
- Today (2025)
- 315,737 people
- By 2030
- 313,865 · -0.6%
- By 2040
- 305,439 · -3.3%
- By 2050
- 296,529 · -6.1%
- By 2075
- 271,028 · -14.2%
- By 2100
- 255,359 · -19.1%
Race, ethnicity, and origin ACS 2023
- Neighborhood character
- Diverse neighborhood (Simpson 0.63)
- Race & ethnicity
- White 44% Black 41% Two or more races 8% Hispanic / Latino 8% Asian 2%
- Hispanic origin (detail)
- Mexican 6%
- Common ancestry
- Slovak 2% Lithuanian 2% Romanian 2%
- Foreign-born
- 6% · Canada, Vietnam
- Languages at home
- 90% English-only · Spanish 5% Vietnamese 1% French/Haitian/Cajun 1%
Political lean MEDSL · St. Louis
- 2024 margin
- Solid D (+64.7) · D 81.4% · R 16.7% · Other 2.0%
- 2008→2024 swing
- -3.5pp toward R · 2008: 68.2pp · 2024: 64.7pp
- All cycles
- 2024: D+64.7 2020: D+66.2 2016: D+63.7 2012: D+66.6 2008: D+68.2
Not yet ingested
- Civics
- —
Market trends
- HPI YoY
- ▼ -347.51%
- Current HPI
- 171.5963
- Rent YoY
- ▲ 4.89%
- Metro
- St. Louis, MO-IL
- State GDP YoY
- ▲ 1.84%
- F500 in state
- 20
Industry mix (Fortune 500 HQ in MO)
| Industry | F500 HQs | Revenue |
|---|---|---|
| Healthcare | 1 | $163B |
|
||
| Insurance | 1 | $21B |
|
||
| Industrial Technology | 1 | $17B |
|
||
| Retail | 1 | $16B |
|
||
| Industrial Distribution | 1 | $10B |
|
||
| Utilities | 1 | $9B |
|
||
Price history
+600.0% since first listed12 events — show timeline
- 2026-05-01 Pending — MARIS as Distributed by MLS Grid
- 2026-04-23 Listed $140,000 MARIS as Distributed by MLS Grid
- 2024-01-21 Rental Removed $1,350 PROPERTYWARE
- 2023-11-30 Listed for Rent $1,350 PROPERTYWARE
- 2021-09-22 Sold (MLS) — MARIS as Distributed by MLS Grid
- 2016-03-16 Sold (Public Records) $637,500 Public Records
- 2007-04-13 Sold (Public Records) $52,000 Public Records
- 2001-03-30 Sold (Public Records) $75,000 Public Records
- 2001-02-07 Sold (Public Records) $22,500 Public Records
- 2001-01-23 Sold (Public Records) $65,000 Public Records
- 1998-06-19 Sold (Public Records) — Public Records
- 1997-01-27 Sold (Public Records) $20,000 Public Records
Property tax history
+2.4%/yrLatest (2024): $415 · +4.8% YoY. Source: county tax records.
Cash-flow waterfall
monthlySold comps — $/sqft
last 12 mo · ≤1 miLoading sold comps…