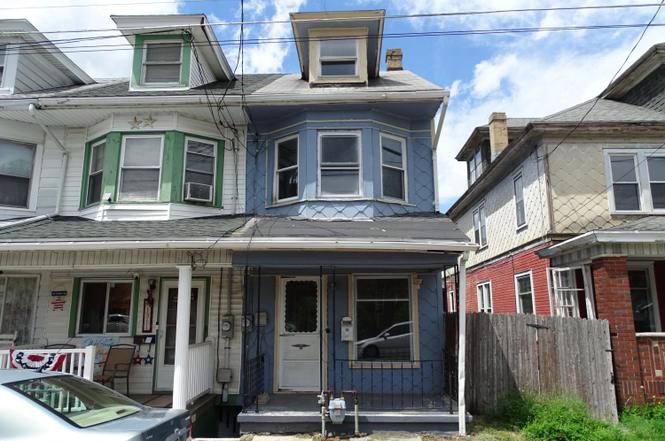
1309 W Spruce St · Edgewood, PA
Flood risk No data
- FEMA flood zone
- —
- Chance of flooding over 30 yrs
- %
- Est. flood insurance / yr
- —
Fire risk No data
- Est. fire insurance / yr
- —
Heat risk No data
- Hot days now (above °F)
- days/yr
- Hot days in 30 yrs
- days/yr
Wind risk No data
- Chance of severe wind over 30 yrs
- %
Air-quality risk No data
- Unhealthy air days now
- days/yr
- Unhealthy air days in 30 yrs
- days/yr
Risk factors via First Street. Map © Google.
Why this score? — see what drove the A- grade
The composite is a weighted blend of 9 inputs, each scored 0–100. Each bar is that input's sub-score; the figure is the points it added to the 100-point composite (weight × sub-score).
- Cash flow +30.0/30.0
- ARV discount +15.0/15.0
- 1% rule +10.0/10.0
- DSCR +10.0/10.0
- Livability +4.5/5.0
- Appreciation +4.4/10.0
- Rent growth +2.5/5.0
- Condition / age +2.5/5.0
- Schools +2.4/10.0
$54,900
🖨 Deal sheet (PDF) 📄 Offer letter ✓ Due diligence
Listing remarks
This 3-bedroom, 1-bath half-double offers a great opportunity for buyers looking for a project. The home sits near the end of Spruce Street in Coal Township and features gas heat, hardwood floors, and a nicely sized yard. Being sold as-is.
Key facts
- Nicely sized yard
- Gas heat
- Hardwood floors
Tags
Neighborhood map
What this means for you Summary
Snapshot
- This is a 3-bed/1.0-bath single-family listed at $55k.
Deal economics
- At list price, monthly cash flow is $298 ($4k/yr) — positive.
- The deal already cash-flows at list — no discount required.
- Meets the 1% rule at list price ($857 rent vs $55k).
Location & tenants
- Location reads 91/100 on livability (#14 in PA, #64 nationally) — a professional / high-income tenant draw. Strengths: schools A+, commute A+, employment A+; Watch: health & safety D+.
- Shamokin Area SD (town): math 19% / reading 40% proficiency, ranked #450 of 539 in PA (top 84%) — low school quality limits family demand, transient renter base, plan for 1-2y turnover.
- Market conditions: 30 active listings in the ZIP; 6 comparable units currently listed for rent nearby; rentals lingering (median 44d on market — plan ~5-8 weeks vacancy on turnover, expect pricing pressure); 100% of comp listings sitting > 30 days — soft ceiling on asking rent; 81 units permitted in Northumberland County in 2024 (0 in 5+ unit buildings).
Forward outlook
- Local home prices are declining (-1.3%/yr); year-one equity from $380 of loan paydown is wiped out by about $709 of value loss. Plan a longer hold.
- Northumberland County population projected at -11% by 2050 — secular population decline; favor cash flow + early exit over multi-decade hold.
- At projected returns (-1.3% appreciation + 3.0% rent growth), your $15k cash investment doubles in ~5 years — after that, you're playing with house money.
Negotiation context
- Only 1 days on market — expect competitive offers; lowballing is unlikely to land.
Risks & watch-outs
- Watch-outs: built in 1924 — expect roof / HVAC / electrical / plumbing capex.
Questions for the listing agent
- Built in 1924 — when were the roof, HVAC, electrical panel, plumbing, and water heater last replaced?
- Is there a deadline driving the sale (1031 exchange, divorce, estate, relocation)? That informs how much negotiation room exists.
- Schools are A-rated — typically a magnet for longer-tenancy family renters. What's the average tenant stay here, and is there a school-zone premium baked into asking?
- What's the average days-on-market for RENTAL listings here right now (not sales)? A rising rental-DOM trend means longer vacancies and softer asking-rent achievability than the comps imply.
- What's the recent tenant-quality profile in this submarket — average credit score on applications, eviction rate, late-payment / NSF rate, and stable-employment percentage? A property-management company in the area should have these aggregated.
- How much new for-sale + rental construction is in the pipeline within 1–3 miles? Heavy new supply typically softens prices + rents 12–24 months out; constrained supply supports both.
Investment metrics
- 1% rule
- 1.56% ✓
- Cap rate
- 12.80%
- Cash-on-cash
- 23.24%
- DSCR
- 2.03
- GRM
- 5.3
CMA / ARV
- ARV (on-the-fly)
- $85,680
- Comps found
- 12
Show comp detail 12 sales within ~0.75 mi
| Address | Dist | Beds/Ba | Sqft | Sold | Price | $/sf | Match |
|---|---|---|---|---|---|---|---|
| 12 N Locust St | 0.12mi | 3/1.0 | 1,040 (+3%) | 12mo | $42,000 | $40 | 79 |
| 1610 W Willow St | 0.33mi | 3/1.0 | 1,040 (+3%) | 3mo | $144,900 | $139 | 77 |
| 519 N 1st St | 0.47mi | 3/1.0 | 998 (-1%) | 3mo | $84,900 | $85 | 74 |
| 1530 Fern St W | 0.39mi | 3/1.0 | 1,052 (+4%) | 3mo | $100,000 | $95 | 72 |
| 1205 W Fern St | 0.34mi | 3/1.5 | 1,048 (+4%) | 6mo | $90,000 | $86 | 71 |
| 1012 W Willow St | 0.31mi | 2/1.0 (-1) | 1,040 (+3%) | 13mo | $52,000 | $50 | 64 |
| 24 S Oak St | 0.30mi | 2/1.0 (-1) | 936 (-7%) | 9mo | $27,500 | $29 | 61 |
| 807 W Walnut St | 0.46mi | 4/1.0 (+1) | 1,040 (+3%) | 9mo | $24,000 | $23 | 61 |
| 1034 W Mulberry St | 0.26mi | 3/1.5 | 1,125 (+12%) | 11mo | $150,000 | $133 | 57 |
| 207 S 6th St | 0.67mi | 3/1.0 | 950 (-6%) | 5mo | $44,000 | $46 | 55 |
| 1704 W Mulberry St | 0.34mi | 3/1.5 | 1,120 (+11%) | 11mo | $169,000 | $151 | 54 |
| 1644 W Walnut St | 0.33mi | 3/1.0 | 1,144 (+14%) | 11mo | $82,500 | $72 | 53 |
Match score weights: distance 35% · size 25% · config 20% · recency 20%. Top-matched comps best support the ARV.
Projected returns pro-forma
-1.29% appreciation · 3.0% rent growth · sell at horizon
- IRR
- 20.4%
- Equity multiple
- 1.92×
- Total profit
- $14,116
- Equity at exit
- $12,485
- IRR
- 26.3%
- Equity multiple
- 3.63×
- Total profit
- $40,493
- Equity at exit
- $12,467
Cash invested: $15,372 (down + closing). Projections, not guarantees.
Landlord ↔ Tenant lean methodology
- Overall (STATE)
- 62 Landlord-Friendly
- State Pennsylvania
- 62 Landlord-Friendly · EVEN
- County
- — inherits STATE
- City
- — inherits STATE
ZIP-level market 17866
- Home prices YoY
- -1.1%
- Active inventory
- 30
- Price-to-rent
- 5.3×
Monthly cashflow live
- Estimated rent
- $857 high interval (Pro) →
- Mortgage (P&I)
- −$288
- Tax est. 1.5%
- −$69 /mo · $824/yr
- Insurance
- −$23
- HOA
- −$0
- Vacancy / Maint / Mgmt
- −$180
- Net cashflow
- $298
Break-even live
Sensitivity live
| Price | -10% $336 | -5% $317 | +0% $298 | +5% $279 | +10% $260 |
|---|---|---|---|---|---|
| Rent | -10% $230 | -5% $264 | +0% $298 | +5% $332 | +10% $365 |
| Rate | -1.0pp $325 | -0.5pp $312 | base $298 | +0.5pp $283 | +1.0pp $269 |
UW: 25.0% down · 7.5% · 30yr · 1.5% tax · 5.0% vac · 8.0% maint · 8.0% mgmt
Financing live
Cash to close
- Down payment
- $13,725
- Closing costs
- $1,647
- Reserves months
- —
- Total cash needed
- —
Loan-product check · same deal, 3 products live
Conventional
25% down · 7.5% · 30yr
- Down + closing
- —
- Monthly P&I
- —
- Monthly cashflow
- —
- DSCR
- —
- Eligible?
- —
Personal DTI + credit; lowest rate.
DSCR
20% down · 8.5% · 30yr
- Down + closing
- —
- Monthly P&I
- —
- Monthly cashflow
- —
- DSCR
- —
- Eligible?
- —
No personal income docs; deal must DSCR.
Hard money
10% down · 12.0% · 12mo
- Down + closing
- —
- Monthly P&I
- —
- Monthly cashflow
- —
- DSCR
- —
- Eligible?
- —
Short-term bridge; refi at stabilization.
Rent comps 6 comps
| Address | Beds | Baths | Sqft | Rent | $/sqft | DOM | Units | Dist |
|---|---|---|---|---|---|---|---|---|
| 1309 W Spruce St Coal Township, PA | 3.0 | 1.0 | 1275 | $825 | $0.65 | 44d | 1 | 0.03mi |
| 863 W Spruce St Coal Township, PA | 2.0 | 1.0 | 1200 | $695 | $0.58 | 44d | 1 | 0.35mi |
| 804 W Mulberry St Coal Township, PA | 3.0 | 1.0 | 1350 | $1,075 | $0.80 | 44d | 1 | 0.46mi |
| 11 S Market St Fl Rear Shamokin, PA | 3.0 | 1.0 | 950 | $1,000 | $1.05 | 44d | 1 | 0.78mi |
| 11 S Market St Apt B Rear Shamokin, PA | 2.0 | 1.0 | 1100 | $900 | $0.82 | 44d | 1 | 0.78mi |
| 2 S Vine St Shamokin, PA | 3.0 | 1.0 | 1450 | $975 | $0.67 | 44d | 1 | 1.27mi |
Listing history 2 events
-
2026-06-19remarks 239-char remark
-
2026-06-19$54,900 Active 1 DOM
ⓘ Source: listings_history table (triggers on properties + properties_extension) + one-shot
backfill from property_details.listing_events for pre-trigger history.
Nearby sold comps map
Loading sold comps map…
Walkable amenities ~0.75 mi
Loading nearby amenities…
Taxation est. · year 1
- Rental income
- $10,284
- − Mortgage interest
- −$3,075
- − Property taxes
- −$824
- − Insurance
- −$274
- − Repairs & maintenance
- −$823
- − Management
- −$823
- − Depreciation
- −$1,597
- Taxable income
- $2,869
- Est. tax owed @ 24.0%
- −$688
- After-tax cash flow
- $2,883/yr
For passive investors: Depreciation is non-cash, so a rental often shows a tax loss while cash-flowing — sheltering income. Rental losses are passive: they offset passive income freely, and up to $25,000/yr can offset ordinary (W-2) income if you actively participate and your MAGI is under $100k (phasing out to $0 by $150k); unused losses carry forward. On sale, claimed depreciation is recaptured at up to 25%, and gains may owe capital-gains tax (a 1031 exchange can defer both). Figures are a year-1 estimate at your 24.0% rate — not tax advice; consult a CPA.
Schools (NCES district)
- District
- Shamokin Area SD
- NCES district ID
- 4221240
- Math proficiency
- 19% ▼ -13.00%
- Reading proficiency
- 40% ▼ -11.00%
- Median HH income
- $35,380
- Composite
- 24.31/100
- National rank
- #7709
- State rank
- #450 of 539 in PA
Livability — Edgewood
- Score
- 91/100
- State rank
- #14
- US rank
- #64
Category grades
Schools grade is shown separately in the Schools card above.
Census & demographics
- Census place
- Edgewood, PA
- Population (ZIP)
- 9,808
Population outlook (Northumberland County) Hauer SSP2
- Today (2025)
- 90,896 people
- By 2030
- 89,084 · -2.0%
- By 2040
- 84,822 · -6.7%
- By 2050
- 80,521 · -11.4%
- By 2075
- 72,152 · -20.6%
- By 2100
- 62,257 · -31.5%
Race, ethnicity, and origin ACS 2023
- Neighborhood character
- Predominantly White (79%)
- Race & ethnicity
- White 79% Black 15% Hispanic / Latino 4% Two or more races 2%
- Common ancestry
- Romanian 12% Iranian 4% Subsaharan African 2%
- Foreign-born
- 1%
- Languages at home
- 97% English-only · Spanish 3%
Political lean MEDSL · Northumberland
- 2024 margin
- Solid R (+39.9) · D 29.6% · R 69.5%
- 2008→2024 swing
- -26.1pp toward R · 2008: -13.8pp · 2024: -39.9pp
- All cycles
- 2024: R+39.9 2020: R+38.5 2016: R+43.6 2012: R+19.4 2008: R+13.8
Not yet ingested
- Civics
- —
Market trends
- HPI YoY
- ▼ -1.29%
- Current HPI
- 111.3788
- Rent YoY
- —
- Metro
- —
- State GDP YoY
- ▲ 1.68%
- F500 in state
- 34
Industry mix (Fortune 500 HQ in PA)
| Industry | F500 HQs | Revenue |
|---|---|---|
| Healthcare | 2 | $309B |
|
||
| Insurance | 2 | $27B |
|
||
| Telecommunications / Media | 1 | $124B |
|
||
| Industrial Distribution | 1 | $22B |
|
||
| Financial Services | 1 | $20B |
|
||
| Chemicals / Materials | 1 | $18B |
|
||
Cash-flow waterfall
monthlySold comps — $/sqft
last 12 mo · ≤1 miLoading sold comps…