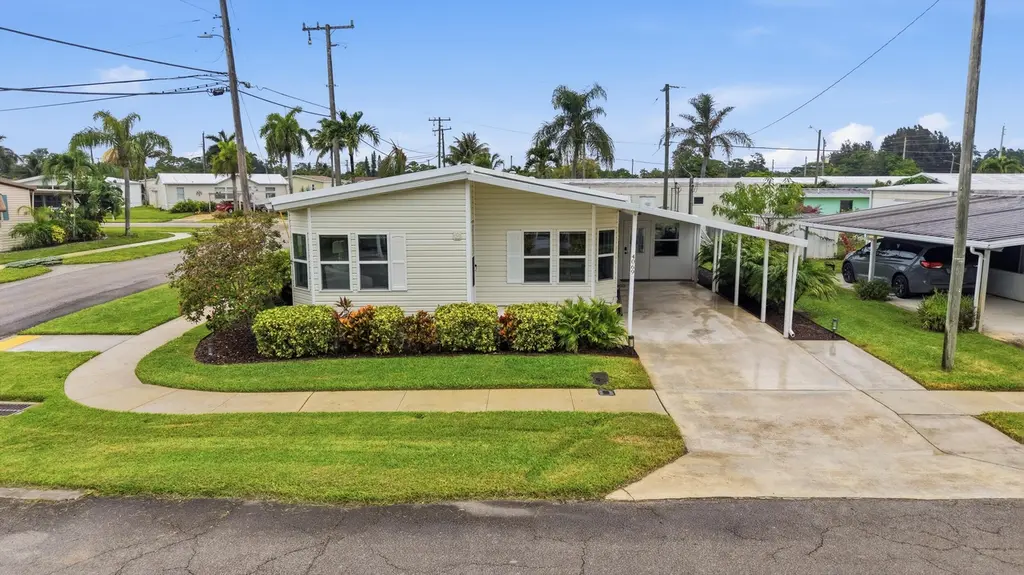
4069 Mission Bell Dr · Boynton Beach, FL
Flood risk 4/10 · Minor
- FEMA flood zone
- X (unshaded)
- Chance of flooding over 30 yrs
- 0.22%
- Est. flood insurance / yr
- $507 – $1,088
Fire risk 1/10 · Minimal
- Est. fire insurance / yr
- $947 – $1,759
Heat risk 9/10 · Severe
- Hot days now (above 106°F)
- 7 days/yr
- Hot days in 30 yrs
- 25 days/yr
Wind risk 10/10 · Severe
- Chance of severe wind over 30 yrs
- 99.0%
Air-quality risk 2/10 · Minimal
- Unhealthy air days now
- 1 days/yr
- Unhealthy air days in 30 yrs
- 2 days/yr
Risk factors via First Street. Map © Google.
Why this score? — see what drove the D grade
The composite is a weighted blend of 9 inputs, each scored 0–100. Each bar is that input's sub-score; the figure is the points it added to the 100-point composite (weight × sub-score).
- Cash flow +15.7/30.0
- ARV discount +7.5/15.0
- DSCR +4.8/10.0
- Schools +4.3/10.0
- 1% rule +4.2/10.0
- Livability +3.6/5.0
- Condition / age +2.5/5.0
- Rent growth +2.4/5.0
- Appreciation +0.0/10.0
$250,000
🖨 Deal sheet 📄 Offer letter ✓ Due diligence
Listing remarks
Welcome home to this beautifully updated, one-of-a-kind two-bedroom, two-bathroom corner lot residence in the low-HOA community of Tropical Breeze Estates, where you own the land with no land lease and enjoy a low quarterly HOA fee of $370. From the moment you enter, you'll notice the meticulous attention to detail and thoughtful upgrades throughout. The home features all-new flooring, updated PEX plumbing, eight additional windows that flood the space with natural light, new siding, shutters, and doors, as well as a dehumidifier in both the main house and screened-in porch. A newer washer and dryer and updated appliances add everyday convenience. The fully renovated kitchen is designed to
Key facts
- Updated pex plumbing
- New siding
- Corner lot
Tags
Property features AI
Finance
- Financial info: Not a land-lease property; Pets allowed with possible restrictions and limits; Community contains approximately 320 units
- HOA & community: Has association (Tropical Breeze Estates); Quarterly association fee; Association covers maintenance of grounds, common areas, and pool service; Community amenities: pool, game room, shuffleboard court, community room, library, manager on site, sidewalks, street lights, on-site management
Exterior
- Parking: 3 total parking spaces (including 1 covered/carport space); Attached carport; Covered parking; Driveway
- Utilities: Public water; Public sewer; Electricity connected; Cable connected; Water connected; Sewer connected
- Home design: Manufactured home (double wide, modular); One story; Resale property; Faces south
- Construction: Modular construction; Double wide body type; Aluminum skirt; Metal roof
- Exterior features: Covered patio; Screened patio and porch; Screened porch; Glass-enclosed porch/patio; Cul-de-sac; Corner lot; Sidewalks; Paved road
Interior
- Kitchen: Dishwasher; Electric range; Microwave; Refrigerator; Electric water heater
- Bedrooms: 2 bedrooms on the main level
- Flooring: Vinyl; Blinds; Shutters
- Bathrooms: 2 full bathrooms on the main level
- Heating & cooling: Central electric heat; Central air; Ceiling fan(s); Electric cooling
- Interior features: Built-in features; Walk-in closet(s)
- Laundry & utility: Laundry closet; Inside laundry room
Neighborhood map
What this means for you Summary
Snapshot
- This is a 2-bed/2.0-bath land listed at $250k.
Deal economics
- At list price, monthly cash flow is $110 ($1k/yr) — positive.
- The deal already cash-flows at list — no discount required.
- To meet the 1% rule (rent ≥ 1% of price), the offer needs to be $229k (8.5% below list).
- Recommended offer: $229k (8.5% below list) — sets the bar for 1% rule.
- Cap rate 6.8% vs local median 4.3% in Boynton Beach — top-decile yield for the area; either an underpriced asset or a hidden risk that comps aren't pricing in. Stress-test before assuming the spread holds.
Location & tenants
- Location reads 72/100 on livability (#351 in FL) — a middle-class / working-renter tenant base. Strengths: housing A+, health & safety B+, cost of living B; Watch: amenities D+, crime D-, commute F.
- Palm Beach (suburban): math 46% / reading 53% proficiency, ranked #34 of 73 in FL (top 47%) — families likely to look elsewhere, expect single-tenant / working-renter base with shorter leases.
- Zoned schools: Citrus Cove Elementary School (math 47% / reading 57%, grade C-, #990 of 2,144 statewide, top 48%, 1,026 students, 59% FRL); Congress Community Middle School (math 21% / reading 28%, grade F, #522 of 571 statewide, top 93%, 988 students, 72% FRL); Boynton Beach Community High (math 13% / reading 25%, grade F, #565 of 667 statewide, top 85%, 1,547 students, 65% FRL).
- Zoned-school proficiency averages 32% at this address vs 50% district-wide (-18 pts) — the specific schools serving this property underperform the Palm Beach average; the district grade overstates school quality for this exact location.
- Market conditions: Rents soft (-0.6%/yr); 445 active listings in the ZIP; 40 comparable units currently listed for rent nearby; rentals at typical pace (median 15d on market — plan ~3-4 weeks tenant-placement turnaround); solid renter incomes; 3,974 units permitted in Palm Beach County in 2024 (1,012 in 5+ unit buildings).
- This rent runs 36% of the median local income ($76k/yr) — at the standard rent-burdened threshold; future hikes will face affordability resistance.
Forward outlook
- Local home prices are declining (-3.0%/yr); year-one equity from $2k of loan paydown is wiped out by about $8k of value loss. Plan a longer hold.
- Palm Beach County population projected at +30% by 2050 — long-run rental-demand tailwind backs the buy-and-hold thesis.
Negotiation context
- It's been on market 35 days — a 3% lower offer ($242k) is reasonable based on typical stale-listing flexibility.
- 4 sale attempts since 11y ago with the ask held roughly flat each time — persistent listings suggest the price (not the market) is what's stuck; bring a comps-based counter.
- Current owner paid $55k; list at $250k implies a 355% gain — meaningful room to come down on a strong offer.
Risks & watch-outs
- Climate carrying-cost: severe wind risk, 99% chance of damaging wind over 30y; extreme-heat days projected 7→25/yr by 2055 (HVAC capex compounding) — expect insurance premiums to compound above CPI over the hold.
Questions for the listing agent
- It's been on market 35 days. Have you received any prior offers? Is the seller open to a 8% concession, seller financing, or rate buy-down credit?
- What does the HOA fee cover, when was the last increase, and are there any pending special assessments or reserve-fund shortfalls?
- Is there a deadline driving the sale (1031 exchange, divorce, estate, relocation)? That informs how much negotiation room exists.
- Crime grade is D in this area — have there been break-ins, vandalism, or insurance claims at this property in the last 3 years? What carrier currently insures it and at what premium?
- The area grade is low — what's the realistic commute time and amenity access for the typical tenant pool here? Any planned neighborhood developments (good or bad) we should know about?
- What's the average days-on-market for RENTAL listings here right now (not sales)? A rising rental-DOM trend means longer vacancies and softer asking-rent achievability than the comps imply.
- What's the recent tenant-quality profile in this submarket — average credit score on applications, eviction rate, late-payment / NSF rate, and stable-employment percentage? A property-management company in the area should have these aggregated.
- How much new for-sale + rental construction is in the pipeline within 1–3 miles? Heavy new supply typically softens prices + rents 12–24 months out; constrained supply supports both.
Investment metrics
- 1% rule
- 0.92% ✗
- Cap rate
- 6.82%
- Cash-on-cash
- 1.88%
- DSCR
- 1.08
- GRM
- 9.1
CMA / ARV
No comps found within radius.
Projected returns pro-forma
-3.0% appreciation · 0.0% rent growth · sell at horizon
- IRR
- -16.7%
- Equity multiple
- 0.43×
- Total profit
- $-40,209
- Equity at exit
- $37,276
- IRR
- -15.0%
- Equity multiple
- 0.26×
- Total profit
- $-51,862
- Equity at exit
- $21,615
Cash invested: $70,000 (down + closing). Projections, not guarantees.
Landlord ↔ Tenant lean methodology
- Overall (STATE)
- 87 Strongly Landlord-Friendly
- State Florida
- 87 Strongly Landlord-Friendly · R+3
- County
- — inherits STATE
- City
- — inherits STATE
ZIP-level market 33436
- Home prices YoY
- -26.0%
- Rents YoY
- -0.6%
- Active inventory
- 445
- Price-to-rent
- 9.1×
Monthly cashflow live
- Estimated rent
- $2,288 high interval (Pro) →
- Mortgage (P&I)
- −$1,311
- Tax from tax record
- −$160 /mo · $1,918/yr
- Insurance
- −$104
- HOA
- −$123
- Vacancy / Maint / Mgmt
- −$481
- Net cashflow
- $110
Break-even live
UW: 25.0% down · 7.5% · 30yr · 1.5% tax · 5.0% vac · 8.0% maint · 8.0% mgmt
Financing live
Cash to close
- Down payment
- $62,500
- Closing costs
- $7,500
- Reserves months
- —
- Total cash needed
- —
Loan-product check · same deal, 3 products live
Conventional
25% down · 7.5% · 30yr
- Down + closing
- —
- Monthly P&I
- —
- Monthly cashflow
- —
- DSCR
- —
- Eligible?
- —
Personal DTI + credit; lowest rate.
DSCR
20% down · 8.5% · 30yr
- Down + closing
- —
- Monthly P&I
- —
- Monthly cashflow
- —
- DSCR
- —
- Eligible?
- —
No personal income docs; deal must DSCR.
Hard money
10% down · 12.0% · 12mo
- Down + closing
- —
- Monthly P&I
- —
- Monthly cashflow
- —
- DSCR
- —
- Eligible?
- —
Short-term bridge; refi at stabilization.
Rent comps 40 comps
| Address | Beds | Baths | Sqft | Rent | $/sqft | DOM | Units | Dist |
|---|---|---|---|---|---|---|---|---|
| 8949 Oak St Boynton Beach, FL | 2.0 | 2.0 | 1040 | $1,300 | $1.25 | 24d | 1 | 0.19mi |
| 3736 Coelebs Ave Boynton Beach, FL | 3.0 | 2.0 | 1232 | $3,000 | $2.44 | 24d | 1 | 0.35mi |
| 4482 King Theodore Dr Boynton Beach, FL | 1.0 | 1.0 | 800 | $1,795 | $2.24 | 24d | 1 | 0.54mi |
| 3930 Max Pl Boynton Beach, FL | 1.0 | 1.0 | 925 | $2,550 | $2.76 | 22d | 1 | 0.57mi |
| 3500 Sandpiper Dr Boynton Beach, FL | 1.0–2.0 | 1.0–2.0 | 1147 | $2,579 | $2.25 | 22d | 22 | 0.59mi |
| 3561 Oberon Ave Boynton Beach, FL | 3.0 | 2.0 | 1248 | $2,850 | $2.28 | 20d | 1 | 0.68mi |
| 920 Sun Acres Ln Boynton Beach, FL | 2.0 | 2.0 | 1352 | $2,200 | $1.63 | 24d | 1 | 0.69mi |
| 9873 Lawrence Rd Boynton Beach, FL | 2.0 | 2.0 | 1200 | $2,267 | $1.89 | 22d | 1 | 0.79mi |
| 9873 Lawrence Rd Boynton Beach, FL | 2.0 | 2.0 | 1200 | $2,315 | $1.93 | 4d | 1 | 0.79mi |
| 9746 Nickels Blvd Boynton Beach, FL | 2.0 | 2.0 | 1215 | $2,800 | $2.30 | 24d | 1 | 0.81mi |
| 220 Savannah Lakes Dr Boynton Beach, FL | 2.0 | 2.0 | 1098 | $2,365 | $2.15 | 3d | 1 | 0.86mi |
| 9940 Bauhinia Tree Way Unit B Boynton Beach, FL | 1.0 | 1.0 | 1200 | $1,800 | $1.50 | 7d | 1 | 0.93mi |
| 9940 Bauhinia Tree Way Unit B Boynton Beach, FL | 1.0 | 1.0 | 1200 | $2,000 | $1.67 | 24d | 1 | 0.93mi |
| 4525 Nutmeg Tree Ln Unit A Boynton Beach, FL | 2.0 | 2.0 | 1404 | $3,000 | $2.14 | 24d | 1 | 0.96mi |
| 9498 S Military Trl #5 Boynton Beach, FL | 3.0 | 2.5 | 1317 | $2,900 | $2.20 | 24d | 1 | 0.97mi |
| 9900 Pineapple Tree Dr #106 Boynton Beach, FL | 2.0 | 2.0 | 1008 | $2,250 | $2.23 | 24d | 1 | 1.01mi |
| 1515 Arezzo Cir Boynton Beach, FL | 2.0 | 2.5 | 1286 | $2,750 | $2.14 | 24d | 1 | 1.04mi |
| 4101 Mahogany Dr Boynton Beach, FL | 1.0–2.0 | 1.0–2.0 | 950 | $2,169 | $2.28 | 3d | 11 | 1.04mi |
| 9935 Pineapple Tree Dr #202 Boynton Beach, FL | 2.0 | 2.0 | 1008 | $2,575 | $2.55 | 15d | 1 | 1.08mi |
| 2303 N Congress Ave #15 Boynton Beach, FL | 2.0 | 1.0 | 925 | $1,950 | $2.11 | 24d | 1 | 1.09mi |
| 2305 N Congress Ave #18 Boynton Beach, FL | 3.0 | 2.0 | 1217 | $2,600 | $2.14 | 15d | 1 | 1.10mi |
| 3 Renaissance Way #210 Boynton Beach, FL | 1.0 | 1.0 | 912 | $1,850 | $2.03 | 4d | 1 | 1.13mi |
| 2313 N Congress Ave #18 Boynton Beach, FL | 2.0 | 1.0 | 758 | $1,950 | $2.57 | 15d | 1 | 1.13mi |
| 2307 N Congress Ave #24 Boynton Beach, FL | 2.0 | 1.0 | 902 | $1,700 | $1.88 | 3d | 1 | 1.14mi |
| 2301 N Congress Ave #25 Boynton Beach, FL | 2.0 | 1.0 | 758 | $2,000 | $2.64 | 24d | 1 | 1.15mi |
| 4408 Renaissance Way Boynton Beach, FL | 2.0 | 2.0 | 1048 | $2,350 | $2.24 | 12d | 1 | 1.15mi |
| 2407 Renaissance Way Boynton Beach, FL | 1.0 | 1.0 | 744 | $1,950 | $2.62 | 7d | 1 | 1.15mi |
| 4408 Renaissance Way Unit 408 Boynton Beach, FL | 2.0 | 2.0 | 1048 | $2,350 | $2.24 | 16d | 1 | 1.15mi |
| 2401 Renaissance Way Boynton Beach, FL | 2.0 | 2.0 | 1048 | $2,400 | $2.29 | 24d | 1 | 1.15mi |
| 3308 Renaissance Way Boynton Beach, FL | 2.0 | 2.0 | 1119 | $2,300 | $2.06 | 5d | 1 | 1.15mi |
| 2 Renaissance Way #305 Boynton Beach, FL | 3.0 | 2.0 | 1367 | $3,200 | $2.34 | 3d | 1 | 1.16mi |
| 4 Renaissance Way #302 Boynton Beach, FL | 1.0 | 1.0 | 747 | $1,945 | $2.60 | 10d | 1 | 1.17mi |
| 2317 N Congress Ave #24 Boynton Beach, FL | 2.0 | 1.0 | 902 | $2,300 | $2.55 | 5d | 1 | 1.19mi |
| 5155 Europa Dr Unit J Boynton Beach, FL | 3.0 | 2.0 | 1333 | $2,750 | $2.06 | 24d | 1 | 1.20mi |
| 1605 Renaissance Commons Blvd Boynton Beach, FL | 1.0–3.0 | 1.0–2.0 | 1148 | $2,538 | $2.21 | 1d | 12 | 1.20mi |
| 1701 Renaissance Commons Blvd Boynton Beach, FL | 2.0 | 2.0 | 922 | $2,629 | $2.85 | 11d | 1 | 1.20mi |
| 1701 Renaissance Commons Blvd Boynton Beach, FL | 1.0–2.0 | 1.0–2.0 | 846 | $2,912 | $3.44 | 1d | 1 | 1.20mi |
| 2319 N Congress Ave #28 Boynton Beach, FL | 2.0 | 2.0 | 1172 | $1,945 | $1.66 | 7d | 1 | 1.21mi |
| 1100 Audace Ave Boynton Beach, FL | 1.0–3.0 | 1.0–2.0 | 1063 | $2,706 | $2.55 | 2d | 24 | 1.21mi |
| 1831 Renaissance Commons Blvd Boynton Beach, FL | 2.0 | 2.0 | 975 | $2,230 | $2.29 | 4d | 1 | 1.23mi |
HOA detail
- Monthly dues
- $123 · $1,476/yr
Listing history 10 events
-
2026-04-21$250,000 Active
-
2017-02-17historical
-
2016-12-29price $110,000
-
2016-10-21status Active
-
2016-10-21historical
-
2016-06-02status Active
-
2016-05-29historical
-
2015-11-06$120,000 Active
-
1997-06-23soldstatus $55,000
-
1987-12-01soldstatus $27,500
ⓘ Source: listings_history table (triggers on properties + properties_extension) + one-shot
backfill from property_details.listing_events for pre-trigger history.
Tax reassessment forecast FL · Resets to sale price
- Current annual tax
- $1,918 · $160/mo
- Projected year-2 tax
- $2,075 · $173/mo
- Expected delta
- +$157/yr (+$13/mo · 8.2%)
ⓘ Screening estimate from a state-policy table — verify with the county assessor before closing.
Climate risk First Street
- Flood 4/10 Moderate FEMA zone X (unshaded) · 22% chance over 30 yrs
- Wildfire 1/10 Low
- Heat 9/10 Extreme 7 d/yr ≥106°F today · 25 d/yr by 30 yrs out
- Wind 10/10 Extreme 99% chance of damaging wind over 30 yrs
- Air quality 2/10 Low 1 unhealthy d/yr today · 2 by 30 yrs out
Nearby sold comps map
Loading sold comps map…
Walkable amenities ~0.75 mi
Loading nearby amenities…
Taxation est. · year 1
- Rental income
- $27,461
- − Mortgage interest
- −$14,004
- − Property taxes
- −$1,918
- − Insurance
- −$1,250
- − Repairs & maintenance
- −$2,197
- − Management
- −$2,197
- − HOA
- −$1,476
- − Depreciation
- −$7,273
- Taxable loss
- −$2,854
- Est. tax savings @ 24.0%
- +$685
- After-tax cash flow
- $2,002/yr
For passive investors: Depreciation is non-cash, so a rental often shows a tax loss while cash-flowing — sheltering income. Rental losses are passive: they offset passive income freely, and up to $25,000/yr can offset ordinary (W-2) income if you actively participate and your MAGI is under $100k (phasing out to $0 by $150k); unused losses carry forward. On sale, claimed depreciation is recaptured at up to 25%, and gains may owe capital-gains tax (a 1031 exchange can defer both). Figures are a year-1 estimate at your 24.0% rate — not tax advice; consult a CPA.
Schools (NCES district)
- District
- Palm Beach
- NCES district ID
- 1201500
- Math proficiency
- 46% ▼ -16.00%
- Reading proficiency
- 53% ▼ -4.00%
- Median HH income
- $53,943
- Composite
- 42.72/100
- National rank
- #3160
- State rank
- #34 of 73 in FL
Livability — Boynton Beach
- Score
- 72/100
- State rank
- #351
- US rank
- #6098
Category grades
Schools grade is shown separately in the Schools card above.
Census & demographics
- County
- Palm Beach County · 1,438,312 people
- City population
- 148,060
- Metro
- Miami-Fort Lauderdale-Pompano Beach, FL
- Population (ZIP)
- 48,743
- Household income
- $75,789
- Rent vs Own
- Severe rent burden
- 1813.0
Population outlook (Palm Beach County) Hauer SSP2
- Today (2025)
- 1,637,487 people
- By 2030
- 1,743,255 · +6.5%
- By 2040
- 1,948,712 · +19.0%
- By 2050
- 2,132,979 · +30.3%
- By 2075
- 2,530,027 · +54.5%
- By 2100
- 2,706,979 · +65.3%
Race, ethnicity, and origin ACS 2023
- Neighborhood character
- Diverse neighborhood (Simpson 0.64)
- Race & ethnicity
- White 52% Black 24% Hispanic / Latino 19% Two or more races 10% Asian 2%
- Hispanic origin (detail)
- Mexican 2% Puerto Rican 4% Cuban 3% Dominican 1%
- Common ancestry
- Hispanic 12% Romanian 3% Scotch-Irish 2%
- Foreign-born
- 27% · Canada, Jamaica, Vietnam
- Languages at home
- 64% English-only · Spanish 14% French/Haitian/Cajun 13% Other Indo-European 2%
Political lean MEDSL · Palm Beach
- 2024 margin
- Toss-up / Even · D 50.0% · R 49.2%
- 2008→2024 swing
- -22.1pp toward R · 2008: 22.9pp · 2024: 0.8pp
- All cycles
- 2024: D+0.8 2020: D+12.8 2016: D+15.3 2012: D+17.0 2008: D+22.9
Not yet ingested
- Civics
- —
Market trends
- HPI YoY
- ▼ -109.59%
- Current HPI
- 311.7742
- Rent YoY
- ▼ -0.57%
- Metro
- Miami-Fort Lauderdale-Pompano Beach, FL
- State GDP YoY
- ▲ 3.28%
- F500 in state
- 36
Industry mix (Fortune 500 HQ in FL)
| Industry | F500 HQs | Revenue |
|---|---|---|
| Industrial Technology | 2 | $29B |
|
||
| Insurance | 2 | $17B |
|
||
| Retail | 1 | $60B |
|
||
| Technology Distribution | 1 | $58B |
|
||
| Homebuilding | 1 | $35B |
|
||
| Technology Manufacturing | 1 | $35B |
|
||
Price history
+809.1% since first listed10 events — show timeline
- 2026-04-21 Listed $250,000 Beaches MLS
- 2017-02-17 Listing Removed — Beaches MLS
- 2016-12-29 Price Changed $110,000 Beaches MLS
- 2016-10-21 Relisted — Beaches MLS
- 2016-10-21 Listing Removed — Beaches MLS
- 2016-06-02 Relisted — Beaches MLS
- 2016-05-29 Listing Removed — Beaches MLS
- 2015-11-06 Listed $120,000 Beaches MLS
- 1997-06-23 Sold (Public Records) $55,000 Public Records
- 1987-12-01 Sold (Public Records) $27,500 Public Records
Property tax history
+2.0%/yrLatest (2025): $1,918 · +2.8% YoY. Source: county tax records.
Cash-flow waterfall
monthlySold comps — $/sqft
last 12 mo · ≤1 miLoading sold comps…