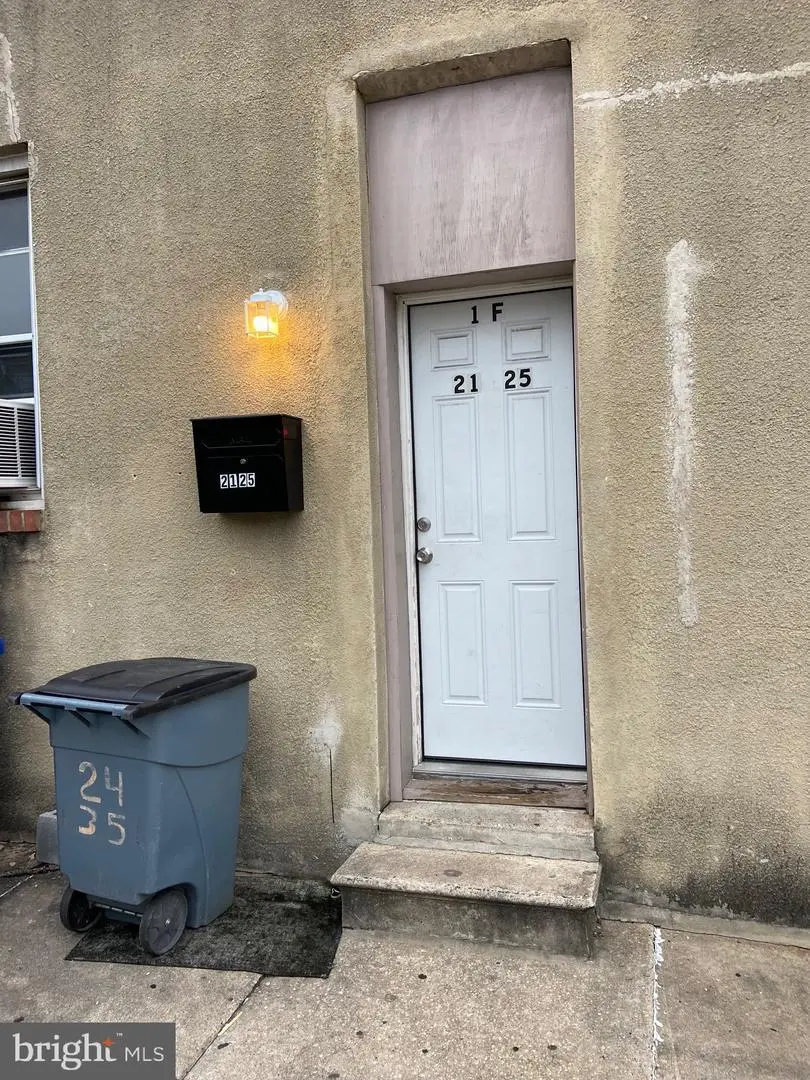
2125 Orleans St Unit 1 & 2 · Baltimore, MD
Flood risk 1/10 · Minimal
- FEMA flood zone
- X (unshaded)
- Chance of flooding over 30 yrs
- 0.0%
- Est. flood insurance / yr
- $473 – $860
Fire risk 1/10 · Minimal
- Est. fire insurance / yr
- $755 – $1,403
Heat risk 7/10 · Major
- Hot days now (above 103°F)
- 7 days/yr
- Hot days in 30 yrs
- 15 days/yr
Wind risk 6/10 · Moderate
- Chance of severe wind over 30 yrs
- 27.0%
Air-quality risk 4/10 · Minor
- Unhealthy air days now
- 6 days/yr
- Unhealthy air days in 30 yrs
- 7 days/yr
Risk factors via First Street. Map © Google.
Why this score? — see what drove the C grade
The composite is a weighted blend of 9 inputs, each scored 0–100. Each bar is that input's sub-score; the figure is the points it added to the 100-point composite (weight × sub-score).
- Cash flow +20.6/30.0
- ARV discount +13.9/15.0
- DSCR +6.5/10.0
- 1% rule +5.4/10.0
- Livability +3.8/5.0
- Rent growth +3.1/5.0
- Condition / age +2.2/5.0
- Schools +1.0/10.0
- Appreciation +0.0/10.0
$299,999
🖨 Deal sheet 📄 Offer letter ✓ Due diligence
Listing remarks
MUST SELL!!! SUBMIT YOUR HIGHEST AND BEST OFFER TODAY!!! Opportunity knocks for the immediate purchase of this vacant 2 units, side by side, residential property, strategically located in close proximity to Johns Hopkins Hospital and Patterson's Park, this unique duplex has a Front (F) unit and a Rear (R) unit on the same level. The front unit comprises 3 bedrooms, 1 bath and a partially finished but usable basement, which extends the entire length of both units. The second unit has 3 bedrooms and 1.5 bath on the main level. Welcome to the biggest opportunity for a First time Home Buyer to live in one unit and rent the other, virtually living mortgage free. For the investor, because
Key facts
- Built 1910
- Listed 44 days
Property features AI
Finance
- Financial info: Lease considered
- HOA & community: Ground rent paid annually
Exterior
- Parking: On-street parking
- Utilities: Public water; Public septic (listed as public septic); 120/240V electric service; 60+ gallon hot water tank
- Home design: End of row townhouse; Two stories; Fee simple ownership
- Construction: Brick construction; Block and brick/mortar foundation; Above-grade finished area reported by assessor; Below-grade finished and unfinished areas reported by assessor
- Exterior features: Not in a federal flood zone; Public water and sewer available; Cable TV available; Natural gas available; Electric service available
Interior
- Kitchen: Stove; Refrigerator
- Bedrooms: Three bedrooms on the first upper level; Three bedrooms on the second upper level
- Flooring: Hardwood; Ceramic tile; Partially carpeted
- Bathrooms: Two full bathrooms (one on first upper level, one on second upper level); One half bathroom (on first upper level)
- Heating & cooling: Baseboard electric heat; Ceiling fans; Window air conditioning units; Heating fuel: natural gas and electric; Cooling fuel: natural gas
- Interior features: Partially finished basement (about 80% finished); Assessor-provided living area information; Other interior features
- Laundry & utility: Electric dryer
Neighborhood map
What this means for you Summary
Snapshot
- This is a 6-bed/2.5-bath townhouse listed at $300k. Condition is rated fair.
Deal economics
- At list price, monthly cash flow is $400 ($5k/yr) — positive.
- The deal already cash-flows at list — no discount required.
- Meets the 1% rule at list price ($3k rent vs $300k).
- Recommended offer: $291k (3.0% below list) — sets the bar for market timing.
- Cap rate 7.9% vs local median 6.0% in Baltimore — top-decile yield for the area; either an underpriced asset or a hidden risk that comps aren't pricing in. Stress-test before assuming the spread holds.
Location & tenants
- Location reads 76/100 on livability (#90 in MD, #3,396 nationally) — a middle-class / working-renter tenant base. Strengths: amenities A+, commute A+, housing A+; Watch: schools D, crime F.
- Baltimore City Public Schools (urban): math 7% / reading 16% proficiency, ranked #24 of 24 in MD (top 100%) — low school quality limits family demand, transient renter base, plan for 1-2y turnover; 79% free/reduced lunch — lower-income household profile, screen leases tightly.
- Market conditions: Rents rising (+2.3%/yr); 131 active listings in the ZIP; 3 comparable units currently listed for rent nearby; rentals at typical pace (median 24d on market — plan ~3-4 weeks tenant-placement turnaround); solid renter incomes; 1,273 units permitted in Baltimore city in 2024 (1,104 in 5+ unit buildings).
- This rent runs 44% of the median local income ($85k/yr) — at the standard rent-burdened threshold; future hikes will face affordability resistance.
Forward outlook
- Local home prices are declining (-3.0%/yr); year-one equity from $2k of loan paydown is wiped out by about $9k of value loss. Plan a longer hold.
- Baltimore County population projected to shrink 4% by 2050 — rents likely to lag national; underwrite the cash flow, not the appreciation.
Negotiation context
- It's been on market 44 days — a 3% lower offer ($291k) is reasonable based on typical stale-listing flexibility.
- 2 sale attempts since 2y ago with the ask held roughly flat each time — persistent listings suggest the price (not the market) is what's stuck; bring a comps-based counter.
Risks & watch-outs
- Watch-outs: built in 1910 — expect roof / HVAC / electrical / plumbing capex.
- Climate carrying-cost: major wind risk, 27% chance of damaging wind over 30y; extreme-heat days projected 7→15/yr by 2055 (HVAC capex compounding) — expect insurance premiums to compound above CPI over the hold.
Questions for the listing agent
- It's been on market 44 days. Have you received any prior offers? Is the seller open to a 3% concession, seller financing, or rate buy-down credit?
- Have any recent inspections been done? Can we get a copy of the seller's disclosures and any deferred-maintenance estimates?
- Built in 1910 — when were the roof, HVAC, electrical panel, plumbing, and water heater last replaced?
- Is there a deadline driving the sale (1031 exchange, divorce, estate, relocation)? That informs how much negotiation room exists.
- Schools are D-rated, which usually means shorter tenancies and higher turnover. Who's the typical renter profile here, and what's been the actual vacancy rate?
- Crime grade is F in this area — have there been break-ins, vandalism, or insurance claims at this property in the last 3 years? What carrier currently insures it and at what premium?
- What's the average days-on-market for RENTAL listings here right now (not sales)? A rising rental-DOM trend means longer vacancies and softer asking-rent achievability than the comps imply.
- What's the recent tenant-quality profile in this submarket — average credit score on applications, eviction rate, late-payment / NSF rate, and stable-employment percentage? A property-management company in the area should have these aggregated.
- How much new for-sale + rental construction is in the pipeline within 1–3 miles? Heavy new supply typically softens prices + rents 12–24 months out; constrained supply supports both.
Investment metrics
- 1% rule
- 1.04% ✓
- Cap rate
- 7.89%
- Cash-on-cash
- 5.71%
- DSCR
- 1.25
- GRM
- 8.0
CMA / ARV
- ARV (median comp)
- $349,499
- List price
- $299,999
- Delta
- -14.16%
- Verdict
- UNDERPRICED
- Comps
- 20 within 1.0 mi
Show comp detail 6 sales within ~0.75 mi
| Address | Dist | Beds/Ba | Sqft | Sold | Price | $/sf | Match |
|---|---|---|---|---|---|---|---|
| 2038 Orleans St | 0.08mi | 5/1.5 (-1) | 2,226 (-7%) | 7mo | $90,000 | $40 | 70 |
| 8 S Collington Ave | 0.27mi | 5/3.5 (-1) | 2,500 (+4%) | 11mo | $750,000 | $300 | 62 |
| 2208 E Baltimore St | 0.23mi | 5/4.5 (-1) | 2,640 (+10%) | 4mo | $680,000 | $258 | 56 |
| 3039 E Baltimore St | 0.74mi | 5/3.0 (-1) | 2,544 (+6%) | 5mo | $480,000 | $189 | 44 |
| 135 S Linwood Ave | 0.67mi | 5/3.5 (-1) | 2,225 (-7%) | 10mo | $510,000 | $229 | 39 |
| 831 N Luzerne Ave | 0.48mi | 5/3.0 (-1) | 2,100 (-12%) | 18mo | $286,000 | $136 | 35 |
Match score weights: distance 35% · size 25% · config 20% · recency 20%. Top-matched comps best support the ARV.
Projected returns pro-forma
-3.0% appreciation · 2.26% rent growth · sell at horizon
- IRR
- -8.3%
- Equity multiple
- 0.70×
- Total profit
- $-25,429
- Equity at exit
- $44,731
- IRR
- 0.3%
- Equity multiple
- 1.02×
- Total profit
- $1,467
- Equity at exit
- $25,938
Cash invested: $84,000 (down + closing). Projections, not guarantees.
Landlord ↔ Tenant lean methodology
- Overall (CITY)
- 12 Strongly Tenant-Friendly
- State Maryland
- 27 Tenant-Leaning · D+14
- County
- — inherits STATE
- City Baltimore
- 12 Strongly Tenant-Friendly · D+58
ZIP-level market 21231
- Rents YoY
- 2.3%
- Active inventory
- 131
- Price-to-rent
- 8.0×
Monthly cashflow live
- Estimated rent
- $3,130 medium interval (Pro) →
- Mortgage (P&I)
- −$1,573
- Tax est. 1.5%
- −$375 /mo · $4,500/yr
- Insurance
- −$125
- HOA
- −$0
- Vacancy / Maint / Mgmt
- −$657
- Net cashflow
- $400
Break-even live
UW: 25.0% down · 7.5% · 30yr · 1.5% tax · 5.0% vac · 8.0% maint · 8.0% mgmt
Financing live
Cash to close
- Down payment
- $75,000
- Closing costs
- $9,000
- Reserves months
- —
- Total cash needed
- —
Loan-product check · same deal, 3 products live
Conventional
25% down · 7.5% · 30yr
- Down + closing
- —
- Monthly P&I
- —
- Monthly cashflow
- —
- DSCR
- —
- Eligible?
- —
Personal DTI + credit; lowest rate.
DSCR
20% down · 8.5% · 30yr
- Down + closing
- —
- Monthly P&I
- —
- Monthly cashflow
- —
- DSCR
- —
- Eligible?
- —
No personal income docs; deal must DSCR.
Hard money
10% down · 12.0% · 12mo
- Down + closing
- —
- Monthly P&I
- —
- Monthly cashflow
- —
- DSCR
- —
- Eligible?
- —
Short-term bridge; refi at stabilization.
Rent comps 3 comps
| Address | Beds | Baths | Sqft | Rent | $/sqft | DOM | Units | Dist |
|---|---|---|---|---|---|---|---|---|
| 2245 E Fayette St Unit 2ND FLOOR Baltimore, MD | 5.0 | 2.0 | 3008 | $2,650 | $0.88 | 24d | 1 | 0.12mi |
| 228 N Kenwood Ave Baltimore, MD | 5.0 | 2.0 | 1901 | $2,200 | $1.16 | 4d | 1 | 0.48mi |
| 919 Stiles St Baltimore, MD | 5.0 | 5.5 | 3100 | $6,250 | $2.02 | 24d | 1 | 0.95mi |
Listing history 16 events
-
2026-06-18days on market $299,999 Active 44 DOM
-
2026-06-17days on market $299,999 Active 43 DOM
-
2026-06-16days on market $299,999 Active 42 DOM
-
2026-06-15days on market $299,999 Active 41 DOM
-
2026-06-13days on market $299,999 Active 39 DOM
-
2026-06-09days on market $299,999 Active 35 DOM
-
2026-06-08days on market $299,999 Active 34 DOM
-
2026-06-07days on market $299,999 Active 33 DOM
-
2026-06-04days on market $299,999 Active 30 DOM
-
2026-06-03days on market $299,999 Active 29 DOM
-
2026-06-02days on market $299,999 Active 28 DOM
-
2026-06-01days on market $299,999 Active 27 DOM
-
2026-05-31days on market $299,999 Active 26 DOM
-
2026-05-05$299,999 Active 2123-char remark
-
2025-04-15historical
-
2024-12-17$425,000 Active
ⓘ Source: listings_history table (triggers on properties + properties_extension) + one-shot
backfill from property_details.listing_events for pre-trigger history.
Climate risk First Street
- Flood 1/10 Low FEMA zone X (unshaded) · 0% chance over 30 yrs
- Wildfire 1/10 Low
- Heat 7/10 Severe 7 d/yr ≥103°F today · 15 d/yr by 30 yrs out
- Wind 6/10 Major 27% chance of damaging wind over 30 yrs
- Air quality 4/10 Moderate 6 unhealthy d/yr today · 7 by 30 yrs out
Nearby sold comps map
Loading sold comps map…
Walkable amenities ~0.75 mi
Loading nearby amenities…
Taxation est. · year 1
- Rental income
- $37,562
- − Mortgage interest
- −$16,805
- − Property taxes
- −$4,500
- − Insurance
- −$1,500
- − Repairs & maintenance
- −$3,005
- − Management
- −$3,005
- − Depreciation
- −$8,727
- Taxable income
- $20
- Est. tax owed @ 24.0%
- −$5
- After-tax cash flow
- $4,790/yr
For passive investors: Depreciation is non-cash, so a rental often shows a tax loss while cash-flowing — sheltering income. Rental losses are passive: they offset passive income freely, and up to $25,000/yr can offset ordinary (W-2) income if you actively participate and your MAGI is under $100k (phasing out to $0 by $150k); unused losses carry forward. On sale, claimed depreciation is recaptured at up to 25%, and gains may owe capital-gains tax (a 1031 exchange can defer both). Figures are a year-1 estimate at your 24.0% rate — not tax advice; consult a CPA.
Condition & rehab AI · 13 photos
This property requires moderate rehabilitation, focusing on exterior repairs and interior updates to significantly improve its condition and marketability.
Repairs flagged
- Major Exterior siding — The siding is visibly weathered and peeling, indicating significant damage.
- Major Roof — Signs of wear and potential leaks are visible, indicating the need for repair or replacement.
- Minor Interior walls and paint — Some discoloration and peeling are visible, but not extensive enough to require immediate attention.
- Minor Bathrooms — Some wear and tear is visible on the fixtures and tiles, but not severe enough to require immediate attention.
- Minor Kitchen — Some wear and tear is visible on the cabinets and countertops, but not severe enough to require immediate attention.
Value-add opportunities
- Resale Paint exterior walls and replace siding — Refreshing the exterior appearance will significantly improve the home's curb appeal and marketability.
- Resale Replace roof — A new roof will address potential leaks and improve the home's overall condition, enhancing its marketability.
- Both Paint interior walls and update bathrooms — Updating the interior appearance will improve the home's overall condition and appeal to both buyers and renters.
Renovation cost estimate screening
| Repair item | Severity | Est. cost |
|---|---|---|
| Exterior siding · The siding is visibly weathered and peeling, indicating significant damage. | Major | $15,000–50,000 |
| Roof · Signs of wear and potential leaks are visible, indicating the need for repair or replacement. | Major | $15,000–50,000 |
| Interior walls and paint · Some discoloration and peeling are visible, but not extensive enough to require immediate attention. | Minor | $500–3,000 |
| Bathrooms · Some wear and tear is visible on the fixtures and tiles, but not severe enough to require immediate attention. | Minor | $500–3,000 |
| Kitchen · Some wear and tear is visible on the cabinets and countertops, but not severe enough to require immediate attention. | Minor | $500–3,000 |
| Total estimated repair cost · 5 items | $31,500–109,000 |
Value-add ROI direction
- Resale Paint exterior walls and replace siding — Refreshing the exterior appearance will significantly improve the home's curb appeal and marketability. ↑
- Resale Replace roof — A new roof will address potential leaks and improve the home's overall condition, enhancing its marketability. ↑
- Both Paint interior walls and update bathrooms — Updating the interior appearance will improve the home's overall condition and appeal to both buyers and renters. ↑
ⓘ Cost ranges are severity-bucket heuristics (US national rule-of-thumb). Get contractor quotes + a written scope before underwriting a rehab budget.
Schools (NCES district)
- District
- Baltimore City Public Schools
- NCES district ID
- 2400090
- Math proficiency
- 7% ▼ -9.00%
- Reading proficiency
- 16% ▼ -5.00%
- Median HH income
- $42,108
- Composite
- 10.08/100
- National rank
- #9805
- State rank
- #24 of 24 in MD
Livability — Baltimore
- Score
- 76/100
- State rank
- #90
- US rank
- #3396
Category grades
Schools grade is shown separately in the Schools card above.
Census & demographics
- Census place
- Baltimore, MD
- County
- Baltimore City · 558,601 people
- City population
- 588,727
- Metro
- Baltimore-Columbia-Towson, MD
- Population (ZIP)
- 14,969
- Household income
- $85,254
- Rent vs Own
- Severe rent burden
- 1147.0
Population outlook (Baltimore County) Hauer SSP2
- Today (2025)
- 624,249 people
- By 2030
- 621,541 · -0.4%
- By 2040
- 609,756 · -2.3%
- By 2050
- 597,249 · -4.3%
- By 2075
- 552,236 · -11.5%
- By 2100
- 513,934 · -17.7%
Race, ethnicity, and origin ACS 2023
- Neighborhood character
- Diverse neighborhood (Simpson 0.62)
- Race & ethnicity
- White 53% Black 29% Hispanic / Latino 9% Two or more races 7% Asian 4%
- Hispanic origin (detail)
- Mexican 3% Puerto Rican 1%
- Common ancestry
- Romanian 6% Slovak 2% Lithuanian 2%
- Foreign-born
- 10% · Canada, China, South Korea
- Languages at home
- 85% English-only · Spanish 6% Other Indo-European 2% Russian/Polish/Slavic 1%
Political lean MEDSL · Baltimore
- 2024 margin
- Solid D (+73.0) · D 85.2% · R 12.2% · Other 2.6%
- 2008→2024 swing
- -2.5pp toward R · 2008: 75.5pp · 2024: 73.0pp
- All cycles
- 2024: D+73.0 2020: D+76.6 2016: D+74.6 2012: D+76.4 2008: D+75.5
Not yet ingested
- Civics
- —
Market trends
- HPI YoY
- ▼ -545.26%
- Current HPI
- 351.3778
- Rent YoY
- ▲ 2.26%
- Metro
- Baltimore-Columbia-Towson, MD
- State GDP YoY
- ▲ 2.97%
- F500 in state
- 12
Industry mix (Fortune 500 HQ in MD)
| Industry | F500 HQs | Revenue |
|---|---|---|
| Aerospace / Defense | 1 | $71B |
|
||
| Utilities | 1 | $25B |
|
||
| Hotels | 1 | $24B |
|
||
| Consumer Goods | 1 | $7B |
|
||
| Real Estate | 1 | $6B |
|
||
| Chemicals | 1 | $2B |
|
||
Price history
-29.4% since first listed3 events — show timeline
- 2026-05-05 Listed $299,999 BRIGHT MLS
- 2025-04-15 Listing Removed — BRIGHT MLS
- 2024-12-17 Listed $425,000 BRIGHT MLS
Cash-flow waterfall
monthlySold comps — $/sqft
last 12 mo · ≤1 miLoading sold comps…