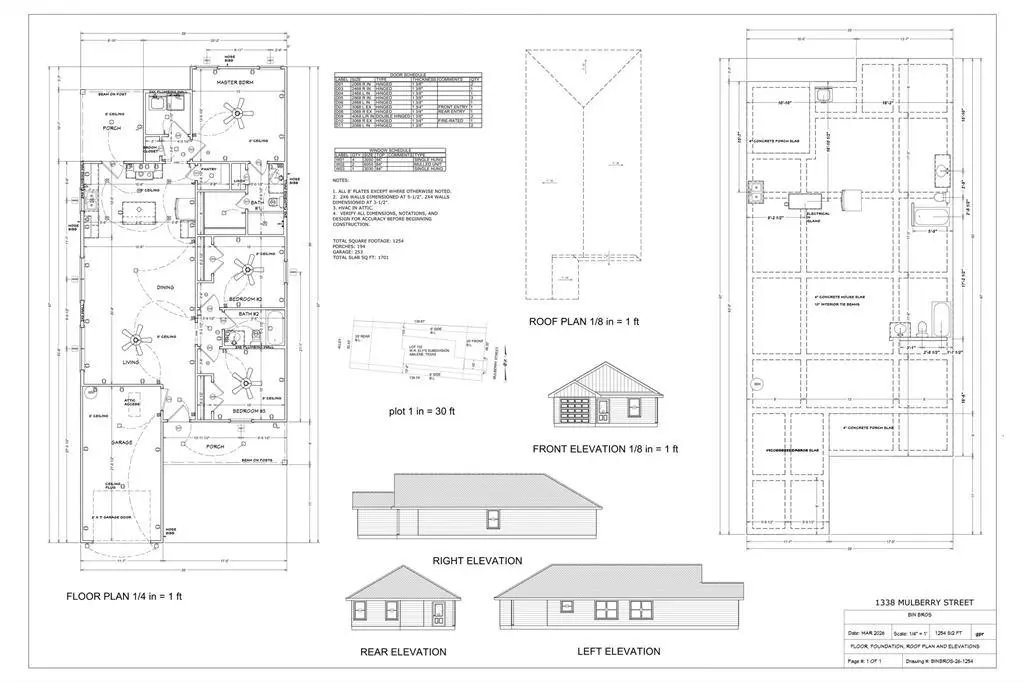
1338 Mulberry St · Abilene, TX
Flood risk 1/10 · Minimal
- FEMA flood zone
- X (unshaded)
- Chance of flooding over 30 yrs
- 0.0%
- Est. flood insurance / yr
- $507 – $1,088
Fire risk 2/10 · Minimal
- Est. fire insurance / yr
- $1,222 – $2,270
Heat risk 7/10 · Major
- Hot days now (above 104°F)
- 7 days/yr
- Hot days in 30 yrs
- 24 days/yr
Wind risk 4/10 · Minor
- Chance of severe wind over 30 yrs
- 11.0%
Air-quality risk 1/10 · Minimal
- Unhealthy air days now
- 0 days/yr
- Unhealthy air days in 30 yrs
- 0 days/yr
Risk factors via First Street. Map © Google.
Why this score? — see what drove the C grade
The composite is a weighted blend of 9 inputs, each scored 0–100. Each bar is that input's sub-score; the figure is the points it added to the 100-point composite (weight × sub-score).
- Cash flow +26.3/30.0
- DSCR +8.9/10.0
- 1% rule +7.0/10.0
- Rent growth +5.0/5.0
- Condition / age +4.0/5.0
- Livability +3.8/5.0
- Schools +2.8/10.0
- ARV discount +0.0/15.0
- Appreciation +0.0/10.0
$203,000
🖨 Deal sheet 📄 Offer letter ✓ Due diligence
Listing remarks
Brand-new construction offering 3 bedrooms and 2 full baths with thoughtful finishes throughout. This all electric home features luxury vinyl plank flooring and ceiling fans in every room, paired with granite countertops and stylish tile showers for a clean, modern look. The open and functional layout is ideal for everyday living, while newly installed sod in both the front and back yards provides instant curb appeal and outdoor enjoyment. Conveniently located near shopping, medical facilities, and schools, this move in ready home blends new build comfort with everyday convenience.
Key facts
- Garage
- Built 2026
- Listed 3 days
Property features AI
Finance
- Other: Builder special listing condition; Listing terms include Cash, Conventional, FHA, VA
- Financial info: Treat as clear loan type; No second mortgage
- HOA & community: No association
Exterior
- Parking: Driveway; Garage that faces front; Attached 1-car garage; 1 covered parking space
- Utilities: City water; City sewer; Electricity available; Cable available; Asphalt streets; Curbs
- Home design: Single family residence; Residential property; One story; New construction (incomplete, 2026)
- Construction: Siding exterior; Composition roof; Slab foundation
- Exterior features: Covered porch; Covered patios/porches
Interior
- Kitchen: Dishwasher; Disposal; Electric range
- Bedrooms: Primary bedroom on level 1 with ensuite bath and walk-in closet; Total of 3 bedrooms
- Flooring: Luxury vinyl plank
- Bathrooms: 2 full bathrooms
- Heating & cooling: Electric heating; Ceiling fans and electric cooling
- Interior features: Cable TV available; High-speed internet available; One living area; One dining area; One level
- Laundry & utility: Utility room with full-size washer/dryer area
Neighborhood map
What this means for you Summary
Snapshot
- This is a 3-bed/2.0-bath single-family listed at $203k. Condition is rated good.
Deal economics
- At list price, monthly cash flow is $524 ($6k/yr) — positive.
- The deal already cash-flows at list — no discount required.
- Meets the 1% rule at list price ($2k rent vs $203k).
- Cap rate 9.4% vs local median 6.7% in Abilene — top-decile yield for the area; either an underpriced asset or a hidden risk that comps aren't pricing in. Stress-test before assuming the spread holds.
Location & tenants
- Location reads 75/100 on livability (#142 in TX, #4,037 nationally) — a middle-class / working-renter tenant base. Strengths: cost of living A+, housing A+, health & safety A+; Watch: crime D, commute F.
- Abilene ISD (urban): math 32% / reading 34% proficiency, ranked #575 of 826 in TX (top 70%) — families likely to look elsewhere, expect single-tenant / working-renter base with shorter leases.
- Zoned schools: Martinez El (math 30% / reading 23%, grade F, #2,927 of 4,322 statewide, top 68%, 412 students, 94% FRL) — zoned schools average 94% FRL vs 57% district-wide (37 pts higher); higher-poverty schools than district average — tighter screening recommended.
- Market conditions: Rents rising fast (+43.4%/yr); 195 active listings in the ZIP; 8 comparable units currently listed for rent nearby; rentals leasing fast (median 13d on market — plan ~1-2 weeks tenant-placement turnaround); 508 units permitted in Taylor County in 2024 (0 in 5+ unit buildings).
- At $2,439/mo this rent would consume 55% of the median local household income ($54k/yr) (locally 1240% of renters already pay >50% of income on rent) — very limited rent-growth headroom before tenants either downsize or default.
Forward outlook
- Local home prices are declining (-3.0%/yr); year-one equity from $1k of loan paydown is wiped out by about $6k of value loss. Plan a longer hold.
- Taylor County population projected at +16% by 2050 — long-run rental-demand tailwind backs the buy-and-hold thesis.
- At projected returns (-3.0% appreciation + 8.0% rent growth), your $57k cash investment doubles in ~7 years — after that, you're playing with house money.
Negotiation context
- Only 3 days on market — expect competitive offers; lowballing is unlikely to land.
Risks & watch-outs
- Climate carrying-cost: extreme-heat days projected 7→24/yr by 2055 (HVAC capex compounding) — expect insurance premiums to compound above CPI over the hold.
Questions for the listing agent
- Is there a deadline driving the sale (1031 exchange, divorce, estate, relocation)? That informs how much negotiation room exists.
- Schools are D-rated, which usually means shorter tenancies and higher turnover. Who's the typical renter profile here, and what's been the actual vacancy rate?
- Crime grade is D in this area — have there been break-ins, vandalism, or insurance claims at this property in the last 3 years? What carrier currently insures it and at what premium?
- What's the average days-on-market for RENTAL listings here right now (not sales)? A rising rental-DOM trend means longer vacancies and softer asking-rent achievability than the comps imply.
- What's the recent tenant-quality profile in this submarket — average credit score on applications, eviction rate, late-payment / NSF rate, and stable-employment percentage? A property-management company in the area should have these aggregated.
- How much new for-sale + rental construction is in the pipeline within 1–3 miles? Heavy new supply typically softens prices + rents 12–24 months out; constrained supply supports both.
Investment metrics
- 1% rule
- 1.20% ✓
- Cap rate
- 9.39%
- Cash-on-cash
- 11.07%
- DSCR
- 1.49
- GRM
- 6.9
CMA / ARV
- ARV (on-the-fly)
- $159,258
- Comps found
- 12
Show comp detail 12 sales within ~0.75 mi
| Address | Dist | Beds/Ba | Sqft | Sold | Price | $/sf | Match |
|---|---|---|---|---|---|---|---|
| 1042 Beech St | 0.22mi | 3/2.0 | 1,256 (+0%) | 2mo | $199,900 | $159 | 88 |
| 901 Mulberry St | 0.35mi | 3/2.0 | 1,204 (-4%) | 0mo | $149,900 | $125 | 76 |
| 1201 Victoria St | 0.38mi | 3/1.0 | 1,248 (-0%) | 4mo | $159,000 | $127 | 74 |
| 1918 Clinton St | 0.51mi | 3/2.0 | 1,254 (0%) | 4mo | $203,000 | $162 | 73 |
| 889 Beech St | 0.38mi | 3/2.0 | 1,310 (+4%) | 6mo | $124,900 | $95 | 70 |
| 825 Victoria St | 0.56mi | 3/1.0 | 1,326 (+6%) | 1mo | $40,000 | $30 | 59 |
| 1702 Sandefer St | 0.74mi | 2/1.0 (-1) | 1,268 (+1%) | 5mo | $89,900 | $71 | 51 |
| 2241 State St | 0.71mi | 2/2.0 (-1) | 1,162 (-7%) | 2mo | $64,900 | $56 | 48 |
| 1617 Park Ave | 0.70mi | 4/2.0 (+1) | 1,380 (+10%) | 0mo | $189,900 | $138 | 45 |
| 1350 Lillius St | 0.46mi | 2/1.0 (-1) | 1,076 (-14%) | 1mo | $150,000 | $139 | 45 |
| 2116 Parramore St | 0.74mi | 3/1.0 | 1,384 (+10%) | 1mo | $145,000 | $105 | 43 |
| 2033 Graham St | 0.67mi | 3/2.0 | 1,090 (-13%) | 6mo | $155,900 | $143 | 42 |
Match score weights: distance 35% · size 25% · config 20% · recency 20%. Top-matched comps best support the ARV.
Projected returns pro-forma
-3.0% appreciation · 8.0% rent growth · sell at horizon
- IRR
- 5.8%
- Equity multiple
- 1.24×
- Total profit
- $13,427
- Equity at exit
- $30,268
- IRR
- 19.3%
- Equity multiple
- 3.00×
- Total profit
- $113,518
- Equity at exit
- $17,552
Cash invested: $56,840 (down + closing). Projections, not guarantees.
Landlord ↔ Tenant lean methodology
- Overall (STATE)
- 87 Strongly Landlord-Friendly
- State Texas
- 87 Strongly Landlord-Friendly · R+5
- County
- — inherits STATE
- City
- — inherits STATE
ZIP-level market 79601
- Home prices YoY
- -22.8%
- Rents YoY
- 43.4%
- Active inventory
- 195
- Price-to-rent
- 6.9×
Monthly cashflow live
- Estimated rent
- $2,439 high interval (Pro) →
- Mortgage (P&I)
- −$1,065
- Tax est. 1.5%
- −$254 /mo · $3,045/yr
- Insurance
- −$85
- HOA
- −$0
- Vacancy / Maint / Mgmt
- −$512
- Net cashflow
- $524
Break-even live
UW: 25.0% down · 7.5% · 30yr · 1.5% tax · 5.0% vac · 8.0% maint · 8.0% mgmt
Financing live
Cash to close
- Down payment
- $50,750
- Closing costs
- $6,090
- Reserves months
- —
- Total cash needed
- —
Loan-product check · same deal, 3 products live
Conventional
25% down · 7.5% · 30yr
- Down + closing
- —
- Monthly P&I
- —
- Monthly cashflow
- —
- DSCR
- —
- Eligible?
- —
Personal DTI + credit; lowest rate.
DSCR
20% down · 8.5% · 30yr
- Down + closing
- —
- Monthly P&I
- —
- Monthly cashflow
- —
- DSCR
- —
- Eligible?
- —
No personal income docs; deal must DSCR.
Hard money
10% down · 12.0% · 12mo
- Down + closing
- —
- Monthly P&I
- —
- Monthly cashflow
- —
- DSCR
- —
- Eligible?
- —
Short-term bridge; refi at stabilization.
Rent comps 8 comps
| Address | Beds | Baths | Sqft | Rent | $/sqft | DOM | Units | Dist |
|---|---|---|---|---|---|---|---|---|
| 1638 Merchant St Abilene, TX | 3.0 | 2.0 | 1328 | $2,895 | $2.18 | 13d | 1 | 0.33mi |
| 1209 Kirkwood St Abilene, TX | 3.0 | 2.0 | 1674 | $2,500 | $1.49 | 21d | 1 | 0.58mi |
| 1426 Plum St Abilene, TX | 3.0 | 2.0 | 1090 | $2,014 | $1.85 | 13d | 1 | 0.65mi |
| 702 N 13th St Abilene, TX | 3.0 | 2.0 | 1334 | $2,200 | $1.65 | 13d | 1 | 0.65mi |
| 1481 Burger St Abilene, TX | 3.0 | 2.0 | 1330 | $2,400 | $1.80 | 21d | 1 | 0.96mi |
| 2841 Old Anson Rd Abilene, TX | 2.0 | 1.0 | 932 | $2,000 | $2.15 | 13d | 1 | 1.47mi |
| 1685 N Willis St Abilene, TX | 3.0 | 2.0 | 1349 | $1,800 | $1.33 | 21d | 1 | 1.48mi |
| 619 Poplar St Abilene, TX | 2.0 | 1.0 | 884 | $1,695 | $1.92 | 13d | 1 | 1.50mi |
Listing history 3 events
-
2026-05-08status Pending
-
2026-05-05historical Active Option Contract
-
2026-05-05$203,000 Active
ⓘ Source: listings_history table (triggers on properties + properties_extension) + one-shot
backfill from property_details.listing_events for pre-trigger history.
Climate risk First Street
- Flood 1/10 Low FEMA zone X (unshaded) · 0% chance over 30 yrs
- Wildfire 2/10 Low
- Heat 7/10 Severe 7 d/yr ≥104°F today · 24 d/yr by 30 yrs out
- Wind 4/10 Moderate 11% chance of damaging wind over 30 yrs
- Air quality 1/10 Low 0 unhealthy d/yr today · 0 by 30 yrs out
Nearby sold comps map
Loading sold comps map…
Walkable amenities ~0.75 mi
Loading nearby amenities…
Taxation est. · year 1
- Rental income
- $29,274
- − Mortgage interest
- −$11,371
- − Property taxes
- −$3,045
- − Insurance
- −$1,015
- − Repairs & maintenance
- −$2,342
- − Management
- −$2,342
- − Depreciation
- −$5,905
- Taxable income
- $3,253
- Est. tax owed @ 24.0%
- −$781
- After-tax cash flow
- $5,511/yr
For passive investors: Depreciation is non-cash, so a rental often shows a tax loss while cash-flowing — sheltering income. Rental losses are passive: they offset passive income freely, and up to $25,000/yr can offset ordinary (W-2) income if you actively participate and your MAGI is under $100k (phasing out to $0 by $150k); unused losses carry forward. On sale, claimed depreciation is recaptured at up to 25%, and gains may owe capital-gains tax (a 1031 exchange can defer both). Figures are a year-1 estimate at your 24.0% rate — not tax advice; consult a CPA.
Condition & rehab AI · 1 photo
This move-in ready home offers a good condition with new construction features and thoughtful finishes, making it an attractive option for both resale and rental.
Value-add opportunities
- Both Paint interior walls — Fresh paint can enhance curb appeal and interior aesthetics
- Both Install smart home devices — Smart home devices can increase convenience and appeal to potential buyers/renters
- Both Add outdoor lighting — Outdoor lighting can improve safety and curb appeal
Renovation cost estimate screening
Value-add ROI direction
- Both Paint interior walls — Fresh paint can enhance curb appeal and interior aesthetics ↑
- Both Install smart home devices — Smart home devices can increase convenience and appeal to potential buyers/renters ↑
- Both Add outdoor lighting — Outdoor lighting can improve safety and curb appeal ↑
ⓘ Cost ranges are severity-bucket heuristics (US national rule-of-thumb). Get contractor quotes + a written scope before underwriting a rehab budget.
Schools (NCES district)
- District
- Abilene ISD
- NCES district ID
- 4807440
- Math proficiency
- 32% ▼ -11.00%
- Reading proficiency
- 34% ▼ -5.00%
- Median HH income
- $39,782
- Composite
- 27.71/100
- National rank
- #6909
- State rank
- #575 of 826 in TX
Livability — Abilene
- Score
- 75/100
- State rank
- #142
- US rank
- #4037
Category grades
Schools grade is shown separately in the Schools card above.
Census & demographics
- Census place
- Abilene, TX
- County
- Taylor County · 136,672 people
- City population
- 136,672
- Metro
- Abilene, TX
- Population (ZIP)
- 28,050
- Household income
- $53,631
- Rent vs Own
- Severe rent burden
- 1240.0
Population outlook (Taylor County) Hauer SSP2
- Today (2025)
- 145,270 people
- By 2030
- 150,050 · +3.3%
- By 2040
- 159,417 · +9.7%
- By 2050
- 168,883 · +16.3%
- By 2075
- 194,436 · +33.8%
- By 2100
- 203,163 · +39.9%
Race, ethnicity, and origin ACS 2023
- Neighborhood character
- Diverse neighborhood (Simpson 0.61)
- Race & ethnicity
- White 55% Hispanic / Latino 25% Black 13% Two or more races 13% Asian 3%
- Hispanic origin (detail)
- Mexican 21%
- Common ancestry
- Italian 2% Lithuanian 2% Serbian 1%
- Foreign-born
- 7% · Canada, Vietnam
- Languages at home
- 81% English-only · Spanish 15% French/Haitian/Cajun 1% Vietnamese 1%
Political lean MEDSL · Taylor
- 2024 margin
- Solid R (+49.8) · D 24.6% · R 74.4% · Other 1.0%
- 2008→2024 swing
- -4.2pp toward R · 2008: -45.6pp · 2024: -49.8pp
- All cycles
- 2024: R+49.8 2020: R+45.3 2016: R+51.1 2012: R+53.6 2008: R+45.6
Not yet ingested
- Civics
- —
Market trends
- HPI YoY
- ▼ -63.17%
- Current HPI
- 214.4372
- Rent YoY
- ▲ 43.38%
- Metro
- Abilene, TX
- State GDP YoY
- ▲ 3.95%
- F500 in state
- 110
Industry mix (Fortune 500 HQ in TX)
| Industry | F500 HQs | Revenue |
|---|---|---|
| Energy | 16 | $1,198B |
|
||
| Technology | 5 | $198B |
|
||
| Engineering / Construction | 4 | $72B |
|
||
| Energy Services | 3 | $60B |
|
||
| Utilities | 3 | $41B |
|
||
| Healthcare | 2 | $330B |
|
||
Price history
3 events — show timeline
- 2026-05-08 Pending — NTREIS
- 2026-05-05 Contingent — NTREIS
- 2026-05-05 Listed $203,000 NTREIS
Cash-flow waterfall
monthlySold comps — $/sqft
last 12 mo · ≤1 miLoading sold comps…