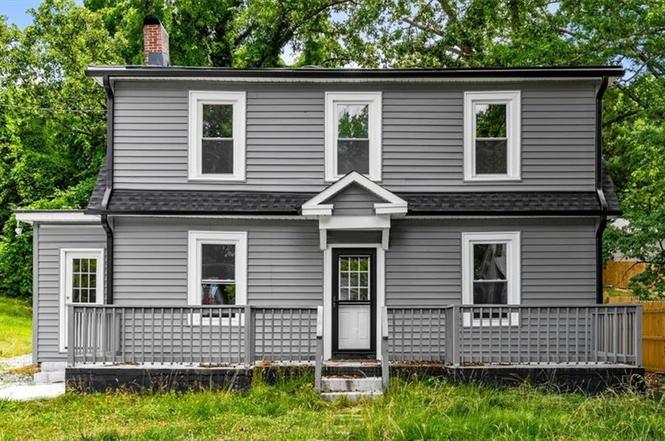
1434 N Hamilton St · High Point, NC
Flood risk 6/10 · Moderate
- FEMA flood zone
- X (unshaded)
- Chance of flooding over 30 yrs
- 0.74%
- Est. flood insurance / yr
- $507 – $1,088
Fire risk 1/10 · Minimal
- Est. fire insurance / yr
- $906 – $1,684
Heat risk 5/10 · Moderate
- Hot days now (above 104°F)
- 7 days/yr
- Hot days in 30 yrs
- 16 days/yr
Wind risk 4/10 · Minor
- Chance of severe wind over 30 yrs
- 14.0%
Air-quality risk 2/10 · Minimal
- Unhealthy air days now
- 1 days/yr
- Unhealthy air days in 30 yrs
- 1 days/yr
Risk factors via First Street. Map © Google.
Why this score? — see what drove the B- grade
The composite is a weighted blend of 9 inputs, each scored 0–100. Each bar is that input's sub-score; the figure is the points it added to the 100-point composite (weight × sub-score).
- Cash flow +24.5/30.0
- ARV discount +15.0/15.0
- DSCR +7.9/10.0
- 1% rule +5.4/10.0
- Livability +3.9/5.0
- Schools +3.6/10.0
- Rent growth +2.7/5.0
- Condition / age +2.5/5.0
- Appreciation +0.0/10.0
$189,000
🖨 Deal sheet 📄 Offer letter ✓ Due diligence
Listing remarks
Enjoy modern updates and classic charm in this beautifully refreshed 4-bedroom, 2-bath home. The main-level primary suite features a private en-suite bath, while fresh paint and new LVP flooring create a bright, updated feel throughout. Spacious living areas include ceiling fans, built-in shelving, and plenty of natural light. The kitchen offers a pantry, dishwasher, slide-in range/oven, exhaust fan, and ample cabinet space. Laundry room conveniently located on the main level. Upstairs provides additional bedrooms and flexible living space. Enjoy the convenience of an oversized 1-car attached garage. Recent updates include newer HVAC and roof. Move-in ready and conveniently located near sho
Key facts
- Newer roof
- Ample cabinet space
- Built-in shelving
Tags
Property features AI
Finance
- Other: Subdivision: Clark - Lambeth; Directions available to property
- HOA & community: No homeowners association; Association listed as Greensboro (no active association)
Exterior
- Parking: Attached garage (1 car)
- Utilities: Public sewer; Electric water heater; Electric service
- Home design: Residential stick/site-built house; Two levels; Built in 1928; Existing structure
- Construction: Vinyl siding exterior; Crawl space foundation
- Exterior features: Public water; No pool; Publicly maintained road; Lot approximately 0.17 acres
Interior
- Kitchen: Dishwasher; Free-standing electric range; Exhaust fan
- Bedrooms: Multiple upstairs bedrooms (second level rooms present); Primary suite on main level
- Flooring: Carpet; Vinyl
- Bathrooms: Two full bathrooms
- Heating & cooling: Heat pump (electric); Central air conditioning
- Interior features: Primary bedroom located on the main level; Built-in features; Pantry
- Laundry & utility: Main level laundry with dryer connection; Electric water heater
Neighborhood map
What this means for you Summary
Snapshot
- This is a 4-bed/2.0-bath single-family listed at $189k.
Deal economics
- At list price, monthly cash flow is $389 ($5k/yr) — positive.
- The deal already cash-flows at list — no discount required.
- Meets the 1% rule at list price ($2k rent vs $189k).
- Cap rate 8.8% vs local median 4.0% in High Point — top-decile yield for the area; either an underpriced asset or a hidden risk that comps aren't pricing in. Stress-test before assuming the spread holds.
Location & tenants
- Location reads 77/100 on livability (#31 in NC, #3,084 nationally) — a middle-class / working-renter tenant base. Strengths: commute A+, cost of living A+, housing A+; Watch: schools D+, amenities D, employment D.
- Guilford County Schools (urban): math 39% / reading 45% proficiency, ranked #99 of 178 in NC (top 56%) — families likely to look elsewhere, expect single-tenant / working-renter base with shorter leases.
- Market conditions: Rents flat; 120 active listings in the ZIP; 8 comparable units currently listed for rent nearby; rentals at typical pace (median 23d on market — plan ~3-4 weeks tenant-placement turnaround); 3,843 units permitted in Guilford County in 2024 (2,397 in 5+ unit buildings).
- This rent runs 36% of the median local income ($65k/yr) — at the standard rent-burdened threshold; future hikes will face affordability resistance.
Forward outlook
- Local home prices are declining (-3.0%/yr); year-one equity from $1k of loan paydown is wiped out by about $6k of value loss. Plan a longer hold.
- Guilford County population projected at +26% by 2050 — long-run rental-demand tailwind backs the buy-and-hold thesis.
Negotiation context
- Only 1 days on market — expect competitive offers; lowballing is unlikely to land.
- 2 sale attempts with the ask held roughly flat each time — persistent listings suggest the price (not the market) is what's stuck; bring a comps-based counter.
- Current owner paid $144k; 31% above their basis — modest negotiation headroom, anchor on the comps not their cost.
Risks & watch-outs
- Watch-outs: built in 1928 — expect roof / HVAC / electrical / plumbing capex.
- Climate carrying-cost: major flood risk; extreme-heat days projected 7→16/yr by 2055 (HVAC capex compounding) — expect insurance premiums to compound above CPI over the hold.
Questions for the listing agent
- Built in 1928 — when were the roof, HVAC, electrical panel, plumbing, and water heater last replaced?
- Is there a deadline driving the sale (1031 exchange, divorce, estate, relocation)? That informs how much negotiation room exists.
- Schools are D-rated, which usually means shorter tenancies and higher turnover. Who's the typical renter profile here, and what's been the actual vacancy rate?
- Crime grade is F in this area — have there been break-ins, vandalism, or insurance claims at this property in the last 3 years? What carrier currently insures it and at what premium?
- What's the average days-on-market for RENTAL listings here right now (not sales)? A rising rental-DOM trend means longer vacancies and softer asking-rent achievability than the comps imply.
- What's the recent tenant-quality profile in this submarket — average credit score on applications, eviction rate, late-payment / NSF rate, and stable-employment percentage? A property-management company in the area should have these aggregated.
- How much new for-sale + rental construction is in the pipeline within 1–3 miles? Heavy new supply typically softens prices + rents 12–24 months out; constrained supply supports both.
Investment metrics
- 1% rule
- 1.04% ✓
- Cap rate
- 8.76%
- Cash-on-cash
- 8.82%
- DSCR
- 1.39
- GRM
- 8.1
CMA / ARV
- ARV (on-the-fly)
- $262,080
- Comps found
- 12
Show comp detail 12 sales within ~0.75 mi
| Address | Dist | Beds/Ba | Sqft | Sold | Price | $/sf | Match |
|---|---|---|---|---|---|---|---|
| 1831 Blain St | 0.34mi | 3/2.0 (-1) | 1,678 (-0%) | 14mo | $155,000 | $92 | 67 |
| 511 Farriss Ave | 0.38mi | 3/2.0 (-1) | 1,560 (-7%) | 3mo | $322,500 | $207 | 63 |
| 1423 Hamilton St | 0.05mi | 3/2.0 (-1) | 1,448 (-14%) | 15mo | $137,000 | $95 | 57 |
| 416 W Lexington Ave | 0.66mi | 3/2.0 (-1) | 1,758 (+5%) | 5mo | $303,000 | $172 | 52 |
| 301 Rockspring Rd | 0.44mi | 3/2.5 (-1) | 1,823 (+8%) | 10mo | $250,000 | $137 | 49 |
| 531 Farriss Ave | 0.48mi | 4/2.0 | 1,486 (-12%) | 13mo | $275,000 | $185 | 47 |
| 1404 Forrest St | 0.70mi | 3/2.0 (-1) | 1,637 (-3%) | 14mo | $218,000 | $133 | 46 |
| 105 Idol St | 0.48mi | 5/2.0 (+1) | 1,848 (+10%) | 12mo | $225,000 | $122 | 46 |
| 512 Guilford Ave | 0.35mi | 3/2.5 (-1) | 1,449 (-14%) | 10mo | $255,000 | $176 | 46 |
| 510 Rockspring Rd | 0.70mi | 3/1.5 (-1) | 1,616 (-4%) | 14mo | $252,500 | $156 | 42 |
| 828 E Lexington Ave | 0.54mi | 3/2.0 (-1) | 1,928 (+15%) | 14mo | $109,000 | $57 | 34 |
| 407 Colonial Dr | 0.73mi | 3/1.0 (-1) | 1,436 (-14%) | 13mo | $316,500 | $220 | 22 |
Match score weights: distance 35% · size 25% · config 20% · recency 20%. Top-matched comps best support the ARV.
Projected returns pro-forma
-3.0% appreciation · 0.9% rent growth · sell at horizon
- IRR
- -5.2%
- Equity multiple
- 0.81×
- Total profit
- $-9,960
- Equity at exit
- $28,181
- IRR
- 2.0%
- Equity multiple
- 1.13×
- Total profit
- $7,050
- Equity at exit
- $16,341
Cash invested: $52,920 (down + closing). Projections, not guarantees.
Landlord ↔ Tenant lean methodology
- Overall (STATE)
- 85 Strongly Landlord-Friendly
- State North Carolina
- 85 Strongly Landlord-Friendly · R+3
- County
- — inherits STATE
- City
- — inherits STATE
ZIP-level market 27262
- Rents YoY
- 0.9%
- Active inventory
- 120
- Price-to-rent
- 8.1×
Monthly cashflow live
- Estimated rent
- $1,956 high interval (Pro) →
- Mortgage (P&I)
- −$991
- Tax from tax record
- −$86 /mo · $1,038/yr
- Insurance
- −$79
- HOA
- −$0
- Vacancy / Maint / Mgmt
- −$411
- Net cashflow
- $389
Break-even live
UW: 25.0% down · 7.5% · 30yr · 1.5% tax · 5.0% vac · 8.0% maint · 8.0% mgmt
Financing live
Cash to close
- Down payment
- $47,250
- Closing costs
- $5,670
- Reserves months
- —
- Total cash needed
- —
Loan-product check · same deal, 3 products live
Conventional
25% down · 7.5% · 30yr
- Down + closing
- —
- Monthly P&I
- —
- Monthly cashflow
- —
- DSCR
- —
- Eligible?
- —
Personal DTI + credit; lowest rate.
DSCR
20% down · 8.5% · 30yr
- Down + closing
- —
- Monthly P&I
- —
- Monthly cashflow
- —
- DSCR
- —
- Eligible?
- —
No personal income docs; deal must DSCR.
Hard money
10% down · 12.0% · 12mo
- Down + closing
- —
- Monthly P&I
- —
- Monthly cashflow
- —
- DSCR
- —
- Eligible?
- —
Short-term bridge; refi at stabilization.
Rent comps 8 comps
| Address | Beds | Baths | Sqft | Rent | $/sqft | DOM | Units | Dist |
|---|---|---|---|---|---|---|---|---|
| 1503 Larkin St High Point, NC | 4.0 | 3.0 | 1688 | $2,250 | $1.33 | 23d | 1 | 0.15mi |
| 1208 Madison St High Point, NC | 4.0 | 2.5 | 1550 | $1,745 | $1.13 | 23d | 1 | 0.20mi |
| 205 Guilford Ave High Point, NC | 3.0 | 1.5 | 1255 | $1,350 | $1.08 | 19d | 1 | 0.28mi |
| 2120 Chester Ridge Dr High Point, NC | 1.0–3.0 | 1.0–2.0 | 1001 | $1,443 | $1.44 | 14d | 7 | 0.64mi |
| 409 Woodrow Ave High Point, NC | 4.0 | 2.0 | 1863 | $2,650 | $1.42 | 19d | 1 | 0.71mi |
| 1508 Whitehall St High Point, NC | 3.0 | 2.0 | 1616 | $1,800 | $1.11 | 23d | 1 | 0.83mi |
| 706 Westchester Dr High Point, NC | 1.0–3.0 | 1.0–2.0 | 1012 | $1,190 | $1.18 | 14d | 10 | 1.13mi |
| 511 Jeanette Ave High Point, NC | 3.0 | 1.5 | 1664 | $1,950 | $1.17 | 23d | 1 | 1.28mi |
Listing history 2 events
-
2026-06-18remarks 699-char remark
-
2026-06-18$189,000 Active 1 DOM
ⓘ Source: listings_history table (triggers on properties + properties_extension) + one-shot
backfill from property_details.listing_events for pre-trigger history.
Tax reassessment forecast NC · Resets to sale price
- Current annual tax
- $1,038 · $86/mo
- Projected year-2 tax
- $1,550 · $129/mo
- Expected delta
- +$512/yr (+$43/mo · 49.3%)
ⓘ Screening estimate from a state-policy table — verify with the county assessor before closing.
Climate risk First Street
- Flood 6/10 Major FEMA zone X (unshaded) · 74% chance over 30 yrs
- Wildfire 1/10 Low
- Heat 5/10 Major 7 d/yr ≥104°F today · 16 d/yr by 30 yrs out
- Wind 4/10 Moderate 14% chance of damaging wind over 30 yrs
- Air quality 2/10 Low 1 unhealthy d/yr today · 1 by 30 yrs out
Nearby sold comps map
Loading sold comps map…
Walkable amenities ~0.75 mi
Loading nearby amenities…
Taxation est. · year 1
- Rental income
- $23,475
- − Mortgage interest
- −$10,587
- − Property taxes
- −$1,038
- − Insurance
- −$945
- − Repairs & maintenance
- −$1,878
- − Management
- −$1,878
- − Depreciation
- −$5,498
- Taxable income
- $1,651
- Est. tax owed @ 24.0%
- −$396
- After-tax cash flow
- $4,272/yr
For passive investors: Depreciation is non-cash, so a rental often shows a tax loss while cash-flowing — sheltering income. Rental losses are passive: they offset passive income freely, and up to $25,000/yr can offset ordinary (W-2) income if you actively participate and your MAGI is under $100k (phasing out to $0 by $150k); unused losses carry forward. On sale, claimed depreciation is recaptured at up to 25%, and gains may owe capital-gains tax (a 1031 exchange can defer both). Figures are a year-1 estimate at your 24.0% rate — not tax advice; consult a CPA.
Schools (NCES district)
- District
- Guilford County Schools
- NCES district ID
- 3701920
- Math proficiency
- 39% ▲ 1.00%
- Reading proficiency
- 45% ▲ 1.00%
- Median HH income
- $46,315
- Composite
- 35.78/100
- National rank
- #4842
- State rank
- #99 of 178 in NC
Livability — High Point
- Score
- 77/100
- State rank
- #31
- US rank
- #3084
Category grades
Schools grade is shown separately in the Schools card above.
Census & demographics
- Census place
- High Point, NC
- County
- Guilford County · 487,190 people
- City population
- 102,450
- Metro
- Greensboro-High Point, NC
- Population (ZIP)
- 28,353
- Household income
- $65,006
- Rent vs Own
- Severe rent burden
- 1046.0
Population outlook (Guilford County) Hauer SSP2
- Today (2025)
- 584,596 people
- By 2030
- 616,851 · +5.5%
- By 2040
- 678,451 · +16.1%
- By 2050
- 734,788 · +25.7%
- By 2075
- 862,985 · +47.6%
- By 2100
- 948,704 · +62.3%
Race, ethnicity, and origin ACS 2023
- Neighborhood character
- Diverse neighborhood (Simpson 0.65)
- Race & ethnicity
- White 50% Black 30% Hispanic / Latino 12% Two or more races 7% Asian 4%
- Hispanic origin (detail)
- Mexican 8% Puerto Rican 1%
- Common ancestry
- Slovak 4% Italian 2% Lithuanian 1%
- Foreign-born
- 14% · Canada
- Languages at home
- 80% English-only · Spanish 10% Other Indo-European 5% Other Asian/Pacific 1%
Political lean MEDSL · Guilford
- 2024 margin
- Strong D (+21.8) · D 60.2% · R 38.4% · Other 1.4%
- 2008→2024 swing
- +3.5pp toward D · 2008: 18.4pp · 2024: 21.8pp
- All cycles
- 2024: D+21.8 2020: D+23.1 2016: D+20.0 2012: D+16.5 2008: D+18.4
Not yet ingested
- Civics
- —
Market trends
- HPI YoY
- ▼ -279.14%
- Current HPI
- 205.6152
- Rent YoY
- ▲ 0.90%
- Metro
- Greensboro-High Point, NC
- State GDP YoY
- ▲ 3.28%
- F500 in state
- 26
Industry mix (Fortune 500 HQ in NC)
| Industry | F500 HQs | Revenue |
|---|---|---|
| Financial Services | 2 | $213B |
|
||
| Retail | 2 | $95B |
|
||
| Industrial Conglomerate | 1 | $38B |
|
||
| Metals / Steel | 1 | $35B |
|
||
| Utilities | 1 | $30B |
|
||
| Industrial Machinery | 1 | $19B |
|
||
Price history
+260.0% since first listed11 events — show timeline
- 2026-06-18 Listed $189,000 Triad MLS
- 2026-06-05 Sold (Public Records) $144,113 Public Records
- 2025-08-21 Price Changed $324,900 Triad MLS
- 2025-07-15 Price Changed $319,900 CANOPYMLS as Distributed by MLS Grid
- 2025-07-09 Price Changed $339,900 CANOPYMLS as Distributed by MLS Grid
- 2025-07-01 Price Changed $361,900 CANOPYMLS as Distributed by MLS Grid
- 2025-06-20 Price Changed $369,900 CANOPYMLS as Distributed by MLS Grid
- 2025-05-31 Listed $380,000 CANOPYMLS as Distributed by MLS Grid
- 2024-09-17 Sold (Public Records) $100,000 Public Records
- 1997-12-12 Sold (Public Records) $58,900 Public Records
- 1989-09-01 Sold (Public Records) $52,500 Public Records
Property tax history
+1.5%/yrLatest (2025): $1,038 · -0.8% YoY. Source: county tax records.
Cash-flow waterfall
monthlySold comps — $/sqft
last 12 mo · ≤1 miLoading sold comps…