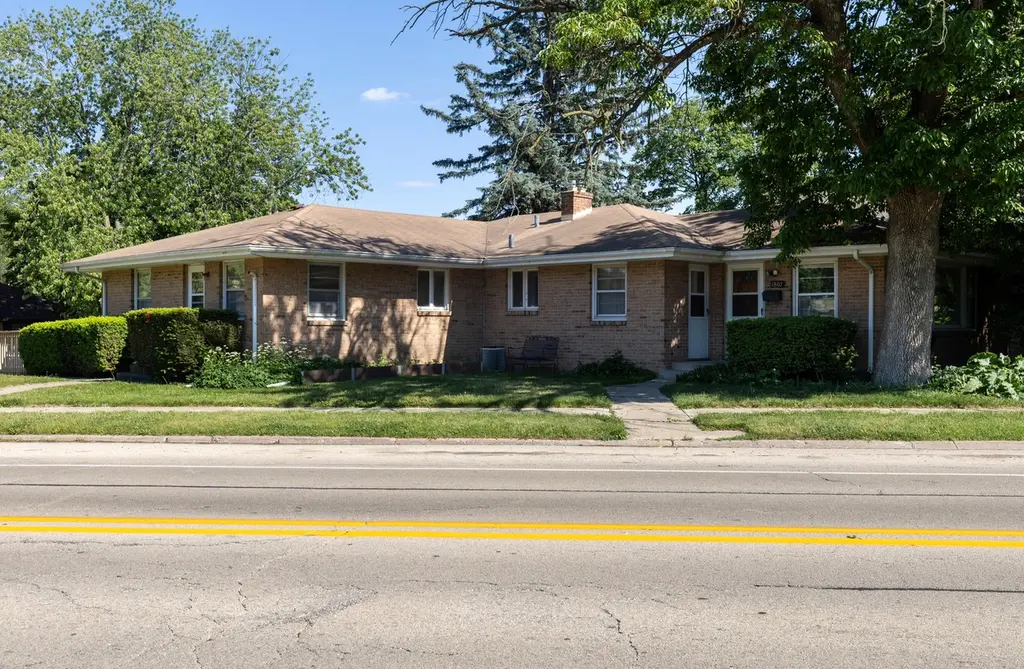
 Duplex
1807 Guilford Rd · Rockford, IL
Flood risk 1/10 · Minimal
- FEMA flood zone
- X (unshaded)
- Chance of flooding over 30 yrs
- 0.0%
- Est. flood insurance / yr
- $473 – $860
Fire risk 1/10 · Minimal
- Est. fire insurance / yr
- $804 – $1,492
Heat risk 2/10 · Minimal
- Hot days now (above 102°F)
- 7 days/yr
- Hot days in 30 yrs
- 15 days/yr
Wind risk 2/10 · Minimal
- Chance of severe wind over 30 yrs
- —
Air-quality risk 2/10 · Minimal
- Unhealthy air days now
- 1 days/yr
- Unhealthy air days in 30 yrs
- 2 days/yr
Risk factors via First Street. Map © Google.
Why this score? — see what drove the C grade
The composite is a weighted blend of 9 inputs, each scored 0–100. Each bar is that input's sub-score; the figure is the points it added to the 100-point composite (weight × sub-score).
- Cash flow +24.8/30.0
- DSCR +8.0/10.0
- ARV discount +7.5/15.0
- 1% rule +7.4/10.0
- Rent growth +4.0/5.0
- Livability +3.1/5.0
- Condition / age +2.5/5.0
- Schools +1.2/10.0
- Appreciation +0.0/10.0
$210,000
🖨 Deal sheet 📄 Offer letter ✓ Due diligence
Multi-family units
County records classify this as Multi-Family (2-4 Unit). Listing-text estimate: 2 units. confirmed
Listing remarks MLS
Great opportunity to own a well-maintained duplex with strong income potential! Each unit offers 3 bedrooms, 1 full bath, and access to a shared garage. Unit 1 is currently vacant, making it the perfect opportunity for an owner-occupant or investor looking to set their own rental rate. Unit 2 has been upgraded and is currently occupied on a month-to-month lease at $750/month, offering immediate rental income with flexibility for future adjustments. Property features include drain tile and sump pump systems already in place for added peace of mind. Washers and dryers in both units are included with the sale, making this a truly turnkey opportunity. Whether you’re looking to expand your investment portfolio, this property offers versatility and potential. Convenient layout, spacious units, and a desirable setup for both tenants and homeowners alike! Schedule your showing today!
Key facts
- Upgraded unit
- Sump pump systems
- Shared garage
Tags
Property features AI
Finance
- Financial info: Special service area: No
Exterior
- Parking: Attached garage with garage door opener; Driveway parking; Total of 4 parking spaces (2 garage spaces)
- Utilities: Public water; Public sewer
- Home design: Two- to four-unit property (duplex with two units); Fee simple ownership
- Construction: Brick construction; Built approximately 61–70 years ago; Property built before 1978
- Exterior features: Corner lot; School bus service
Interior
- Kitchen: Each unit includes a stove, refrigerator, dishwasher, microwave, and cooktop
- Bedrooms: 6 bedrooms (two separate 3-bedroom units)
- Flooring: Hardwood floors
- Bathrooms: 2 full bathrooms (one full bath per unit)
- Heating & cooling: Natural gas forced-air heating; Central air conditioning
- Interior features: Finished walk-out basement; 8 total rooms
- Laundry & utility: Washer and dryer in each unit; Laundry hook-ups
Neighborhood map
What this means for you Summary
Snapshot
- This is a 1×3bd/1.0ba + 1×2bd/1.0ba units multifamily listed at $210k.
Deal economics
- At list price, monthly cash flow is $444 ($5k/yr) — positive. Per door: $222/mo.
- The deal already cash-flows at list — no discount required.
- Meets the 1% rule at list price ($3k rent vs $210k).
- Cap rate 8.8% vs local median 6.1% in Rockford — top-decile yield for the area; either an underpriced asset or a hidden risk that comps aren't pricing in. Stress-test before assuming the spread holds.
Location & tenants
- Location reads 62/100 on livability (#876 in IL) — a middle-class / working-renter tenant base. Strengths: cost of living A+, housing A+, health & safety A+; Watch: schools F, crime F, amenities F.
- Rockford SD 205 (urban): math 12% / reading 16% proficiency, ranked #533 of 620 in IL (top 86%) — low school quality limits family demand, transient renter base, plan for 1-2y turnover; 73% free/reduced lunch — lower-income household profile, screen leases tightly.
- Market conditions: Rents rising fast (+5.9%/yr); 151 active listings in the ZIP; 1 comparable units currently listed for rent nearby; solid renter incomes; 285 units permitted in Winnebago County in 2024 (0 in 5+ unit buildings).
- This rent runs 40% of the median local income ($79k/yr) — at the standard rent-burdened threshold; future hikes will face affordability resistance.
Forward outlook
- Local home prices are declining (-3.0%/yr); year-one equity from $1k of loan paydown is wiped out by about $6k of value loss. Plan a longer hold.
- Winnebago County population projected at -20% by 2050 — secular population decline; favor cash flow + early exit over multi-decade hold.
- At projected returns (-3.0% appreciation + 5.9% rent growth), your $59k cash investment doubles in ~9 years — after that, you're playing with house money.
Negotiation context
- Only 2 days on market — expect competitive offers; lowballing is unlikely to land.
- 3 sale attempts since 7y ago with the ask held roughly flat each time — persistent listings suggest the price (not the market) is what's stuck; bring a comps-based counter.
- Current owner paid $120k; list at $210k implies a 75% gain — meaningful room to come down on a strong offer.
Questions for the listing agent
- Can we see the unit-by-unit rent roll, current vacancy, and any below-market leases? What's the average tenancy length?
- What capital expenditures (roof, boiler, parking lot, exteriors) have been made in the last 5 years, and what's planned in the next 2?
- Built in 1964 — when were the roof, HVAC, electrical panel, plumbing, and water heater last replaced?
- Is there a deadline driving the sale (1031 exchange, divorce, estate, relocation)? That informs how much negotiation room exists.
- Schools are F-rated, which usually means shorter tenancies and higher turnover. Who's the typical renter profile here, and what's been the actual vacancy rate?
- Crime grade is F in this area — have there been break-ins, vandalism, or insurance claims at this property in the last 3 years? What carrier currently insures it and at what premium?
- What's the average days-on-market for RENTAL listings here right now (not sales)? A rising rental-DOM trend means longer vacancies and softer asking-rent achievability than the comps imply.
- What's the recent tenant-quality profile in this submarket — average credit score on applications, eviction rate, late-payment / NSF rate, and stable-employment percentage? A property-management company in the area should have these aggregated.
- How much new apartment / multifamily construction is in the pipeline within 1–3 miles? Heavy new supply (>2% of stock underway) typically softens rents 12–24 months out; light construction supports rent growth.
Investment metrics
- 1% rule
- 1.24% ✓
- Cap rate
- 8.83%
- Cash-on-cash
- 9.05%
- DSCR
- 1.40
- GRM
- 6.7
CMA / ARV
No comps found within radius.
Show comp detail 6 sales within ~0.75 mi
| Address | Dist | Beds/Ba | Sqft | Sold | Price | $/sf | Match |
|---|---|---|---|---|---|---|---|
| 1838-1840 Rural St | 0.12mi | 6/2.0 | — | 22mo | $195,000 | — | 64 |
| 224 Regan St | 0.61mi | 6/2.0 | — | 15mo | $185,000 | — | 46 |
| 140 Summit St | 0.71mi | 6/4.0 | — | 1mo | $235,000 | — | 46 |
| 140-142 Summit St | 0.71mi | 6/4.0 | — | 1mo | $235,000 | — | 46 |
| 209 S Highland Ave | 0.71mi | 5/2.0 (-1) | — | 10mo | $206,000 | — | 41 |
| 1602 E State St | 0.65mi | 6/6.0 | 2,000 | 7mo | $740,000 | $370 | 36 |
Match score weights: distance 35% · size 25% · config 20% · recency 20%. Top-matched comps best support the ARV.
Projected returns pro-forma
-3.0% appreciation · 5.92% rent growth · sell at horizon
- IRR
- 1.0%
- Equity multiple
- 1.04×
- Total profit
- $2,248
- Equity at exit
- $31,312
- IRR
- 13.6%
- Equity multiple
- 2.25×
- Total profit
- $73,245
- Equity at exit
- $18,157
Cash invested: $58,800 (down + closing). Projections, not guarantees.
Landlord ↔ Tenant lean methodology
- Overall (STATE)
- 43 Moderately Tenant-Leaning
- State Illinois
- 43 Moderately Tenant-Leaning · D+7
- County
- — inherits STATE
- City
- — inherits STATE
ZIP-level market 61107
- Home prices YoY
- -20.1%
- Rents YoY
- 5.9%
- Active inventory
- 151
- Price-to-rent
- 12.4×
Monthly cashflow live
- Estimated rent
- $2,606 high interval (Pro) →
- Mortgage (P&I)
- −$1,101
- Tax from tax record
- −$426 /mo · $5,116/yr
- Insurance
- −$88
- HOA
- −$0
- Vacancy / Maint / Mgmt
- −$547
- Net cashflow
- $444
Break-even live
2-unit breakdown (identical units grouped — click to expand)
| Units | Beds | Baths | Est. rent |
|---|---|---|---|
| 1× unit | 3 | 1 | $1,414 |
| 1× unit | 2 | 1 | $1,192 |
| Total (2 units) | $2,606 | ||
UW: 25.0% down · 7.5% · 30yr · 1.5% tax · 5.0% vac · 8.0% maint · 8.0% mgmt
Financing live
Cash to close
- Down payment
- $52,500
- Closing costs
- $6,300
- Reserves months
- —
- Total cash needed
- —
Loan-product check · same deal, 3 products live
Conventional
25% down · 7.5% · 30yr
- Down + closing
- —
- Monthly P&I
- —
- Monthly cashflow
- —
- DSCR
- —
- Eligible?
- —
Personal DTI + credit; lowest rate.
DSCR
20% down · 8.5% · 30yr
- Down + closing
- —
- Monthly P&I
- —
- Monthly cashflow
- —
- DSCR
- —
- Eligible?
- —
No personal income docs; deal must DSCR.
Hard money
10% down · 12.0% · 12mo
- Down + closing
- —
- Monthly P&I
- —
- Monthly cashflow
- —
- DSCR
- —
- Eligible?
- —
Short-term bridge; refi at stabilization.
Rent comps 1 comps
| Address | Beds | Baths | Sqft | Rent | $/sqft | DOM | Units | Dist |
|---|---|---|---|---|---|---|---|---|
| 620 Paris Ave Rockford, IL | 5.0 | 3.5 | — | $2,200 | — | 21d | 1 | 0.25mi |
Listing history 10 events
-
2026-05-30status $210,000 Pending 2 DOM
-
2026-05-27$210,000 Active 896-char remark
Show marketing remark (896 chars)
Great opportunity to own a well-maintained duplex with strong income potential! Each unit offers 3 bedrooms, 1 full bath, and access to a shared garage. Unit 1 is currently vacant, making it the perfect opportunity for an owner-occupant or investor looking to set their own rental rate. Unit 2 has been upgraded and is currently occupied on a month-to-month lease at $750/month, offering immediate rental income with flexibility for future adjustments. Property features include drain tile and sump pump systems already in place for added peace of mind. Washers and dryers in both units are included with the sale, making this a truly turnkey opportunity. Whether you’re looking to expand your investment portfolio, this property offers versatility and potential. Convenient layout, spacious units, and a desirable setup for both tenants and homeowners alike! Schedule your showing today!
-
2026-05-27$210,000 Active
Show marketing remark (896 chars)
Great opportunity to own a well-maintained duplex with strong income potential! Each unit offers 3 bedrooms, 1 full bath, and access to a shared garage. Unit 1 is currently vacant, making it the perfect opportunity for an owner-occupant or investor looking to set their own rental rate. Unit 2 has been upgraded and is currently occupied on a month-to-month lease at $750/month, offering immediate rental income with flexibility for future adjustments. Property features include drain tile and sump pump systems already in place for added peace of mind. Washers and dryers in both units are included with the sale, making this a truly turnkey opportunity. Whether you’re looking to expand your investment portfolio, this property offers versatility and potential. Convenient layout, spacious units, and a desirable setup for both tenants and homeowners alike! Schedule your showing today!
-
2019-07-05soldstatus $120,000
-
2019-06-28soldstatus $120,000 545-char remark
Show marketing remark (545 chars)
GREAT INVESTMENT PROPERTY! THIS LOW MAINTENANCE ALL BRICK DUPLEX HAS A NEWER ROOF IN 2012 WITH ONE UNIT FACING GUILFORD RD AND THE OTHER FACING HIGHLAND AVE. BOTH UNITS ARE ROUGHLY THE SAME SIZE AND HAVE SEPARATE UTILITIES. GUILFORD UNIT: 3 BEDROOMS AND 1 BATH, FURNACE 2010, H2O 2010, DRAIN TILE AND SUMP PUMP, FINISHED ROOM IN LOWER LEVEL, IN UNIT WASHER AND DRYER. HIGHLAND UNIT: OCCUPIED WITH 2 BEDROOMS AND 1 BATH, FURNACE 2014, C/A 2010, FINISHED SPACE IN LOWER LEVEL, IN UNIT WASHER & DRYER, ROT WITH LEASE. SOLD "AS IS".
-
2019-05-21$120,000 545-char remark
Show marketing remark (545 chars)
GREAT INVESTMENT PROPERTY! THIS LOW MAINTENANCE ALL BRICK DUPLEX HAS A NEWER ROOF IN 2012 WITH ONE UNIT FACING GUILFORD RD AND THE OTHER FACING HIGHLAND AVE. BOTH UNITS ARE ROUGHLY THE SAME SIZE AND HAVE SEPARATE UTILITIES. GUILFORD UNIT: 3 BEDROOMS AND 1 BATH, FURNACE 2010, H2O 2010, DRAIN TILE AND SUMP PUMP, FINISHED ROOM IN LOWER LEVEL, IN UNIT WASHER AND DRYER. HIGHLAND UNIT: OCCUPIED WITH 2 BEDROOMS AND 1 BATH, FURNACE 2014, C/A 2010, FINISHED SPACE IN LOWER LEVEL, IN UNIT WASHER & DRYER, ROT WITH LEASE. SOLD "AS IS".
-
2012-10-22soldstatus $119,000
-
2005-09-07soldstatus $158,500
-
1999-08-02soldstatus $120,000
-
1999-02-01soldstatus $107,000
ⓘ Source: listings_history table (triggers on properties + properties_extension) + one-shot
backfill from property_details.listing_events for pre-trigger history.
Tax reassessment forecast IL · Partial reset (capped growth)
- Current annual tax
- $5,116 · $426/mo
- Projected year-2 tax
- $5,116 · $426/mo
- Expected delta
- $0/yr ($0/mo · 0.0%)
ⓘ Screening estimate from a state-policy table — verify with the county assessor before closing.
Climate risk First Street
- Flood 1/10 Low FEMA zone X (unshaded) · 0% chance over 30 yrs
- Wildfire 1/10 Low
- Heat 2/10 Low 7 d/yr ≥102°F today · 15 d/yr by 30 yrs out
- Wind 2/10 Low
- Air quality 2/10 Low 1 unhealthy d/yr today · 2 by 30 yrs out
Nearby sold comps map
Loading sold comps map…
Walkable amenities ~0.75 mi
Loading nearby amenities…
Taxation est. · year 1
- Rental income
- $31,272
- − Mortgage interest
- −$11,763
- − Property taxes
- −$5,116
- − Insurance
- −$1,050
- − Repairs & maintenance
- −$2,502
- − Management
- −$2,502
- − Depreciation
- −$6,109
- Taxable income
- $2,230
- Est. tax owed @ 24.0%
- −$535
- After-tax cash flow
- $4,789/yr
For passive investors: Depreciation is non-cash, so a rental often shows a tax loss while cash-flowing — sheltering income. Rental losses are passive: they offset passive income freely, and up to $25,000/yr can offset ordinary (W-2) income if you actively participate and your MAGI is under $100k (phasing out to $0 by $150k); unused losses carry forward. On sale, claimed depreciation is recaptured at up to 25%, and gains may owe capital-gains tax (a 1031 exchange can defer both). Figures are a year-1 estimate at your 24.0% rate — not tax advice; consult a CPA.
Schools (NCES district)
- District
- Rockford SD 205
- NCES district ID
- 1734510
- Math proficiency
- 12% ▼ -2.00%
- Reading proficiency
- 16% ▼ -3.00%
- Median HH income
- $42,533
- Composite
- 12.21/100
- National rank
- #9649
- State rank
- #533 of 620 in IL
Livability — Rockford
- Score
- 62/100
- State rank
- #876
- US rank
- #17035
Category grades
Schools grade is shown separately in the Schools card above.
Census & demographics
- Census place
- Rockford, IL
- County
- Winnebago County · 147,297 people
- City population
- 147,297
- Metro
- Rockford, IL
- Population (ZIP)
- 30,765
- Household income
- $78,574
- Rent vs Own
- Severe rent burden
- 981.0
Population outlook (Winnebago County) Hauer SSP2
- Today (2025)
- 271,080 people
- By 2030
- 260,684 · -3.8%
- By 2040
- 238,405 · -12.1%
- By 2050
- 216,129 · -20.3%
- By 2075
- 172,882 · -36.2%
- By 2100
- 135,336 · -50.1%
Race, ethnicity, and origin ACS 2023
- Neighborhood character
- Predominantly White (68%)
- Race & ethnicity
- White 68% Hispanic / Latino 15% Black 9% Two or more races 9% Asian 4% Native American 1%
- Hispanic origin (detail)
- Mexican 11% Puerto Rican 1%
- Common ancestry
- Romanian 6% Portuguese 4% Lithuanian 2%
- Foreign-born
- 10% · Canada, China
- Languages at home
- 83% English-only · Spanish 11% Arabic 1% Other Indo-European 1%
Political lean MEDSL · Winnebago
- 2024 margin
- Toss-up / Even · D 49.5% · R 49.0% · Other 1.5%
- 2008→2024 swing
- -12.2pp toward R · 2008: 12.8pp · 2024: 0.6pp
- All cycles
- 2024: D+0.6 2020: D+2.5 2016: R+1.2 2012: D+5.7 2008: D+12.8
Not yet ingested
- Civics
- —
Market trends
- HPI YoY
- ▼ -62.46%
- Current HPI
- 248.8598
- Rent YoY
- ▲ 5.92%
- Metro
- Rockford, IL
- State GDP YoY
- ▲ 1.59%
- F500 in state
- 60
Industry mix (Fortune 500 HQ in IL)
| Industry | F500 HQs | Revenue |
|---|---|---|
| Insurance | 4 | $201B |
|
||
| Consumer Goods | 4 | $87B |
|
||
| Industrial Machinery | 3 | $64B |
|
||
| Healthcare | 2 | $55B |
|
||
| Retail / Pharmacy | 1 | $148B |
|
||
| Agriculture / Food | 1 | $86B |
|
||
Price history
+96.3% since first listed9 events — show timeline
- 2026-05-27 Listed $210,000 NWIAR
- 2026-05-27 Listed $210,000 MRED as Distributed by MLS Grid
- 2019-07-05 Sold (Public Records) $120,000 Public Records
- 2019-06-28 Sold (MLS) $120,000 NWIAR
- 2019-05-21 Listed $120,000 NWIAR
- 2012-10-22 Sold (Public Records) $119,000 Public Records
- 2005-09-07 Sold (Public Records) $158,500 Public Records
- 1999-08-02 Sold (Public Records) $120,000 Public Records
- 1999-02-01 Sold (Public Records) $107,000 Public Records
Property tax history
+0.3%/yrLatest (2024): $5,116 · +5.1% YoY. Source: county tax records.
Cash-flow waterfall
monthlySold comps — $/sqft
last 12 mo · ≤1 miLoading sold comps…