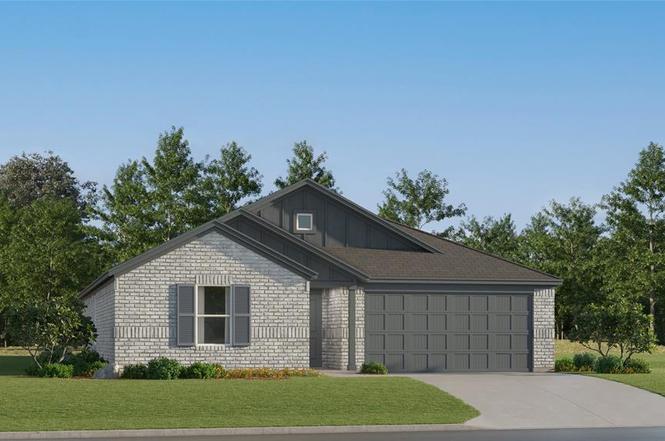
6305 Graceland Dr · Greenville, TX
Flood risk No data
- FEMA flood zone
- —
- Chance of flooding over 30 yrs
- —
- Est. flood insurance / yr
- —
Fire risk No data
- Est. fire insurance / yr
- —
Heat risk No data
- Hot days now (above threshold)
- —
- Hot days in 30 yrs
- —
Wind risk No data
- Chance of severe wind over 30 yrs
- —
Air-quality risk No data
- Unhealthy air days now
- —
- Unhealthy air days in 30 yrs
- —
Risk factors via First Street. Map © Google.
Why this score? — see what drove the D- grade
The composite is a weighted blend of 9 inputs, each scored 0–100. Each bar is that input's sub-score; the figure is the points it added to the 100-point composite (weight × sub-score).
- Cash flow +13.6/30.0
- ARV discount +7.5/15.0
- DSCR +4.1/10.0
- Livability +3.9/5.0
- 1% rule +2.6/10.0
- Condition / age +2.5/5.0
- Rent growth +2.2/5.0
- Schools +2.0/10.0
- Appreciation +0.0/10.0
$229,999
🖨 Deal sheet (PDF) 📄 Offer letter ✓ Due diligence
Listing remarks
This new single-story home boasts a convenient and low-maintenance layout. Three bedrooms are secluded near the front of the home, leading to a spacious and flexible open-concept layout where the kitchen, dining room and family room meet. Nestled into a private rear corner is the lavish owner’s suite, featuring a full bathroom and walk-in closet. Prices, dimensions and features may vary and are subject to change. Photos are for illustrative purposes only.
Key facts
- Lavish owner's suite
- Full bathroom
- Walk-in closet
Tags
Neighborhood map
What this means for you Summary
Snapshot
- This is a 3-bed/2.0-bath other listed at $230k.
Deal economics
- At list price, monthly cash flow is $14 ($168/yr) — positive.
- The deal already cash-flows at list — no discount required.
- To meet the 1% rule (rent ≥ 1% of price), the offer needs to be $175k (24.0% below list).
- Recommended offer: $175k (24.0% below list) — sets the bar for 1% rule.
- Cap rate 6.4% vs local median 4.1% in Greenville — top-decile yield for the area; either an underpriced asset or a hidden risk that comps aren't pricing in. Stress-test before assuming the spread holds.
Location & tenants
- Location reads 77/100 on livability (#78 in TX, #2,719 nationally) — a middle-class / working-renter tenant base. Strengths: cost of living A+, housing A+, health & safety A; Watch: employment D, commute F.
- Greenville ISD (town): math 20% / reading 26% proficiency, ranked #743 of 826 in TX (top 90%) — low school quality limits family demand, transient renter base, plan for 1-2y turnover.
- Zoned schools: Lamar El (math 28% / reading 33%, grade F, #2,464 of 4,322 statewide, top 58%, 554 students, 59% FRL); Greenville Middle (math 17% / reading 28%, grade F, #1,341 of 1,662 statewide, top 82%, 727 students, 76% FRL); Greenville H S (math 17% / reading 37%, grade F, #1,204 of 1,632 statewide, top 75%, 1,480 students, 66% FRL).
- Market conditions: Rents soft (-1.0%/yr); 298 active listings in the ZIP; 40 comparable units currently listed for rent nearby; rentals at typical pace (median 21d on market — plan ~3-4 weeks tenant-placement turnaround); solid renter incomes; 1,289 units permitted in Hunt County in 2024 (527 in 5+ unit buildings).
Forward outlook
- Local home prices are declining (-3.0%/yr); year-one equity from $2k of loan paydown is wiped out by about $7k of value loss. Plan a longer hold.
- Hunt County population projected at +15% by 2050 — modest demand growth; plan on rents tracking national, not racing it.
Negotiation context
- It's been on market 28 days — a 2% lower offer ($227k) is reasonable based on typical stale-listing flexibility.
Questions for the listing agent
- What does the HOA fee cover, when was the last increase, and are there any pending special assessments or reserve-fund shortfalls?
- Is there a deadline driving the sale (1031 exchange, divorce, estate, relocation)? That informs how much negotiation room exists.
- Schools are D-rated, which usually means shorter tenancies and higher turnover. Who's the typical renter profile here, and what's been the actual vacancy rate?
- The area grade is low — what's the realistic commute time and amenity access for the typical tenant pool here? Any planned neighborhood developments (good or bad) we should know about?
- What's the average days-on-market for RENTAL listings here right now (not sales)? A rising rental-DOM trend means longer vacancies and softer asking-rent achievability than the comps imply.
- What's the recent tenant-quality profile in this submarket — average credit score on applications, eviction rate, late-payment / NSF rate, and stable-employment percentage? A property-management company in the area should have these aggregated.
- How much new for-sale + rental construction is in the pipeline within 1–3 miles? Heavy new supply typically softens prices + rents 12–24 months out; constrained supply supports both.
Investment metrics
- 1% rule
- 0.76% ✗
- Cap rate
- 6.37%
- Cash-on-cash
- 0.26%
- DSCR
- 1.01
- GRM
- 11.0
CMA / ARV
No comps found within radius.
Projected returns pro-forma
-3.0% appreciation · 0.0% rent growth · sell at horizon
- IRR
- -18.9%
- Equity multiple
- 0.35×
- Total profit
- $-41,613
- Equity at exit
- $34,294
- IRR
- -17.9%
- Equity multiple
- 0.14×
- Total profit
- $-55,340
- Equity at exit
- $19,886
Cash invested: $64,400 (down + closing). Projections, not guarantees.
Landlord ↔ Tenant lean methodology
- Overall (STATE)
- 87 Strongly Landlord-Friendly
- State Texas
- 87 Strongly Landlord-Friendly · R+5
- County
- — inherits STATE
- City
- — inherits STATE
ZIP-level market 75402
- Rents YoY
- -1.0%
- Active inventory
- 298
- Price-to-rent
- 11.0×
Monthly cashflow live
- Estimated rent
- $1,748 high interval (Pro) →
- Mortgage (P&I)
- −$1,206
- Tax from tax record
- −$61 /mo · $736/yr
- Insurance
- −$96
- HOA
- −$4
- Vacancy / Maint / Mgmt
- −$367
- Net cashflow
- $14
Break-even live
Sensitivity live
| Price | -10% $144 | -5% $79 | +0% $14 | +5% $-51 | +10% $-116 |
|---|---|---|---|---|---|
| Rent | -10% $-124 | -5% $-55 | +0% $14 | +5% $83 | +10% $152 |
| Rate | -1.0pp $130 | -0.5pp $72 | base $14 | +0.5pp $-46 | +1.0pp $-106 |
UW: 25.0% down · 7.5% · 30yr · 1.5% tax · 5.0% vac · 8.0% maint · 8.0% mgmt
Financing live
Cash to close
- Down payment
- $57,500
- Closing costs
- $6,900
- Reserves months
- —
- Total cash needed
- —
Loan-product check · same deal, 3 products live
Conventional
25% down · 7.5% · 30yr
- Down + closing
- —
- Monthly P&I
- —
- Monthly cashflow
- —
- DSCR
- —
- Eligible?
- —
Personal DTI + credit; lowest rate.
DSCR
20% down · 8.5% · 30yr
- Down + closing
- —
- Monthly P&I
- —
- Monthly cashflow
- —
- DSCR
- —
- Eligible?
- —
No personal income docs; deal must DSCR.
Hard money
10% down · 12.0% · 12mo
- Down + closing
- —
- Monthly P&I
- —
- Monthly cashflow
- —
- DSCR
- —
- Eligible?
- —
Short-term bridge; refi at stabilization.
Rent comps 40 comps
| Address | Beds | Baths | Sqft | Rent | $/sqft | DOM | Units | Dist |
|---|---|---|---|---|---|---|---|---|
| 1412 Waverley Dr Greenville, TX | 3.0 | 2.0 | 1333 | $1,650 | $1.24 | 45d | 1 | 0.11mi |
| 1401 Brindle Dr Greenville, TX | 3.0 | 2.0 | 1290 | $1,750 | $1.36 | 45d | 1 | 0.16mi |
| 1417 Brindle Dr Greenville, TX | 3.0 | 2.0 | 1187 | $1,175 | $0.99 | 0d | 1 | 0.19mi |
| 50021 Del Ra Dr Greenville, TX | 3.0 | 1.5 | 1452 | $1,700 | $1.17 | 26d | 1 | 0.19mi |
| 6529 Graceland Dr Greenville, TX | 3.0 | 2.0 | 1702 | $1,875 | $1.10 | 26d | 1 | 0.35mi |
| 1426 Thibodaux Dr Greenville, TX | 3.0 | 2.0 | 1659 | $1,795 | $1.08 | 0d | 1 | 0.37mi |
| 512 Oakridge Dr Greenville, TX | 3.0 | 3.0 | 1695 | $1,700 | $1.00 | 45d | 1 | 0.60mi |
| 328 Jamie Way Greenville, TX | 3.0 | 2.0 | 1841 | $2,150 | $1.17 | 20d | 1 | 0.60mi |
| 6809 Topaz Dr Greenville, TX | 3.0 | 3.0 | 2052 | $1,995 | $0.97 | 45d | 1 | 0.71mi |
| 6820 Topaz Dr Greenville, TX | 3.0 | 2.5 | 1819 | $900 | $0.49 | 45d | 1 | 0.73mi |
| 1214 Interstate Highway 30 Greenville, TX | 1.0–3.0 | 1.0–2.0 | 900 | $1,500 | $1.67 | 0d | 1 | 0.76mi |
| 6915 Justin Ln Greenville, TX | 3.0 | 2.0 | 1405 | $1,925 | $1.37 | 24d | 1 | 0.87mi |
| 6320 Stonewall St Greenville, TX | 3.0 | 1.0–2.0 | 930 | $1,725 | $1.85 | 0d | 1 | 0.89mi |
| 1012 Eva Dr Greenville, TX | 3.0 | 2.0 | 1582 | $1,895 | $1.20 | 26d | 1 | 0.95mi |
| 1017 Eva Dr Greenville, TX | 3.0 | 2.0 | 1582 | $1,450 | $0.92 | 45d | 1 | 0.99mi |
| 906 Tippit Ln Greenville, TX | 3.0 | 2.0 | 1605 | $1,900 | $1.18 | 4d | 1 | 1.01mi |
| 708 Tippit Ln Greenville, TX | 3.0 | 2.0 | 1612 | $1,895 | $1.18 | 0d | 1 | 1.01mi |
| 2509 Garden Dr Greenville, TX | 3.0 | 2.0 | 1287 | $1,450 | $1.13 | 0d | 1 | 1.04mi |
| 804 Ransom Way Greenville, TX | 3.0 | 2.0 | 1605 | $1,900 | $1.18 | 20d | 1 | 1.06mi |
| 802 Ransom Way Greenville, TX | 3.0 | 2.0 | 1605 | $1,900 | $1.18 | 4d | 1 | 1.07mi |
| 3000 Webb Ave Unit 402 Greenville, TX | 2.0 | 1.5 | 1300 | $1,425 | $1.10 | 26d | 1 | 1.11mi |
| 708 Hardaway Ln Greenville, TX | 3.0 | 2.0 | 1605 | $1,900 | $1.18 | 12d | 1 | 1.12mi |
| 3000 Webb Ave Greenville, TX | 2.0 | 1.5 | 1300 | $1,395 | $1.07 | 0d | 1 | 1.13mi |
| 1001 Hardaway Dr Greenville, TX | 3.0 | 2.0 | 1596 | $1,850 | $1.16 | 4d | 1 | 1.15mi |
| 1005 Hardaway Ln Greenville, TX | 3.0 | 2.0 | 1605 | $1,950 | $1.21 | 3d | 1 | 1.15mi |
| 1905 Center Point Ln Greenville, TX | 1.0–2.0 | 1.0–2.0 | 925 | $1,436 | $1.55 | 0d | 16 | 1.16mi |
| 703 Moseley Ln Greenville, TX | 3.0 | 2.0 | 1605 | $1,890 | $1.18 | 45d | 1 | 1.20mi |
| 706 Greyson Ln Greenville, TX | 3.0 | 2.0 | 1605 | $1,895 | $1.18 | 45d | 1 | 1.23mi |
| 6504 Flamingo Rd Greenville, TX | 3.0 | 2.0 | 1190 | $1,425 | $1.20 | 26d | 1 | 1.24mi |
| 4504 Stonewall St Greenville, TX | 4.0 | 3.0 | 2212 | $1,500 | $0.68 | 45d | 1 | 1.28mi |
| 601 Beechwood Dr Greenville, TX | 3.0 | 2.0 | 1890 | $1,825 | $0.97 | 26d | 1 | 1.31mi |
| 4205 Stuart St Greenville, TX | 3.0 | 2.0 | 1228 | $1,790 | $1.46 | 9d | 1 | 1.32mi |
| 4102 Gordon St Greenville, TX | 3.0 | 2.0 | 1296 | $1,675 | $1.29 | 26d | 1 | 1.34mi |
| 4102 Gordon St Greenville, TX | 3.0 | 2.0 | 1296 | $1,675 | $1.29 | 13d | 1 | 1.34mi |
| 4102 Gordon St Greenville, TX | 3.0 | 2.0 | 1296 | $1,675 | $1.29 | 9d | 1 | 1.34mi |
| 710 Teakwood Dr Greenville, TX | 4.0 | 2.0 | 1862 | $2,095 | $1.13 | 26d | 1 | 1.35mi |
| 6716 Flamingo Rd Greenville, TX | 3.0 | 2.0 | 1344 | $1,650 | $1.23 | 0d | 1 | 1.36mi |
| 8503 Christie Ln Greenville, TX | 3.0 | 2.0 | 1547 | $1,895 | $1.22 | 0d | 1 | 1.36mi |
| 4105 Stuart St Greenville, TX | 3.0 | 2.0 | 1558 | $1,675 | $1.08 | 18d | 1 | 1.36mi |
| 4214 Johnson St Greenville, TX | 3.0 | 1.0 | 1096 | $1,250 | $1.14 | 26d | 1 | 1.37mi |
HOA detail
- Monthly dues
- $4 · $48/yr
Listing history 5 events
-
2026-03-14status Pending
-
2026-03-07price $229,999
-
2026-03-04price $234,999
-
2026-02-25price $230,999
-
2026-02-14$255,999 Active
ⓘ Source: listings_history table (triggers on properties + properties_extension) + one-shot
backfill from property_details.listing_events for pre-trigger history.
Tax reassessment forecast TX · Resets to sale price
- Current annual tax
- $736 · $61/mo
- Projected year-2 tax
- $4,209 · $351/mo
- Expected delta
- +$3,473/yr (+$289/mo · 471.8%)
ⓘ Screening estimate from a state-policy table — verify with the county assessor before closing.
Nearby sold comps map
Loading sold comps map…
Walkable amenities ~0.75 mi
Loading nearby amenities…
Taxation est. · year 1
- Rental income
- $20,982
- − Mortgage interest
- −$12,884
- − Property taxes
- −$736
- − Insurance
- −$1,150
- − Repairs & maintenance
- −$1,679
- − Management
- −$1,679
- − HOA
- −$48
- − Depreciation
- −$6,691
- Taxable loss
- −$3,884
- Est. tax savings @ 24.0%
- +$932
- After-tax cash flow
- $1,100/yr
For passive investors: Depreciation is non-cash, so a rental often shows a tax loss while cash-flowing — sheltering income. Rental losses are passive: they offset passive income freely, and up to $25,000/yr can offset ordinary (W-2) income if you actively participate and your MAGI is under $100k (phasing out to $0 by $150k); unused losses carry forward. On sale, claimed depreciation is recaptured at up to 25%, and gains may owe capital-gains tax (a 1031 exchange can defer both). Figures are a year-1 estimate at your 24.0% rate — not tax advice; consult a CPA.
Schools (NCES district)
- District
- Greenville ISD
- NCES district ID
- 4821720
- Math proficiency
- 20% ▼ -12.00%
- Reading proficiency
- 26% ▼ -7.00%
- Median HH income
- $41,374
- Composite
- 19.56/100
- National rank
- #8759
- State rank
- #743 of 826 in TX
Livability — Greenville
- Score
- 77/100
- State rank
- #78
- US rank
- #2719
Category grades
Schools grade is shown separately in the Schools card above.
Census & demographics
- Census place
- Greenville, TX
- County
- Hunt County · 71,969 people
- City population
- 42,767
- Metro
- Dallas-Fort Worth-Arlington, TX
- Population (ZIP)
- 20,098
- Household income
- $77,877
- Rent vs Own
- Severe rent burden
- 361.0
Population outlook (Hunt County) Hauer SSP2
- Today (2025)
- 97,090 people
- By 2030
- 100,452 · +3.5%
- By 2040
- 106,544 · +9.7%
- By 2050
- 111,218 · +14.6%
- By 2075
- 121,695 · +25.3%
- By 2100
- 123,683 · +27.4%
Race, ethnicity, and origin ACS 2023
- Neighborhood character
- Predominantly White (74%)
- Race & ethnicity
- White 74% Hispanic / Latino 11% Black 10% Two or more races 8% Asian 2%
- Hispanic origin (detail)
- Mexican 7% Puerto Rican 1%
- Common ancestry
- Slovak 2% Romanian 2% Lithuanian 1%
- Foreign-born
- 3% · Canada, China
- Languages at home
- 93% English-only · Spanish 5% Chinese 1%
Political lean MEDSL · Hunt
- 2024 margin
- Solid R (+55.5) · D 21.9% · R 77.4%
- 2008→2024 swing
- -14.9pp toward R · 2008: -40.6pp · 2024: -55.5pp
- All cycles
- 2024: R+55.5 2020: R+52.5 2016: R+56.3 2012: R+51.2 2008: R+40.6
Not yet ingested
- Civics
- —
Market trends
- HPI YoY
- ▼ -141.52%
- Current HPI
- 232.0505
- Rent YoY
- ▼ -1.00%
- Metro
- Dallas-Fort Worth-Arlington, TX
- State GDP YoY
- ▲ 3.95%
- F500 in state
- 110
Industry mix (Fortune 500 HQ in TX)
| Industry | F500 HQs | Revenue |
|---|---|---|
| Energy | 16 | $1,198B |
|
||
| Technology | 5 | $198B |
|
||
| Engineering / Construction | 4 | $72B |
|
||
| Energy Services | 3 | $60B |
|
||
| Utilities | 3 | $41B |
|
||
| Healthcare | 2 | $330B |
|
||
Price history
-10.2% since first listed5 events — show timeline
- 2026-03-14 Pending — NTREIS
- 2026-03-07 Price Changed $229,999 NTREIS
- 2026-03-04 Price Changed $234,999 NTREIS
- 2026-02-25 Price Changed $230,999 NTREIS
- 2026-02-14 Listed $255,999 NTREIS
Property tax history
+1.3%/yrLatest (2025): $736 · +1.3% YoY. Source: county tax records.
Cash-flow waterfall
monthlySold comps — $/sqft
last 12 mo · ≤1 miLoading sold comps…