 🏗️ New Construction
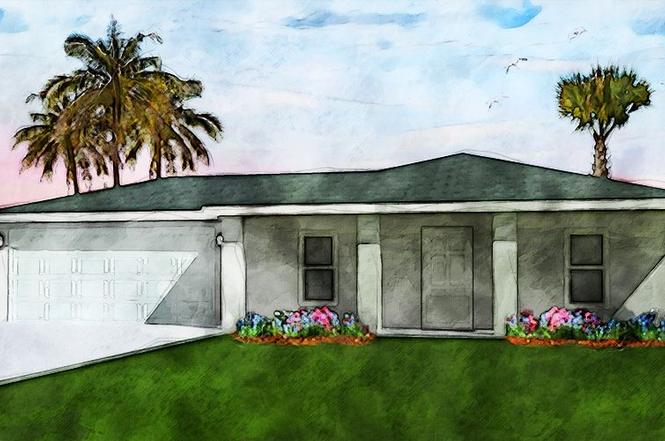
The Paso Fino Plan · Port LaBelle, FL
Flood risk No data
- FEMA flood zone
- —
- Chance of flooding over 30 yrs
- —
- Est. flood insurance / yr
- —
Fire risk No data
- Est. fire insurance / yr
- —
Heat risk No data
- Hot days now (above threshold)
- —
- Hot days in 30 yrs
- —
Wind risk No data
- Chance of severe wind over 30 yrs
- —
Air-quality risk No data
- Unhealthy air days now
- —
- Unhealthy air days in 30 yrs
- —
Risk factors via First Street. Map © Google.
Why this score? — see what drove the D+ grade
The composite is a weighted blend of 9 inputs, each scored 0–100. Each bar is that input's sub-score; the figure is the points it added to the 100-point composite (weight × sub-score).
- Cash flow +12.8/30.0
- Appreciation +10.0/10.0
- ARV discount +7.5/15.0
- DSCR +3.8/10.0
- 1% rule +3.6/10.0
- Schools +3.1/10.0
- Livability +3.1/5.0
- Rent growth +2.5/5.0
- Condition / age +2.5/5.0
$290,900
🖨 Deal sheet (PDF) 📄 Offer letter ✓ Due diligence
Key facts
- 2 parking spots
- Listed 436 days
Property features AI
Finance
- Financial info: List price $290,900
Exterior
- Parking: 2 parking spaces
- Home design: Plan: The Paso Fino; New construction plan
- Exterior features: Asphalt roof
Interior
- Bedrooms: 3 bedrooms
- Bathrooms: 2 full bathrooms
- Heating & cooling: Electric forced-air heating; Central air conditioning
- Interior features: Living area approximately 1282
Neighborhood map
What this means for you Summary
Snapshot
- This is a 3-bed/2.0-bath single-family listed at $291k.
Deal economics
- At list price, monthly cash flow is $-23 ($-278/yr) — negative.
- To cash-flow at today's rent, offer at most $259k (10.8% below list).
- To meet the 1% rule (rent ≥ 1% of price), the offer needs to be $227k (22.0% below list).
- Recommended offer: $227k (22.0% below list) — sets the bar for 1% rule.
- Cap rate 6.2% vs local median 5.1% in Port LaBelle — meaningfully above typical; check what's discounted (condition, days-on-market, listing class) to confirm the premium yield is real.
Location & tenants
- Location reads 62/100 on livability (#750 in FL) — a middle-class / working-renter tenant base. Strengths: cost of living A+, housing A+; Watch: amenities F, commute F, employment F.
- Hendry (town): math 35% / reading 40% proficiency, ranked #65 of 73 in FL (top 89%) — families likely to look elsewhere, expect single-tenant / working-renter base with shorter leases; 75% free/reduced lunch — lower-income household profile, screen leases tightly.
- Zoned schools: Country Oaks Elementary School (math 48% / reading 45%, grade D-, #1,223 of 2,144 statewide, top 57%, 893 students, 75% FRL); Labelle Middle School (math 37% / reading 38%, grade F, #395 of 571 statewide, top 70%, 817 students, 72% FRL); Labelle High School (math 42% / reading 41%, grade F, #284 of 667 statewide, top 43%, 1,451 students, 62% FRL).
- Market conditions: 950 active listings in the ZIP; 8 comparable units currently listed for rent nearby; rentals at typical pace (median 22d on market — plan ~3-4 weeks tenant-placement turnaround); 557 units permitted in Hendry County in 2024 (45 in 5+ unit buildings).
- At $2,270/mo this rent would consume 48% of the median local household income ($57k/yr) (locally 498% of renters already pay >50% of income on rent) — very limited rent-growth headroom before tenants either downsize or default.
Forward outlook
- In year one you build about $28k of equity ($2k loan paydown + $26k appreciation (10.0% local appreciation)).
- Hendry County population projected to shrink 7% by 2050 — rents likely to lag national; underwrite the cash flow, not the appreciation.
- At projected returns (10.0% appreciation + 3.0% rent growth), your $74k cash investment doubles in ~3 years — after that, you're playing with house money.
- By year 2, paydown + projected appreciation supports a ~$45k cash-out refi (75% LTV) — recoverable capital for the next deal without selling this one.
Negotiation context
- It's been on market 436 days — a 12% lower offer ($256k) is reasonable based on typical stale-listing flexibility.
Questions for the listing agent
- What do current leases actually rent for vs. the listed asking? Can we see a recent rent roll and the last 12 months of T-12 income?
- It's been on market 436 days. Have you received any prior offers? Is the seller open to a 22% concession, seller financing, or rate buy-down credit?
- Why hasn't it sold? Are there any deal-killer items the seller is aware of (foundation, flood, title, zoning, code violations)?
- Is there a deadline driving the sale (1031 exchange, divorce, estate, relocation)? That informs how much negotiation room exists.
- Schools are F-rated, which usually means shorter tenancies and higher turnover. Who's the typical renter profile here, and what's been the actual vacancy rate?
- The area grade is low — what's the realistic commute time and amenity access for the typical tenant pool here? Any planned neighborhood developments (good or bad) we should know about?
- What's the average days-on-market for RENTAL listings here right now (not sales)? A rising rental-DOM trend means longer vacancies and softer asking-rent achievability than the comps imply.
- What's the recent tenant-quality profile in this submarket — average credit score on applications, eviction rate, late-payment / NSF rate, and stable-employment percentage? A property-management company in the area should have these aggregated.
- How much new for-sale + rental construction is in the pipeline within 1–3 miles? Heavy new supply typically softens prices + rents 12–24 months out; constrained supply supports both.
Investment metrics
- 1% rule
- 0.86% ✗
- Cap rate
- 6.19%
- Cash-on-cash
- -0.38%
- DSCR
- 0.98
- GRM
- 9.6
CMA / ARV
- ARV (on-the-fly)
- $262,810
- Comps found
- 5
Show comp detail 5 sales within ~0.75 mi
| Address | Dist | Beds/Ba | Sqft | Sold | Price | $/sf | Match |
|---|---|---|---|---|---|---|---|
| 4544 Springview Cir | 0.37mi | 2/2.0 (-1) | 1,344 (+5%) | 9mo | $215,000 | $160 | 62 |
| 1100 River Run | 0.42mi | 2/2.0 (-1) | 1,337 (+4%) | 14mo | $225,000 | $168 | 56 |
| 6008 S Moss Cir | 0.73mi | 3/2.0 | 1,220 (-5%) | 13mo | $309,900 | $254 | 47 |
| 4550 Springview Cir | 0.33mi | 4/3.0 (+1) | 1,412 (+10%) | 24mo | $289,000 | $205 | 39 |
| 6008 Petal Ct | 0.65mi | 3/2.0 | 1,408 (+10%) | 20mo | $300,900 | $214 | 36 |
Match score weights: distance 35% · size 25% · config 20% · recency 20%. Top-matched comps best support the ARV.
Projected returns pro-forma
10.0% appreciation · 3.0% rent growth · sell at horizon
- IRR
- 24.0%
- Equity multiple
- 2.93×
- Total profit
- $141,691
- Equity at exit
- $236,760
- IRR
- 21.3%
- Equity multiple
- 6.69×
- Total profit
- $418,485
- Equity at exit
- $510,582
Cash invested: $73,587 (down + closing). Projections, not guarantees.
Landlord ↔ Tenant lean methodology
- Overall (STATE)
- 87 Strongly Landlord-Friendly
- State Florida
- 87 Strongly Landlord-Friendly · R+3
- County
- — inherits STATE
- City
- — inherits STATE
ZIP-level market 33935
- Home prices YoY
- 16.3%
- Active inventory
- 950
- Price-to-rent
- 10.7×
Monthly cashflow live
- Estimated rent
- $2,270 high interval (Pro) →
- Mortgage (P&I)
- −$1,378
- Tax est. 1.5%
- −$329 /mo · $3,942/yr
- Insurance
- −$110
- HOA
- −$0
- Vacancy / Maint / Mgmt
- −$477
- Net cashflow
- $-23
Break-even live
Sensitivity live
| Price | -10% $158 | -5% $68 | +0% $-23 | +5% $-114 | +10% $-205 |
|---|---|---|---|---|---|
| Rent | -10% $-202 | -5% $-113 | +0% $-23 | +5% $66 | +10% $156 |
| Rate | -1.0pp $109 | -0.5pp $44 | base $-23 | +0.5pp $-91 | +1.0pp $-161 |
UW: 25.0% down · 7.5% · 30yr · 1.5% tax · 5.0% vac · 8.0% maint · 8.0% mgmt
Financing live
Cash to close
- Down payment
- $65,702
- Closing costs
- $7,884
- Reserves months
- —
- Total cash needed
- —
Loan-product check · same deal, 3 products live
Conventional
25% down · 7.5% · 30yr
- Down + closing
- —
- Monthly P&I
- —
- Monthly cashflow
- —
- DSCR
- —
- Eligible?
- —
Personal DTI + credit; lowest rate.
DSCR
20% down · 8.5% · 30yr
- Down + closing
- —
- Monthly P&I
- —
- Monthly cashflow
- —
- DSCR
- —
- Eligible?
- —
No personal income docs; deal must DSCR.
Hard money
10% down · 12.0% · 12mo
- Down + closing
- —
- Monthly P&I
- —
- Monthly cashflow
- —
- DSCR
- —
- Eligible?
- —
Short-term bridge; refi at stabilization.
Rent comps 8 comps
| Address | Beds | Baths | Sqft | Rent | $/sqft | DOM | Units | Dist |
|---|---|---|---|---|---|---|---|---|
| 6018 Acorn Cir Labelle, FL | 3.0 | 2.0 | 1408 | $2,200 | $1.56 | 18d | 1 | 0.44mi |
| 6210 Forest Ct Labelle, FL | 3.0 | 2.5 | 1503 | $2,200 | $1.46 | 25d | 1 | 0.91mi |
| 8030 Olive Cir Labelle, FL | 4.0 | 2.0 | 1499 | $2,300 | $1.53 | 5d | 1 | 1.28mi |
| 7016 Palpano Cir Labelle, FL | 3.0 | 2.5 | 1507 | $2,100 | $1.39 | 18d | 1 | 1.28mi |
| 8004 Spice Ct Labelle, FL | 3.0 | 2.0 | 1292 | $2,000 | $1.55 | 21d | 1 | 1.36mi |
| 8049 Memory Cir Labelle, FL | 4.0 | 2.0 | 1686 | $2,000 | $1.19 | 5d | 1 | 1.40mi |
| 7061 Tide Cir Labelle, FL | 4.0 | 2.0 | 1500 | $1,695 | $1.13 | 25d | 1 | 1.42mi |
| 1064 Calumet Rd Labelle, FL | 3.0 | 2.5 | 1503 | $2,200 | $1.46 | 25d | 1 | 1.49mi |
Listing history 14 events
-
2026-06-22days on market $290,900 Active 436 DOM
-
2026-06-18days on market $290,900 Active 433 DOM
-
2026-06-17days on market $290,900 Active 432 DOM
-
2026-06-16days on market $290,900 Active 431 DOM
-
2026-06-15days on market $290,900 Active 430 DOM
-
2026-06-13days on market $290,900 Active 427 DOM
-
2026-06-10days on market $290,900 Active 425 DOM
-
2026-06-09days on market $290,900 Active 424 DOM
-
2026-06-08days on market $290,900 Active 423 DOM
-
2026-06-07days on market $290,900 Active 422 DOM
-
2026-06-03days on market $290,900 Active 418 DOM
-
2026-06-02days on market $290,900 Active 417 DOM
-
2026-06-01days on market $290,900 Active 416 DOM
-
2026-05-31days on market $290,900 Active 415 DOM
ⓘ Source: listings_history table (triggers on properties + properties_extension) + one-shot
backfill from property_details.listing_events for pre-trigger history.
Nearby sold comps map
Loading sold comps map…
Walkable amenities ~0.75 mi
Loading nearby amenities…
Taxation est. · year 1
- Rental income
- $27,236
- − Mortgage interest
- −$14,721
- − Property taxes
- −$3,942
- − Insurance
- −$1,314
- − Repairs & maintenance
- −$2,179
- − Management
- −$2,179
- − Depreciation
- −$7,645
- Taxable loss
- −$4,745
- Est. tax savings @ 24.0%
- +$1,139
- After-tax cash flow
- $860/yr
For passive investors: Depreciation is non-cash, so a rental often shows a tax loss while cash-flowing — sheltering income. Rental losses are passive: they offset passive income freely, and up to $25,000/yr can offset ordinary (W-2) income if you actively participate and your MAGI is under $100k (phasing out to $0 by $150k); unused losses carry forward. On sale, claimed depreciation is recaptured at up to 25%, and gains may owe capital-gains tax (a 1031 exchange can defer both). Figures are a year-1 estimate at your 24.0% rate — not tax advice; consult a CPA.
Schools (NCES district)
- District
- Hendry
- NCES district ID
- 1200780
- Math proficiency
- 35% ▼ -11.00%
- Reading proficiency
- 40% ▼ -4.00%
- Median HH income
- $37,043
- Composite
- 31.16/100
- National rank
- #6054
- State rank
- #65 of 73 in FL
Livability — Port LaBelle
- Score
- 62/100
- State rank
- #750
- US rank
- #16264
Category grades
Schools grade is shown separately in the Schools card above.
Census & demographics
- Census place
- Port LaBelle, FL
- County
- Hendry County · 23,186 people
- Metro
- Clewiston, FL
- Population (ZIP)
- 23,186
- Household income
- $57,009
- Rent vs Own
- Severe rent burden
- 498.0
Population outlook (Hendry County) Hauer SSP2
- Today (2025)
- 38,866 people
- By 2030
- 38,558 · -0.8%
- By 2040
- 37,743 · -2.9%
- By 2050
- 36,117 · -7.1%
- By 2075
- 30,070 · -22.6%
- By 2100
- 21,966 · -43.5%
Race, ethnicity, and origin ACS 2023
- Neighborhood character
- Majority Hispanic (56%)
- Race & ethnicity
- Hispanic / Latino 56% White 39% Two or more races 21% Black 2% Native American 2%
- Hispanic origin (detail)
- Mexican 40% Puerto Rican 3% Cuban 5%
- Common ancestry
- Lithuanian 2% Serbian 2% Slovak 1%
- Foreign-born
- 27% · Canada, Jamaica
- Languages at home
- 50% English-only · Spanish 50%
Political lean MEDSL · Hendry
- 2024 margin
- Solid R (+38.3) · D 30.4% · R 68.7%
- 2008→2024 swing
- -31.1pp toward R · 2008: -7.2pp · 2024: -38.3pp
- All cycles
- 2024: R+38.3 2020: R+23.0 2016: R+14.2 2012: R+5.9 2008: R+7.2
Not yet ingested
- Civics
- —
Market trends
- HPI YoY
- ▲ 75.20%
- Current HPI
- 537.4928
- Rent YoY
- —
- Metro
- Clewiston, FL
- State GDP YoY
- ▲ 3.28%
- F500 in state
- 36
Industry mix (Fortune 500 HQ in FL)
| Industry | F500 HQs | Revenue |
|---|---|---|
| Industrial Technology | 2 | $29B |
|
||
| Insurance | 2 | $17B |
|
||
| Retail | 1 | $60B |
|
||
| Technology Distribution | 1 | $58B |
|
||
| Homebuilding | 1 | $35B |
|
||
| Technology Manufacturing | 1 | $35B |
|
||
Cash-flow waterfall
monthlySold comps — $/sqft
last 12 mo · ≤1 miLoading sold comps…