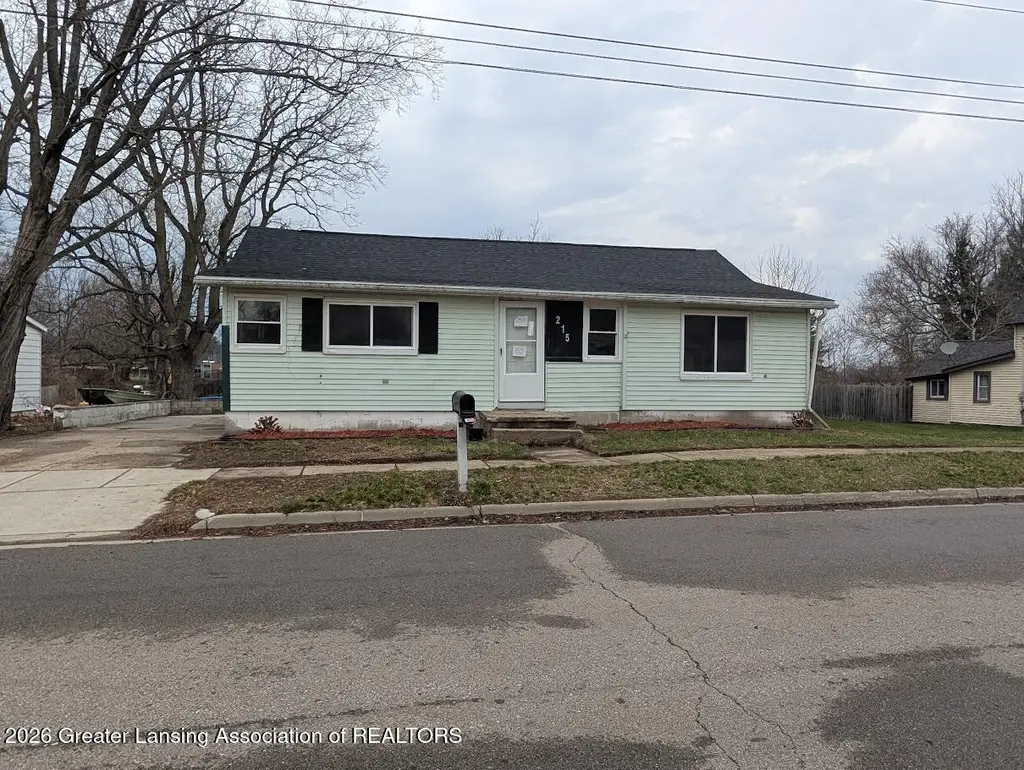
215 E 2nd North St · Laingsburg, MI
Flood risk 1/10 · Minimal
- FEMA flood zone
- X (unshaded)
- Chance of flooding over 30 yrs
- 0.0%
- Est. flood insurance / yr
- $507 – $1,088
Fire risk 1/10 · Minimal
- Est. fire insurance / yr
- $784 – $1,456
Heat risk 2/10 · Minimal
- Hot days now (above 97°F)
- 7 days/yr
- Hot days in 30 yrs
- 15 days/yr
Wind risk 2/10 · Minimal
- Chance of severe wind over 30 yrs
- —
Air-quality risk 2/10 · Minimal
- Unhealthy air days now
- 1 days/yr
- Unhealthy air days in 30 yrs
- 2 days/yr
Risk factors via First Street. Map © Google.
Why this score? — see what drove the C- grade
The composite is a weighted blend of 9 inputs, each scored 0–100. Each bar is that input's sub-score; the figure is the points it added to the 100-point composite (weight × sub-score).
- Cash flow +15.1/30.0
- ARV discount +15.0/15.0
- DSCR +4.6/10.0
- 1% rule +4.0/10.0
- Schools +3.9/10.0
- Livability +3.7/5.0
- Rent growth +2.5/5.0
- Condition / age +2.5/5.0
- Appreciation +0.0/10.0
$99,900
🖨 Deal sheet (PDF) 📄 Offer letter ✓ Due diligence
Listing remarks MLS
This property is listed ''AS IS''. There may be unpermitted modifications. This property is eligible under the Freddie Mac First Look Initiative through 05/14/2026. See HomeSteps.com for more information on FMFL. PLEASE SUBMIT A COMPLETED OFFER SUBMISSION CHECKLIST (ATTACHED) W/ OFFER. Sold as-is . NO OFFERS CONTINGENT ON SALE OF ANOTHER PROPERTY. NO DISCLOSURES. Seller will pay for owner's policy of title insurance w/ standard exceptions. Offers are subject to the bank addendum. SeeDB. www. homesteps.com.
Key facts
- 0.33 acre lot
- Built 1930
- Listed 67 days
Property features AI
Exterior
- Parking: Driveway parking; No attached garage
- Utilities: Public sewer
- Home design: One-level home; Built in 1930
- Construction: Vinyl siding
- Exterior features: Lot approximately 0.33 acres (90 x 148)
Interior
- Kitchen: Kitchen approximately 15.5 x 12.5
- Bedrooms: 3 bedrooms total; Primary bedroom approximately 9.8 x 8.3; Second bedroom approximately 16.6 x 9.1; Third bedroom approximately 13.3 x 9.1
- Bathrooms: 1 full bathroom
- Heating & cooling: Forced air heating; No central cooling
- Interior features: Full basement; Dining room open to another room (combo)
- Laundry & utility: Laundry area on lower level
Neighborhood map
What this means for you Summary
Snapshot
- This is a 3-bed/1.0-bath single-family listed at $100k.
Deal economics
- At list price, monthly cash flow is $33 ($391/yr) — positive.
- The deal already cash-flows at list — no discount required.
- To meet the 1% rule (rent ≥ 1% of price), the offer needs to be $90k (9.9% below list).
- Recommended offer: $90k (9.9% below list) — sets the bar for 1% rule.
Location & tenants
- Location reads 73/100 on livability (#198 in MI) — a middle-class / working-renter tenant base. Strengths: crime A+, cost of living A+, housing A+; Watch: amenities F, commute F, health & safety D-.
- Laingsburg Community Schools (rural): math 32% / reading 55% proficiency, ranked #143 of 540 in MI (top 26%) — families likely to look elsewhere, expect single-tenant / working-renter base with shorter leases.
- Zoned schools: Laingsburg Elementary School (math 39% / reading 52%, grade D-, #478 of 1,397 statewide, top 34%, 511 students, 33% FRL); Laingsburg Middle School (math 24% / reading 50%, grade F, #248 of 493 statewide, top 53%, 265 students, 34% FRL); Laingsburg High School (math 37% / reading 77%, grade C, #99 of 713 statewide, top 14%, 363 students, 26% FRL).
- Market conditions: 42 active listings in the ZIP; 1 comparable units currently listed for rent nearby; 74 units permitted in Shiawassee County in 2024 (0 in 5+ unit buildings).
Forward outlook
- Local home prices are declining (-3.0%/yr); year-one equity from $691 of loan paydown is wiped out by about $3k of value loss. Plan a longer hold.
- Shiawassee County population projected at -25% by 2050 — secular population decline; favor cash flow + early exit over multi-decade hold.
Negotiation context
- It's been on market 67 days — a 6% lower offer ($94k) is reasonable based on typical stale-listing flexibility.
- 4 sale attempts; this cycle's ask has dropped $20k (17%) from the opening price — seller is motivated, your offer sets the floor, not the list.
- Current owner paid $79k; 26% above their basis — modest negotiation headroom, anchor on the comps not their cost.
Risks & watch-outs
- Watch-outs: built in 1930 — expect roof / HVAC / electrical / plumbing capex.
Questions for the listing agent
- It's been on market 67 days. Have you received any prior offers? Is the seller open to a 10% concession, seller financing, or rate buy-down credit?
- Built in 1930 — when were the roof, HVAC, electrical panel, plumbing, and water heater last replaced?
- Why hasn't it sold? Are there any deal-killer items the seller is aware of (foundation, flood, title, zoning, code violations)?
- Is there a deadline driving the sale (1031 exchange, divorce, estate, relocation)? That informs how much negotiation room exists.
- Schools are B-rated — typically a magnet for longer-tenancy family renters. What's the average tenant stay here, and is there a school-zone premium baked into asking?
- What's the average days-on-market for RENTAL listings here right now (not sales)? A rising rental-DOM trend means longer vacancies and softer asking-rent achievability than the comps imply.
- What's the recent tenant-quality profile in this submarket — average credit score on applications, eviction rate, late-payment / NSF rate, and stable-employment percentage? A property-management company in the area should have these aggregated.
- How much new for-sale + rental construction is in the pipeline within 1–3 miles? Heavy new supply typically softens prices + rents 12–24 months out; constrained supply supports both.
Investment metrics
- 1% rule
- 0.90% ✗
- Cap rate
- 6.68%
- Cash-on-cash
- 1.40%
- DSCR
- 1.06
- GRM
- 9.2
CMA / ARV
- ARV (on-the-fly)
- $140,275
- Comps found
- 5
Show comp detail 5 sales within ~0.75 mi
| Address | Dist | Beds/Ba | Sqft | Sold | Price | $/sf | Match |
|---|---|---|---|---|---|---|---|
| 780 N West St | 0.44mi | 2/1.0 (-1) | 956 (+6%) | 7mo | $192,500 | $201 | 60 |
| 106 Phelps St | 0.25mi | 2/1.0 (-1) | 1,034 (+14%) | 6mo | $160,000 | $155 | 54 |
| 624 E Grand River Rd | 0.60mi | 2/1.0 (-1) | 905 (0%) | 17mo | $105,000 | $116 | 53 |
| 224 S Laing St | 0.29mi | 2/1.0 (-1) | 1,040 (+15%) | 12mo | $156,000 | $150 | 46 |
| 605 Mcclintock St | 0.45mi | 3/1.0 | 1,040 (+15%) | 19mo | $202,500 | $195 | 38 |
Match score weights: distance 35% · size 25% · config 20% · recency 20%. Top-matched comps best support the ARV.
Projected returns pro-forma
-3.0% appreciation · 3.0% rent growth · sell at horizon
- IRR
- -14.1%
- Equity multiple
- 0.50×
- Total profit
- $-14,109
- Equity at exit
- $14,895
- IRR
- -5.3%
- Equity multiple
- 0.66×
- Total profit
- $-9,591
- Equity at exit
- $8,638
Cash invested: $27,972 (down + closing). Projections, not guarantees.
Landlord ↔ Tenant lean methodology
- Overall (STATE)
- 62 Landlord-Friendly
- State Michigan
- 62 Landlord-Friendly · EVEN
- County
- — inherits STATE
- City
- — inherits STATE
ZIP-level market 48848
- Active inventory
- 42
- Price-to-rent
- 9.2×
Monthly cashflow live
- Estimated rent
- $900 medium interval (Pro) →
- Mortgage (P&I)
- −$524
- Tax from tax record
- −$113 /mo · $1,355/yr
- Insurance
- −$42
- HOA
- −$0
- Vacancy / Maint / Mgmt
- −$189
- Net cashflow
- $33
Break-even live
Sensitivity live
| Price | -10% $89 | -5% $61 | +0% $33 | +5% $4 | +10% $-24 |
|---|---|---|---|---|---|
| Rent | -10% $-39 | -5% $-3 | +0% $33 | +5% $68 | +10% $104 |
| Rate | -1.0pp $83 | -0.5pp $58 | base $33 | +0.5pp $7 | +1.0pp $-20 |
UW: 25.0% down · 7.5% · 30yr · 1.5% tax · 5.0% vac · 8.0% maint · 8.0% mgmt
Financing live
Cash to close
- Down payment
- $24,975
- Closing costs
- $2,997
- Reserves months
- —
- Total cash needed
- —
Loan-product check · same deal, 3 products live
Conventional
25% down · 7.5% · 30yr
- Down + closing
- —
- Monthly P&I
- —
- Monthly cashflow
- —
- DSCR
- —
- Eligible?
- —
Personal DTI + credit; lowest rate.
DSCR
20% down · 8.5% · 30yr
- Down + closing
- —
- Monthly P&I
- —
- Monthly cashflow
- —
- DSCR
- —
- Eligible?
- —
No personal income docs; deal must DSCR.
Hard money
10% down · 12.0% · 12mo
- Down + closing
- —
- Monthly P&I
- —
- Monthly cashflow
- —
- DSCR
- —
- Eligible?
- —
Short-term bridge; refi at stabilization.
Rent comps 1 comps
| Address | Beds | Baths | Sqft | Rent | $/sqft | DOM | Units | Dist |
|---|---|---|---|---|---|---|---|---|
| 360 Prospect St Laingsburg, MI | 2.0 | 1.0 | 725 | $900 | $1.24 | 15d | 1 | 0.13mi |
Listing history 26 events
-
2026-06-21days on market $99,900 Active 67 DOM
-
2026-06-18days on market $99,900 Active 64 DOM
-
2026-06-17days on market $99,900 Active 63 DOM
-
2026-06-16days on market $99,900 Active 62 DOM
-
2026-06-15days on market $99,900 Active 61 DOM
-
2026-06-14days on market $99,900 Active 59 DOM
-
2026-06-13days on market $99,900 Active 58 DOM
-
2026-06-10days on market $99,900 Active 56 DOM
-
2026-06-09days on market $99,900 Active 55 DOM
-
2026-06-08days on market $99,900 Active 54 DOM
-
2026-06-07days on market $99,900 Active 53 DOM
-
2026-06-05days on market $99,900 Active 50 DOM
-
2026-06-03days on market $99,900 Active 49 DOM
-
2026-06-02pricedays on market $99,900 Active 48 DOM
-
2026-06-01days on market $119,900 Active 47 DOM
-
2026-05-31days on market $119,900 Active 46 DOM
-
2026-05-30days on market $119,900 Active 45 DOM
-
2026-04-15$119,900 Active 511-char remark
Show marketing remark (511 chars)
This property is listed ''AS IS''. There may be unpermitted modifications. This property is eligible under the Freddie Mac First Look Initiative through 05/14/2026. See HomeSteps.com for more information on FMFL. PLEASE SUBMIT A COMPLETED OFFER SUBMISSION CHECKLIST (ATTACHED) W/ OFFER. Sold as-is . NO OFFERS CONTINGENT ON SALE OF ANOTHER PROPERTY. NO DISCLOSURES. Seller will pay for owner's policy of title insurance w/ standard exceptions. Offers are subject to the bank addendum. SeeDB. www. homesteps.com.
-
2026-04-15$119,900 Active
Show marketing remark (511 chars)
This property is listed ''AS IS''. There may be unpermitted modifications. This property is eligible under the Freddie Mac First Look Initiative through 05/14/2026. See HomeSteps.com for more information on FMFL. PLEASE SUBMIT A COMPLETED OFFER SUBMISSION CHECKLIST (ATTACHED) W/ OFFER. Sold as-is . NO OFFERS CONTINGENT ON SALE OF ANOTHER PROPERTY. NO DISCLOSURES. Seller will pay for owner's policy of title insurance w/ standard exceptions. Offers are subject to the bank addendum. SeeDB. www. homesteps.com.
-
2025-05-20historical
-
2025-05-20historical
-
2025-03-11price $114,500
-
2025-03-10price $114,500
-
2025-01-30$115,000 Active
-
2025-01-30$115,000 Active
-
2005-06-10soldstatus $79,460
ⓘ Source: listings_history table (triggers on properties + properties_extension) + one-shot
backfill from property_details.listing_events for pre-trigger history.
Tax reassessment forecast MI · Partial reset (capped growth)
- Current annual tax
- $1,355 · $113/mo
- Projected year-2 tax
- $1,447 · $121/mo
- Expected delta
- +$92/yr (+$8/mo · 6.8%)
ⓘ Screening estimate from a state-policy table — verify with the county assessor before closing.
Climate risk First Street
- Flood 1/10 Low FEMA zone X (unshaded) · 0% chance over 30 yrs
- Wildfire 1/10 Low
- Heat 2/10 Low 7 d/yr ≥97°F today · 15 d/yr by 30 yrs out
- Wind 2/10 Low
- Air quality 2/10 Low 1 unhealthy d/yr today · 2 by 30 yrs out
Nearby sold comps map
Loading sold comps map…
Walkable amenities ~0.75 mi
Loading nearby amenities…
Taxation est. · year 1
- Rental income
- $10,800
- − Mortgage interest
- −$5,596
- − Property taxes
- −$1,355
- − Insurance
- −$500
- − Repairs & maintenance
- −$864
- − Management
- −$864
- − Depreciation
- −$2,906
- Taxable loss
- −$1,285
- Est. tax savings @ 24.0%
- +$308
- After-tax cash flow
- $699/yr
For passive investors: Depreciation is non-cash, so a rental often shows a tax loss while cash-flowing — sheltering income. Rental losses are passive: they offset passive income freely, and up to $25,000/yr can offset ordinary (W-2) income if you actively participate and your MAGI is under $100k (phasing out to $0 by $150k); unused losses carry forward. On sale, claimed depreciation is recaptured at up to 25%, and gains may owe capital-gains tax (a 1031 exchange can defer both). Figures are a year-1 estimate at your 24.0% rate — not tax advice; consult a CPA.
Schools (NCES district)
- District
- Laingsburg Community Schools
- NCES district ID
- 2620550
- Math proficiency
- 32% ▼ -12.00%
- Reading proficiency
- 55% ▼ -3.00%
- Median HH income
- $64,753
- Composite
- 38.71/100
- National rank
- #4137
- State rank
- #143 of 540 in MI
Livability — Laingsburg
- Score
- 73/100
- State rank
- #198
- US rank
- #5031
Category grades
Schools grade is shown separately in the Schools card above.
Census & demographics
- Census place
- Laingsburg, MI
- City population
- 7,795
- Population (ZIP)
- 7,795
Population outlook (Shiawassee County) Hauer SSP2
- Today (2025)
- 64,238 people
- By 2030
- 61,434 · -4.4%
- By 2040
- 55,054 · -14.3%
- By 2050
- 48,426 · -24.6%
- By 2075
- 35,995 · -44.0%
- By 2100
- 26,678 · -58.5%
Race, ethnicity, and origin ACS 2023
- Neighborhood character
- Predominantly White (94%)
- Race & ethnicity
- White 94% Two or more races 3% Hispanic / Latino 2%
- Common ancestry
- Romanian 5% Lithuanian 3% Slovak 3%
- Foreign-born
- 1% · Canada
Political lean MEDSL · Shiawassee
- 2024 margin
- Strong R (+23.1) · D 37.7% · R 60.8% · Other 1.6%
- 2008→2024 swing
- -31.7pp toward R · 2008: 8.6pp · 2024: -23.1pp
- All cycles
- 2024: R+23.1 2020: R+19.9 2016: R+19.6 2012: D+3.7 2008: D+8.6
Not yet ingested
- Civics
- —
Market trends
- HPI YoY
- ▼ -133.85%
- Current HPI
- 229.5834
- Rent YoY
- —
- Metro
- —
- State GDP YoY
- ▲ 1.37%
- F500 in state
- 28
Industry mix (Fortune 500 HQ in MI)
| Industry | F500 HQs | Revenue |
|---|---|---|
| Automotive Parts | 3 | $48B |
|
||
| Automotive | 2 | $372B |
|
||
| Chemicals | 1 | $45B |
|
||
| Automotive Retail | 1 | $29B |
|
||
| Healthcare / Medical Devices | 1 | $23B |
|
||
| Automotive Technology | 1 | $20B |
|
||
Price history
+50.9% since first listed9 events — show timeline
- 2026-04-15 Listed $119,900 REALCOMP
- 2026-04-15 Listed $119,900 Greater Lansing AoR
- 2025-05-20 Listing Removed — MiRealSource-MiMLS
- 2025-05-20 Listing Removed — REALCOMP
- 2025-03-11 Price Changed $114,500 MiRealSource-MiMLS
- 2025-03-10 Price Changed $114,500 REALCOMP
- 2025-01-30 Listed $115,000 MiRealSource-MiMLS
- 2025-01-30 Listed $115,000 REALCOMP
- 2005-06-10 Sold (Public Records) $79,460 Public Records
Property tax history
-5.9%/yrLatest (2025): $1,355 · -50.8% YoY. Source: county tax records.
Cash-flow waterfall
monthlySold comps — $/sqft
last 12 mo · ≤1 miLoading sold comps…