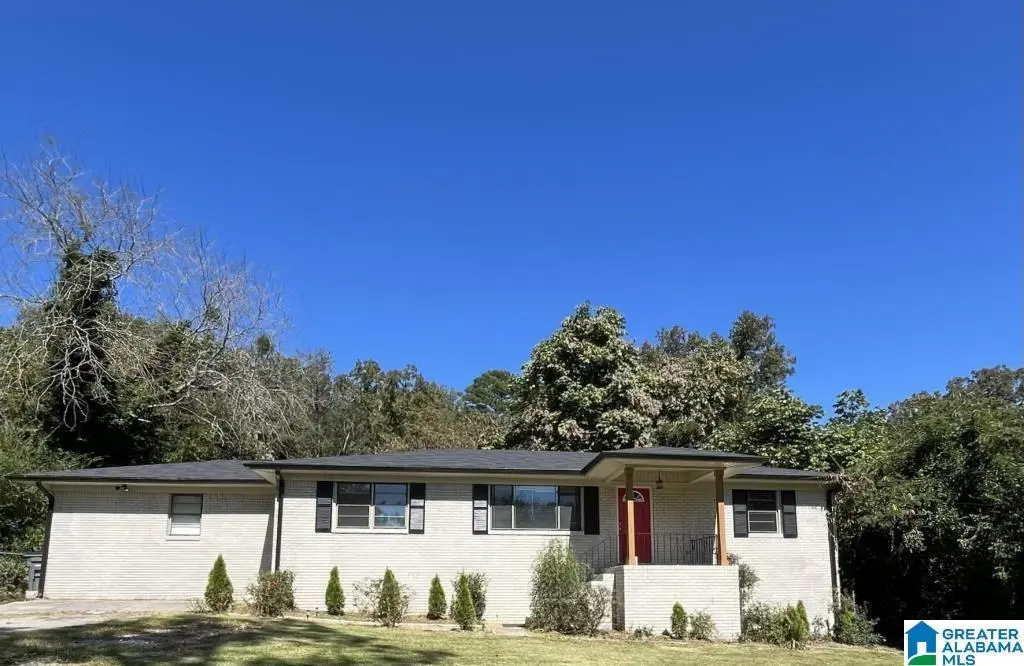
310 White Pine St · Trussville, AL
Flood risk 1/10 · Minimal
- FEMA flood zone
- X (unshaded)
- Chance of flooding over 30 yrs
- 0.0%
- Est. flood insurance / yr
- $473 – $860
Fire risk 4/10 · Minor
- Est. fire insurance / yr
- $916 – $1,700
Heat risk 5/10 · Moderate
- Hot days now (above 106°F)
- 7 days/yr
- Hot days in 30 yrs
- 19 days/yr
Wind risk 6/10 · Moderate
- Chance of severe wind over 30 yrs
- 27.0%
Air-quality risk 4/10 · Minor
- Unhealthy air days now
- 6 days/yr
- Unhealthy air days in 30 yrs
- 7 days/yr
Risk factors via First Street. Map © Google.
Why this score? — see what drove the C grade
The composite is a weighted blend of 9 inputs, each scored 0–100. Each bar is that input's sub-score; the figure is the points it added to the 100-point composite (weight × sub-score).
- Cash flow +17.5/30.0
- ARV discount +15.0/15.0
- DSCR +5.5/10.0
- Schools +5.5/10.0
- 1% rule +4.4/10.0
- Livability +4.0/5.0
- Rent growth +2.5/5.0
- Condition / age +2.5/5.0
- Appreciation +0.0/10.0
$275,000
🖨 Deal sheet 📄 Offer letter ✓ Due diligence
Listing remarks MLS
Investor opportunity at 310 White Pine St with resident who wishes to remain in the property, making this a turnkey, income producing investment property. Owner has a real estate license in AL.
Key facts
- 0.73 acre lot
- Built 1957
- Listed 182 days
Neighborhood map
What this means for you Summary
Snapshot
- This is a 3-bed/1.0-bath single-family listed at $275k.
Deal economics
- At list price, monthly cash flow is $210 ($3k/yr) — positive.
- The deal already cash-flows at list — no discount required.
- To meet the 1% rule (rent ≥ 1% of price), the offer needs to be $259k (5.8% below list).
- Recommended offer: $242k (12.0% below list) — sets the bar for market timing.
- Cap rate 7.2% vs local median 3.4% in Trussville — top-decile yield for the area; either an underpriced asset or a hidden risk that comps aren't pricing in. Stress-test before assuming the spread holds.
Location & tenants
- Location reads 79/100 on livability (#7 in AL, #2,110 nationally) — a middle-class / working-renter tenant base. Strengths: employment A+, housing A+, schools A; Watch: commute F.
- Trussville City (suburban): math 49% / reading 74% proficiency, ranked #5 of 129 in AL (top 4%) — acceptable for families but not a draw, mixed tenant base, ~2y average lease; only 7% free/reduced lunch — higher-income household profile.
- Market conditions: 344 active listings in the ZIP; 10 comparable units currently listed for rent nearby; rentals lingering (median 44d on market — plan ~5-8 weeks vacancy on turnover, expect pricing pressure); 50% of comp listings sitting > 30 days — soft ceiling on asking rent; 2,114 units permitted in Jefferson County in 2024 (556 in 5+ unit buildings).
Forward outlook
- Local home prices are declining (-3.0%/yr); year-one equity from $2k of loan paydown is wiped out by about $8k of value loss. Plan a longer hold.
- Jefferson County population projected to shrink 4% by 2050 — rents likely to lag national; underwrite the cash flow, not the appreciation.
Negotiation context
- It's been on market 183 days — a 12% lower offer ($242k) is reasonable based on typical stale-listing flexibility.
- 4 sale attempts since 4y ago; this cycle's ask has dropped $15k (5%) from the opening price — seller is motivated, your offer sets the floor, not the list.
- Current owner paid $177k; list at $275k implies a 55% gain — meaningful room to come down on a strong offer.
Risks & watch-outs
- Watch-outs: built in 1957 — expect roof / HVAC / electrical / plumbing capex.
- Climate carrying-cost: major wind risk, 27% chance of damaging wind over 30y; extreme-heat days projected 7→19/yr by 2055 (HVAC capex compounding) — expect insurance premiums to compound above CPI over the hold.
Questions for the listing agent
- It's been on market 183 days. Have you received any prior offers? Is the seller open to a 12% concession, seller financing, or rate buy-down credit?
- Built in 1957 — when were the roof, HVAC, electrical panel, plumbing, and water heater last replaced?
- Why hasn't it sold? Are there any deal-killer items the seller is aware of (foundation, flood, title, zoning, code violations)?
- Is there a deadline driving the sale (1031 exchange, divorce, estate, relocation)? That informs how much negotiation room exists.
- Schools are A-rated — typically a magnet for longer-tenancy family renters. What's the average tenant stay here, and is there a school-zone premium baked into asking?
- What's the average days-on-market for RENTAL listings here right now (not sales)? A rising rental-DOM trend means longer vacancies and softer asking-rent achievability than the comps imply.
- What's the recent tenant-quality profile in this submarket — average credit score on applications, eviction rate, late-payment / NSF rate, and stable-employment percentage? A property-management company in the area should have these aggregated.
- How much new for-sale + rental construction is in the pipeline within 1–3 miles? Heavy new supply typically softens prices + rents 12–24 months out; constrained supply supports both.
Investment metrics
- 1% rule
- 0.94% ✗
- Cap rate
- 7.21%
- Cash-on-cash
- 3.28%
- DSCR
- 1.15
- GRM
- 8.8
CMA / ARV
- ARV (median comp)
- $334,920
- List price
- $275,000
- Delta
- -17.89%
- Verdict
- UNDERPRICED
- Comps
- 20 within 1.0 mi
Show comp detail 12 sales within ~0.75 mi
| Address | Dist | Beds/Ba | Sqft | Sold | Price | $/sf | Match |
|---|---|---|---|---|---|---|---|
| 242 Dawns Way | 0.47mi | 3/2.0 | 1,890 (-0%) | 0mo | $357,000 | $189 | 74 |
| 6209 Halcyon Ter | 0.34mi | 3/2.0 | 1,828 (-3%) | 2mo | $417,000 | $228 | 73 |
| 204 Oak Dr W | 0.29mi | 3/2.0 | 2,016 (+7%) | 5mo | $300,000 | $149 | 68 |
| 207 Annetta Crk | 0.57mi | 3/2.0 | 1,908 (+1%) | 2mo | $295,000 | $155 | 66 |
| 3122 Cedarbrook Ln | 0.37mi | 3/2.5 | 1,727 (-9%) | 1mo | $315,000 | $182 | 61 |
| 308 Forest Dr | 0.18mi | 3/2.0 | 1,621 (-14%) | 5mo | $342,900 | $212 | 60 |
| 249 Dawns Way | 0.50mi | 4/2.5 (+1) | 2,011 (+6%) | 2mo | $349,000 | $174 | 54 |
| 3622 Halcyon Trce | 0.37mi | 3/2.5 | 2,085 (+10%) | 8mo | $413,000 | $198 | 53 |
| 258 Dawns Way | 0.54mi | 3/2.0 | 2,037 (+8%) | 9mo | $360,000 | $177 | 50 |
| 206 Annetta Crk | 0.64mi | 3/2.0 | 1,700 (-10%) | 6mo | $270,000 | $159 | 44 |
| 3225 Trace Cir | 0.55mi | 3/2.0 | 1,619 (-14%) | 3mo | $345,000 | $213 | 44 |
| 118 Reid Dr | 0.53mi | 3/2.0 | 2,169 (+15%) | 8mo | $328,000 | $151 | 40 |
Match score weights: distance 35% · size 25% · config 20% · recency 20%. Top-matched comps best support the ARV.
Projected returns pro-forma
-3.0% appreciation · 3.0% rent growth · sell at horizon
- IRR
- -11.1%
- Equity multiple
- 0.60×
- Total profit
- $-31,173
- Equity at exit
- $41,003
- IRR
- -1.9%
- Equity multiple
- 0.87×
- Total profit
- $-9,906
- Equity at exit
- $23,777
Cash invested: $77,000 (down + closing). Projections, not guarantees.
Landlord ↔ Tenant lean methodology
- Overall (STATE)
- 90 Strongly Landlord-Friendly
- State Alabama
- 90 Strongly Landlord-Friendly · R+15
- County
- — inherits STATE
- City
- — inherits STATE
ZIP-level market 35173
- Home prices YoY
- -33.4%
- Active inventory
- 344
- Price-to-rent
- 8.8×
Monthly cashflow live
- Estimated rent
- $2,591 high interval (Pro) →
- Mortgage (P&I)
- −$1,442
- Tax from tax record
- −$280 /mo · $3,356/yr
- Insurance
- −$115
- HOA
- −$0
- Vacancy / Maint / Mgmt
- −$544
- Net cashflow
- $210
Break-even live
UW: 25.0% down · 7.5% · 30yr · 1.5% tax · 5.0% vac · 8.0% maint · 8.0% mgmt
Financing live
Cash to close
- Down payment
- $68,750
- Closing costs
- $8,250
- Reserves months
- —
- Total cash needed
- —
Loan-product check · same deal, 3 products live
Conventional
25% down · 7.5% · 30yr
- Down + closing
- —
- Monthly P&I
- —
- Monthly cashflow
- —
- DSCR
- —
- Eligible?
- —
Personal DTI + credit; lowest rate.
DSCR
20% down · 8.5% · 30yr
- Down + closing
- —
- Monthly P&I
- —
- Monthly cashflow
- —
- DSCR
- —
- Eligible?
- —
No personal income docs; deal must DSCR.
Hard money
10% down · 12.0% · 12mo
- Down + closing
- —
- Monthly P&I
- —
- Monthly cashflow
- —
- DSCR
- —
- Eligible?
- —
Short-term bridge; refi at stabilization.
Rent comps 10 comps
| Address | Beds | Baths | Sqft | Rent | $/sqft | DOM | Units | Dist |
|---|---|---|---|---|---|---|---|---|
| 6232 Halcyon Ter Trussville, AL | 3.0 | 2.5 | 1818 | $2,700 | $1.49 | 15d | 1 | 0.31mi |
| 3509 Halcyon Way Trussville, AL | 3.0 | 2.0 | 1412 | $2,995 | $2.12 | 23d | 1 | 0.33mi |
| 3129 Cedarbrook Ln Trussville, AL | 3.0 | 2.0 | 1231 | $1,766 | $1.43 | 14d | 1 | 0.35mi |
| 6735 Roper Rd Trussville, AL | 3.0 | 2.0 | 1625 | $2,400 | $1.48 | 43d | 1 | 0.67mi |
| 160 Morrow Ave Unit 204 Trussville, AL | 3.0 | 2.0 | 1836 | $2,850 | $1.55 | 43d | 1 | 0.78mi |
| 160 Morrow Ave Unit 208 Trussville, AL | 2.0 | 2.0 | 1450 | $2,650 | $1.83 | 43d | 1 | 0.78mi |
| 165 Morrow Ave Unit 201 Trussville, AL | 2.0 | 2.0 | 1870 | $3,500 | $1.87 | 43d | 1 | 0.84mi |
| 125 Charleston Way Trussville, AL | 3.0 | 3.0 | 2181 | $2,106 | $0.97 | 14d | 1 | 1.07mi |
| 5439 Camellia Ln Trussville, AL | 4.0 | 2.5 | 2447 | $2,456 | $1.00 | 43d | 1 | 1.22mi |
| 5272 Promenade Dr Trussville, AL | 3.0 | 2.0 | 1979 | $1,895 | $0.96 | 1d | 1 | 1.44mi |
Listing history 16 events
-
2026-02-24price $275,000 193-char remark
Show marketing remark (193 chars)
Investor opportunity at 310 White Pine St with resident who wishes to remain in the property, making this a turnkey, income producing investment property. Owner has a real estate license in AL.
-
2026-02-02status Active 193-char remark
Show marketing remark (193 chars)
Investor opportunity at 310 White Pine St with resident who wishes to remain in the property, making this a turnkey, income producing investment property. Owner has a real estate license in AL.
-
2026-01-24historical Contingent 193-char remark
Show marketing remark (193 chars)
Investor opportunity at 310 White Pine St with resident who wishes to remain in the property, making this a turnkey, income producing investment property. Owner has a real estate license in AL.
-
2026-01-07status Active 193-char remark
Show marketing remark (193 chars)
Investor opportunity at 310 White Pine St with resident who wishes to remain in the property, making this a turnkey, income producing investment property. Owner has a real estate license in AL.
-
2025-12-31historical Contingent 193-char remark
Show marketing remark (193 chars)
Investor opportunity at 310 White Pine St with resident who wishes to remain in the property, making this a turnkey, income producing investment property. Owner has a real estate license in AL.
-
2025-12-30price $280,000 193-char remark
Show marketing remark (193 chars)
Investor opportunity at 310 White Pine St with resident who wishes to remain in the property, making this a turnkey, income producing investment property. Owner has a real estate license in AL.
-
2025-11-25$290,000 Active 193-char remark
Show marketing remark (193 chars)
Investor opportunity at 310 White Pine St with resident who wishes to remain in the property, making this a turnkey, income producing investment property. Owner has a real estate license in AL.
-
2023-06-13price $314,900
-
2023-05-13price $319,900
-
2022-09-13soldstatus $177,000
-
2022-09-12soldstatus $177,000 Sold
-
2022-08-13historical Contingent
-
2022-08-07historical
-
2022-07-01historical Contingent
-
2022-06-16price $199,900
-
2022-06-07$210,000 Active
ⓘ Source: listings_history table (triggers on properties + properties_extension) + one-shot
backfill from property_details.listing_events for pre-trigger history.
Tax reassessment forecast AL · Resets to sale price
- Current annual tax
- $3,356 · $280/mo
- Projected year-2 tax
- $3,356 · $280/mo
- Expected delta
- $0/yr ($0/mo · 0.0%)
ⓘ Screening estimate from a state-policy table — verify with the county assessor before closing.
Climate risk First Street
- Flood 1/10 Low FEMA zone X (unshaded) · 0% chance over 30 yrs
- Wildfire 4/10 Moderate
- Heat 5/10 Major 7 d/yr ≥106°F today · 19 d/yr by 30 yrs out
- Wind 6/10 Major 27% chance of damaging wind over 30 yrs
- Air quality 4/10 Moderate 6 unhealthy d/yr today · 7 by 30 yrs out
Nearby sold comps map
Loading sold comps map…
Walkable amenities ~0.75 mi
Loading nearby amenities…
Taxation est. · year 1
- Rental income
- $31,087
- − Mortgage interest
- −$15,404
- − Property taxes
- −$3,356
- − Insurance
- −$1,375
- − Repairs & maintenance
- −$2,487
- − Management
- −$2,487
- − Depreciation
- −$8,000
- Taxable loss
- −$2,022
- Est. tax savings @ 24.0%
- +$485
- After-tax cash flow
- $3,008/yr
For passive investors: Depreciation is non-cash, so a rental often shows a tax loss while cash-flowing — sheltering income. Rental losses are passive: they offset passive income freely, and up to $25,000/yr can offset ordinary (W-2) income if you actively participate and your MAGI is under $100k (phasing out to $0 by $150k); unused losses carry forward. On sale, claimed depreciation is recaptured at up to 25%, and gains may owe capital-gains tax (a 1031 exchange can defer both). Figures are a year-1 estimate at your 24.0% rate — not tax advice; consult a CPA.
Schools (NCES district)
- District
- Trussville City
- NCES district ID
- 0100013
- Math proficiency
- 49% ▼ -27.00%
- Reading proficiency
- 74% ▲ 3.00%
- Median HH income
- $83,473
- Composite
- 55.42/100
- National rank
- #1250
- State rank
- #5 of 129 in AL
Livability — Trussville
- Score
- 79/100
- State rank
- #7
- US rank
- #2110
Category grades
Schools grade is shown separately in the Schools card above.
Census & demographics
- Census place
- Trussville, AL
- City population
- 51,725
- Population (ZIP)
- 32,125
Population outlook (Jefferson County) Hauer SSP2
- Today (2025)
- 669,185 people
- By 2030
- 669,694 · +0.1%
- By 2040
- 661,388 · -1.2%
- By 2050
- 643,086 · -3.9%
- By 2075
- 577,267 · -13.7%
- By 2100
- 474,758 · -29.1%
Race, ethnicity, and origin ACS 2023
- Neighborhood character
- Predominantly White (82%)
- Race & ethnicity
- White 82% Black 10% Hispanic / Latino 5% Two or more races 4%
- Common ancestry
- Slovak 2% Italian 2% Lithuanian 1%
- Foreign-born
- 4% · Canada, Jamaica
- Languages at home
- 95% English-only · Spanish 3%
Political lean MEDSL · Jefferson
- 2024 margin
- D (+10.4) · D 54.6% · R 44.2% · Other 1.2%
- 2008→2024 swing
- +5.4pp toward D · 2008: 5.1pp · 2024: 10.4pp
- All cycles
- 2024: D+10.4 2020: D+13.2 2016: D+7.2 2012: D+6.0 2008: D+5.1
Not yet ingested
- Civics
- —
Market trends
- HPI YoY
- ▼ -104.75%
- Current HPI
- 208.5715
- Rent YoY
- —
- Metro
- —
- State GDP YoY
- ▲ 2.94%
- F500 in state
- 4
Industry mix (Fortune 500 HQ in AL)
| Industry | F500 HQs | Revenue |
|---|---|---|
| Financial Services | 1 | $8B |
|
||
| Healthcare | 1 | $5B |
|
||
Price history
+31.0% since first listed16 events — show timeline
- 2026-02-24 Price Changed $275,000 Greater Alabama MLS
- 2026-02-02 Relisted — Greater Alabama MLS
- 2026-01-24 Contingent — Greater Alabama MLS
- 2026-01-07 Relisted — Greater Alabama MLS
- 2025-12-31 Contingent — Greater Alabama MLS
- 2025-12-30 Price Changed $280,000 Greater Alabama MLS
- 2025-11-25 Listed $290,000 Greater Alabama MLS
- 2023-06-13 Price Changed $314,900 Greater Alabama MLS
- 2023-05-13 Price Changed $319,900 Greater Alabama MLS
- 2022-09-13 Sold (Public Records) $177,000 Public Records
- 2022-09-12 Sold (MLS) $177,000 Greater Alabama MLS
- 2022-08-13 Contingent — Greater Alabama MLS
- 2022-08-07 Delisted — Greater Alabama MLS
- 2022-07-01 Contingent — Greater Alabama MLS
- 2022-06-16 Price Changed $199,900 Greater Alabama MLS
- 2022-06-07 Listed $210,000 Greater Alabama MLS
Property tax history
+14.0%/yrLatest (2025): $3,356 · -1.2% YoY. Source: county tax records.
Cash-flow waterfall
monthlySold comps — $/sqft
last 12 mo · ≤1 miLoading sold comps…