52160 Date · Cabazon, CA
Flood risk 10/10 · Severe
- FEMA flood zone
- A
- Chance of flooding over 30 yrs
- 0.99%
- Est. flood insurance / yr
- $1,009 – $1,996
Fire risk 10/10 · Severe
- Est. fire insurance / yr
- $659 – $1,223
Heat risk 8/10 · Major
- Hot days now (above 100°F)
- 7 days/yr
- Hot days in 30 yrs
- 20 days/yr
Wind risk 1/10 · Minimal
- Chance of severe wind over 30 yrs
- —
Air-quality risk 8/10 · Major
- Unhealthy air days now
- 18 days/yr
- Unhealthy air days in 30 yrs
- 23 days/yr
Risk factors via First Street. Map © Google.
Why this score? — see what drove the A- grade
The composite is a weighted blend of 9 inputs, each scored 0–100. Each bar is that input's sub-score; the figure is the points it added to the 100-point composite (weight × sub-score).
- Cash flow +30.0/30.0
- ARV discount +15.0/15.0
- 1% rule +10.0/10.0
- DSCR +10.0/10.0
- Appreciation +6.6/10.0
- Livability +2.7/5.0
- Rent growth +2.5/5.0
- Condition / age +2.5/5.0
- Schools +2.0/10.0
$69,900
🖨 Deal sheet 📄 Offer letter ✓ Due diligence
Listing remarks
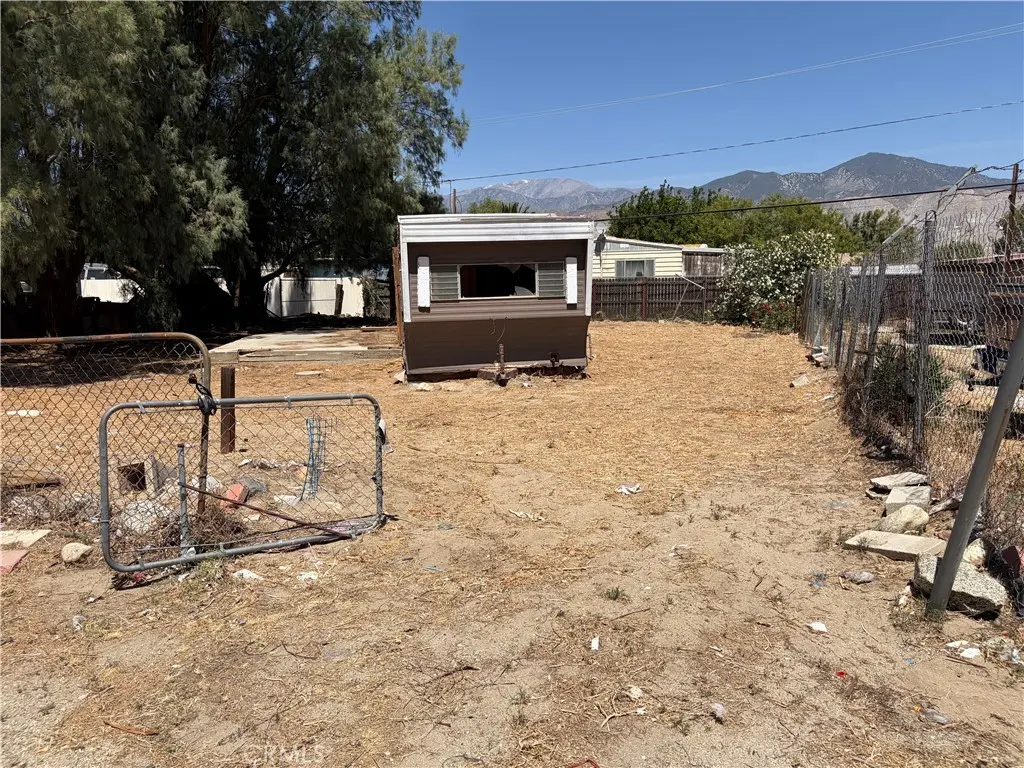
52160 Date Ave, Cabazon, CA 92230 – 5,227 sq ft lot. Sold As Is. buyer and agent to verify all information with the city.
Key facts
- 5,227 sq ft lot
- Built 1969
- Listed 52 days
Property features AI
Finance
- Other: Property is a single-unit residence
- HOA & community: Community is in a valley and urban setting
Exterior
- Utilities: Public sewer; District/Public water
- Home design: Manufactured house; Single-story
- Construction: Year built from assessor; No ADU; No common walls (detached)
- Exterior features: Yard; No pool
Interior
- Bedrooms: 2 bedrooms on the main level
- Bathrooms: 1 full bathroom (main level)
- Interior features: One-level layout; All bedrooms located on the same floor; Entry on main level
- Laundry & utility: No laundry in unit
Neighborhood map
What this means for you Summary
Snapshot
- This is a 2-bed/1.0-bath manufactured listed at $70k.
Deal economics
- At list price, monthly cash flow is $445 ($5k/yr) — positive.
- The deal already cash-flows at list — no discount required.
- Meets the 1% rule at list price ($1k rent vs $70k).
- Recommended offer: $68k (3.0% below list) — sets the bar for market timing.
Location & tenants
- Location reads 53/100 on livability (#926 in CA) — a working-class tenant base; expect higher turnover. Strengths: housing A+, crime B; Watch: cost of living D+, employment D, schools F.
- Banning Unified (suburban): math 15% / reading 25% proficiency, ranked #1,258 of 1,400 in CA (top 90%) — low school quality limits family demand, transient renter base, plan for 1-2y turnover; 76% free/reduced lunch — lower-income household profile, screen leases tightly.
- Market conditions: 67 active listings in the ZIP; 9,195 units permitted in Riverside County in 2024 (1,512 in 5+ unit buildings).
Forward outlook
- In year one you build about $3k of equity ($483 loan paydown + $2k appreciation (3.2% local appreciation)).
- Riverside County population projected at +22% by 2050 — long-run rental-demand tailwind backs the buy-and-hold thesis.
- At projected returns (3.2% appreciation + 3.0% rent growth), your $20k cash investment doubles in ~3 years — after that, you're playing with house money.
Negotiation context
- It's been on market 52 days — a 3% lower offer ($68k) is reasonable based on typical stale-listing flexibility.
Risks & watch-outs
- Watch-outs: flood insurance adds $125/mo.
- Climate carrying-cost: in FEMA flood zone A (mandatory federal flood insurance); severe wildfire risk; extreme-heat days projected 7→20/yr by 2055 (HVAC capex compounding) — expect insurance premiums to compound above CPI over the hold.
Questions for the listing agent
- It's been on market 52 days. Have you received any prior offers? Is the seller open to a 3% concession, seller financing, or rate buy-down credit?
- Built in 1969 — when were the roof, HVAC, electrical panel, plumbing, and water heater last replaced?
- What's the actual annual flood-insurance premium (NFIP or private), and is the property in a SFHA with mandatory coverage?
- Is there a deadline driving the sale (1031 exchange, divorce, estate, relocation)? That informs how much negotiation room exists.
- Schools are F-rated, which usually means shorter tenancies and higher turnover. Who's the typical renter profile here, and what's been the actual vacancy rate?
- What's the average days-on-market for RENTAL listings here right now (not sales)? A rising rental-DOM trend means longer vacancies and softer asking-rent achievability than the comps imply.
- What's the recent tenant-quality profile in this submarket — average credit score on applications, eviction rate, late-payment / NSF rate, and stable-employment percentage? A property-management company in the area should have these aggregated.
- How much new for-sale + rental construction is in the pipeline within 1–3 miles? Heavy new supply typically softens prices + rents 12–24 months out; constrained supply supports both.
Investment metrics
- 1% rule
- 1.89% ✓
- Cap rate
- 16.09%
- Cash-on-cash
- 34.97%
- DSCR
- 2.56
- GRM
- 4.4
CMA / ARV
- ARV (median comp)
- $138,915
- List price
- $69,900
- Delta
- -49.68%
- Verdict
- UNDERPRICED
- Comps
- 3 within 1.0 mi
Show comp detail 4 sales within ~0.75 mi
| Address | Dist | Beds/Ba | Sqft | Sold | Price | $/sf | Match |
|---|---|---|---|---|---|---|---|
| 52315 Lois Ave | 0.20mi | 2/1.0 | 720 (+9%) | 9mo | $229,000 | $318 | 68 |
| 52075 Esperanza Ave | 0.14mi | 1/1.0 (-1) | 630 (-4%) | 17mo | $99,000 | $157 | 67 |
| 15203 Eucalyptus St | 0.58mi | 3/1.0 (+1) | 600 (-9%) | 12mo | $141,000 | $235 | 43 |
| 51835 Date Ave | 0.31mi | 3/1.0 (+1) | 750 (+14%) | 18mo | $144,000 | $192 | 43 |
Match score weights: distance 35% · size 25% · config 20% · recency 20%. Top-matched comps best support the ARV.
Projected returns pro-forma
3.21% appreciation · 3.0% rent growth · sell at horizon
- IRR
- 33.7%
- Equity multiple
- 2.92×
- Total profit
- $37,629
- Equity at exit
- $32,240
- IRR
- 33.7%
- Equity multiple
- 5.77×
- Total profit
- $93,414
- Equity at exit
- $50,326
Cash invested: $19,572 (down + closing). Projections, not guarantees.
Landlord ↔ Tenant lean methodology
- Overall (STATE)
- 18 Strongly Tenant-Friendly
- State California
- 18 Strongly Tenant-Friendly · D+13
- County
- — inherits STATE
- City
- — inherits STATE
ZIP-level market 92230
- Home prices YoY
- 0.6%
- Active inventory
- 67
- Price-to-rent
- 4.4×
Monthly cashflow live
- Estimated rent
- $1,320 medium interval (Pro) →
- Mortgage (P&I)
- −$367
- Tax from tax record
- −$77 /mo · $923/yr
- Insurance
- −$29
- Flood insurance flood zone
- −$125 /mo · $1,502/yr
- HOA
- −$0
- Vacancy / Maint / Mgmt
- −$277
- Net cashflow
- $445
Break-even live
UW: 25.0% down · 7.5% · 30yr · 1.5% tax · 5.0% vac · 8.0% maint · 8.0% mgmt
Financing live
Cash to close
- Down payment
- $17,475
- Closing costs
- $2,097
- Reserves months
- —
- Total cash needed
- —
Loan-product check · same deal, 3 products live
Conventional
25% down · 7.5% · 30yr
- Down + closing
- —
- Monthly P&I
- —
- Monthly cashflow
- —
- DSCR
- —
- Eligible?
- —
Personal DTI + credit; lowest rate.
DSCR
20% down · 8.5% · 30yr
- Down + closing
- —
- Monthly P&I
- —
- Monthly cashflow
- —
- DSCR
- —
- Eligible?
- —
No personal income docs; deal must DSCR.
Hard money
10% down · 12.0% · 12mo
- Down + closing
- —
- Monthly P&I
- —
- Monthly cashflow
- —
- DSCR
- —
- Eligible?
- —
Short-term bridge; refi at stabilization.
Listing history 16 events
-
2026-06-18days on market $69,900 Active 52 DOM
-
2026-06-17days on market $69,900 Active 51 DOM
-
2026-06-16days on market $69,900 Active 50 DOM
-
2026-06-15days on market $69,900 Active 49 DOM
-
2026-06-13days on market $69,900 Active 47 DOM
-
2026-06-13days on market $69,900 Active 46 DOM
-
2026-06-09days on market $69,900 Active 43 DOM
-
2026-06-08days on market $69,900 Active 42 DOM
-
2026-06-07days on market $69,900 Active 41 DOM
-
2026-06-04days on market $69,900 Active 38 DOM
-
2026-06-03days on market $69,900 Active 37 DOM
-
2026-06-02days on market $69,900 Active 36 DOM
-
2026-06-01days on market $69,900 Active 35 DOM
-
2026-05-31days on market $69,900 Active 34 DOM
-
2026-05-11price $94,900 127-char remark
-
2026-04-27$99,900 Active 127-char remark
ⓘ Source: listings_history table (triggers on properties + properties_extension) + one-shot
backfill from property_details.listing_events for pre-trigger history.
Tax reassessment forecast CA · Resets to sale price
- Current annual tax
- $923 · $77/mo
- Projected year-2 tax
- $923 · $77/mo
- Expected delta
- $0/yr ($0/mo · 0.0%)
ⓘ Screening estimate from a state-policy table — verify with the county assessor before closing.
Climate risk First Street
- Flood 10/10 Extreme FEMA zone A · 99% chance over 30 yrs
- Wildfire 10/10 Extreme
- Heat 8/10 Severe 7 d/yr ≥100°F today · 20 d/yr by 30 yrs out
- Wind 1/10 Low
- Air quality 8/10 Severe 18 unhealthy d/yr today · 23 by 30 yrs out
Nearby sold comps map
Loading sold comps map…
Walkable amenities ~0.75 mi
Loading nearby amenities…
Taxation est. · year 1
- Rental income
- $15,843
- − Mortgage interest
- −$3,915
- − Property taxes
- −$923
- − Insurance
- −$1,852
- − Repairs & maintenance
- −$1,267
- − Management
- −$1,267
- − Depreciation
- −$2,033
- Taxable income
- $4,585
- Est. tax owed @ 24.0%
- −$1,100
- After-tax cash flow
- $4,242/yr
For passive investors: Depreciation is non-cash, so a rental often shows a tax loss while cash-flowing — sheltering income. Rental losses are passive: they offset passive income freely, and up to $25,000/yr can offset ordinary (W-2) income if you actively participate and your MAGI is under $100k (phasing out to $0 by $150k); unused losses carry forward. On sale, claimed depreciation is recaptured at up to 25%, and gains may owe capital-gains tax (a 1031 exchange can defer both). Figures are a year-1 estimate at your 24.0% rate — not tax advice; consult a CPA.
Schools (NCES district)
- District
- Banning Unified
- NCES district ID
- 0603840
- Math proficiency
- 15% ▬ 0.00%
- Reading proficiency
- 25% ▼ -1.00%
- Median HH income
- $39,303
- Composite
- 20.12/100
- National rank
- #13850
- State rank
- #1258 of 1400 in CA
Livability — Cabazon
- Score
- 53/100
- State rank
- #926
- US rank
- #24243
Category grades
Schools grade is shown separately in the Schools card above.
Census & demographics
- Census place
- Cabazon, CA
- City population
- 2,105
- Population (ZIP)
- 2,105
Population outlook (Riverside County) Hauer SSP2
- Today (2025)
- 2,664,475 people
- By 2030
- 2,802,692 · +5.2%
- By 2040
- 3,050,904 · +14.5%
- By 2050
- 3,256,783 · +22.2%
- By 2075
- 3,655,058 · +37.2%
- By 2100
- 3,766,594 · +41.4%
Race, ethnicity, and origin ACS 2023
- Neighborhood character
- Diverse neighborhood (Simpson 0.55)
- Race & ethnicity
- Hispanic / Latino 53% White 41% Two or more races 11% Pacific Islander 1%
- Hispanic origin (detail)
- Mexican 47%
- Common ancestry
- Iranian 5% Scandinavian 2% Portuguese 2%
- Foreign-born
- 20% · Canada
- Languages at home
- 62% English-only · Spanish 37% Other Asian/Pacific 1%
Political lean MEDSL · Riverside
- 2024 margin
- Toss-up / Even · D 48.0% · R 49.3% · Other 2.6%
- 2008→2024 swing
- -3.6pp toward R · 2008: 2.3pp · 2024: -1.3pp
- All cycles
- 2024: R+1.3 2020: D+8.0 2016: D+4.3 2012: R+0.4 2008: D+2.3
Not yet ingested
- Civics
- —
Market trends
- HPI YoY
- ▲ 3.21%
- Current HPI
- 549.9479
- Rent YoY
- —
- Metro
- —
- State GDP YoY
- ▲ 3.21%
- F500 in state
- 116
Industry mix (Fortune 500 HQ in CA)
| Industry | F500 HQs | Revenue |
|---|---|---|
| Technology | 27 | $1,492B |
|
||
| Financial Services | 3 | $174B |
|
||
| Retail | 3 | $44B |
|
||
| Insurance | 3 | $26B |
|
||
| Media / Entertainment | 2 | $115B |
|
||
| Pharmaceuticals / Biotech | 2 | $62B |
|
||
Price history
-30.0% since first listed3 events — show timeline
- 2026-05-28 Price Changed $69,900 CRMLS
- 2026-05-11 Price Changed $94,900 CRMLS
- 2026-04-27 Listed $99,900 CRMLS
Property tax history
+9.0%/yrLatest (2025): $923 · +230.6% YoY. Source: county tax records.
Cash-flow waterfall
monthlySold comps — $/sqft
last 12 mo · ≤1 miLoading sold comps…