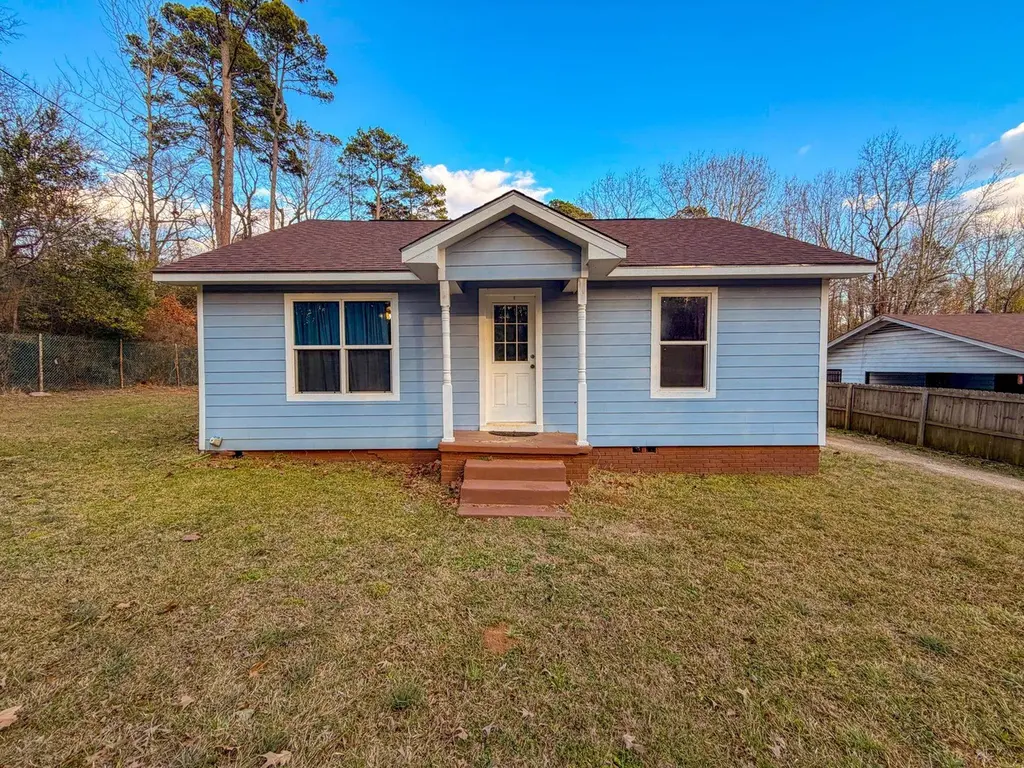
804 Evans St · Marshall, TX
Flood risk 1/10 · Minimal
- FEMA flood zone
- X (unshaded)
- Chance of flooding over 30 yrs
- 0.0%
- Est. flood insurance / yr
- $507 – $1,088
Fire risk 4/10 · Minor
- Est. fire insurance / yr
- $1,222 – $2,270
Heat risk 6/10 · Moderate
- Hot days now (above 110°F)
- 7 days/yr
- Hot days in 30 yrs
- 23 days/yr
Wind risk 6/10 · Moderate
- Chance of severe wind over 30 yrs
- 58.0%
Air-quality risk 2/10 · Minimal
- Unhealthy air days now
- 1 days/yr
- Unhealthy air days in 30 yrs
- 2 days/yr
Risk factors via First Street. Map © Google.
Why this score? — see what drove the D+ grade
The composite is a weighted blend of 9 inputs, each scored 0–100. Each bar is that input's sub-score; the figure is the points it added to the 100-point composite (weight × sub-score).
- Cash flow +18.6/30.0
- ARV discount +7.5/15.0
- DSCR +5.8/10.0
- 1% rule +3.9/10.0
- Livability +3.4/5.0
- Rent growth +2.5/5.0
- Condition / age +2.5/5.0
- Schools +2.4/10.0
- Appreciation +0.0/10.0
$108,000
🖨 Deal sheet 📄 Offer letter ✓ Due diligence
Listing remarks MLS
This wonderful 2 bedroom 1 bath house is ready for its next owners to come and make it home! It is a couple of blocks away from the East Texas Baptist University campus and near US 80! The wooden fence around it provides the perfect amount of privacy! Check it out today!
Key facts
- 7,841 sq ft lot
- Built 1950
- Listed 129 days
Neighborhood map
What this means for you Summary
Snapshot
- This is a 2-bed/1.0-bath single-family listed at $108k.
Deal economics
- At list price, monthly cash flow is $104 ($1k/yr) — positive.
- The deal already cash-flows at list — no discount required.
- To meet the 1% rule (rent ≥ 1% of price), the offer needs to be $97k (10.6% below list).
- Recommended offer: $95k (12.0% below list) — sets the bar for market timing.
Location & tenants
- Location reads 68/100 on livability (#451 in TX) — a middle-class / working-renter tenant base. Strengths: cost of living A+, housing A+; Watch: schools F, amenities F, commute F.
- Marshall ISD (town): math 29% / reading 29% proficiency, ranked #658 of 826 in TX (top 80%) — low school quality limits family demand, transient renter base, plan for 1-2y turnover; 68% free/reduced lunch — lower-income household profile, screen leases tightly.
- Market conditions: 143 active listings in the ZIP; 1 comparable units currently listed for rent nearby; lower-income renter base — watch delinquency; 85 units permitted in Harrison County in 2024 (15 in 5+ unit buildings).
Forward outlook
- Local home prices are declining (-3.0%/yr); year-one equity from $747 of loan paydown is wiped out by about $3k of value loss. Plan a longer hold.
Negotiation context
- It's been on market 130 days — a 12% lower offer ($95k) is reasonable based on typical stale-listing flexibility.
Risks & watch-outs
- Watch-outs: built in 1950 — expect roof / HVAC / electrical / plumbing capex.
- Climate carrying-cost: major wind risk, 58% chance of damaging wind over 30y; extreme-heat days projected 7→23/yr by 2055 (HVAC capex compounding) — expect insurance premiums to compound above CPI over the hold.
Questions for the listing agent
- It's been on market 130 days. Have you received any prior offers? Is the seller open to a 12% concession, seller financing, or rate buy-down credit?
- Built in 1950 — when were the roof, HVAC, electrical panel, plumbing, and water heater last replaced?
- Why hasn't it sold? Are there any deal-killer items the seller is aware of (foundation, flood, title, zoning, code violations)?
- Is there a deadline driving the sale (1031 exchange, divorce, estate, relocation)? That informs how much negotiation room exists.
- Schools are F-rated, which usually means shorter tenancies and higher turnover. Who's the typical renter profile here, and what's been the actual vacancy rate?
- The area grade is low — what's the realistic commute time and amenity access for the typical tenant pool here? Any planned neighborhood developments (good or bad) we should know about?
- What's the average days-on-market for RENTAL listings here right now (not sales)? A rising rental-DOM trend means longer vacancies and softer asking-rent achievability than the comps imply.
- What's the recent tenant-quality profile in this submarket — average credit score on applications, eviction rate, late-payment / NSF rate, and stable-employment percentage? A property-management company in the area should have these aggregated.
- How much new for-sale + rental construction is in the pipeline within 1–3 miles? Heavy new supply typically softens prices + rents 12–24 months out; constrained supply supports both.
Investment metrics
- 1% rule
- 0.89% ✗
- Cap rate
- 7.45%
- Cash-on-cash
- 4.14%
- DSCR
- 1.18
- GRM
- 9.3
CMA / ARV
- ARV (median comp)
- $20,252
- List price
- $108,000
- Delta
- 433.29%
- Verdict
- OVERPRICED
- Comps
- 4 within 1.0 mi
Projected returns pro-forma
-3.0% appreciation · 3.0% rent growth · sell at horizon
- IRR
- -9.9%
- Equity multiple
- 0.64×
- Total profit
- $-10,898
- Equity at exit
- $16,103
- IRR
- -0.5%
- Equity multiple
- 0.96×
- Total profit
- $-1,096
- Equity at exit
- $9,338
Cash invested: $30,240 (down + closing). Projections, not guarantees.
Landlord ↔ Tenant lean methodology
- Overall (STATE)
- 87 Strongly Landlord-Friendly
- State Texas
- 87 Strongly Landlord-Friendly · R+5
- County
- — inherits STATE
- City
- — inherits STATE
ZIP-level market 75670
- Home prices YoY
- -33.8%
- Active inventory
- 143
- Price-to-rent
- 9.3×
Monthly cashflow live
- Estimated rent
- $966 medium interval (Pro) →
- Mortgage (P&I)
- −$566
- Tax from tax record
- −$47 /mo · $569/yr
- Insurance
- −$45
- HOA
- −$0
- Vacancy / Maint / Mgmt
- −$203
- Net cashflow
- $104
Break-even live
UW: 25.0% down · 7.5% · 30yr · 1.5% tax · 5.0% vac · 8.0% maint · 8.0% mgmt
Financing live
Cash to close
- Down payment
- $27,000
- Closing costs
- $3,240
- Reserves months
- —
- Total cash needed
- —
Loan-product check · same deal, 3 products live
Conventional
25% down · 7.5% · 30yr
- Down + closing
- —
- Monthly P&I
- —
- Monthly cashflow
- —
- DSCR
- —
- Eligible?
- —
Personal DTI + credit; lowest rate.
DSCR
20% down · 8.5% · 30yr
- Down + closing
- —
- Monthly P&I
- —
- Monthly cashflow
- —
- DSCR
- —
- Eligible?
- —
No personal income docs; deal must DSCR.
Hard money
10% down · 12.0% · 12mo
- Down + closing
- —
- Monthly P&I
- —
- Monthly cashflow
- —
- DSCR
- —
- Eligible?
- —
Short-term bridge; refi at stabilization.
Rent comps 1 comps
| Address | Beds | Baths | Sqft | Rent | $/sqft | DOM | Units | Dist |
|---|---|---|---|---|---|---|---|---|
| 2707 Norwood St Marshall, TX | 1.0–3.0 | 1.0–2.0 | 971 | $1,075 | $1.11 | 13d | 16 | 1.21mi |
Listing history 18 events
-
2026-06-19days on market $108,000 Active 130 DOM
-
2026-06-18days on market $108,000 Active 129 DOM
-
2026-06-17days on market $108,000 Active 128 DOM
-
2026-06-16days on market $108,000 Active 127 DOM
-
2026-06-15days on market $108,000 Active 126 DOM
-
2026-06-14days on market $108,000 Active 124 DOM
-
2026-06-13days on market $108,000 Active 123 DOM
-
2026-06-10days on market $108,000 Active 121 DOM
-
2026-06-09days on market $108,000 Active 120 DOM
-
2026-06-08days on market $108,000 Active 119 DOM
-
2026-06-07days on market $108,000 Active 118 DOM
-
2026-06-02days on market $108,000 Active 113 DOM
-
2026-06-01days on market $108,000 Active 112 DOM
-
2026-05-31days on market $108,000 Active 111 DOM
-
2026-05-30days on market $108,000 Active 110 DOM
-
2026-03-23price $108,000 271-char remark
Show marketing remark (271 chars)
This wonderful 2 bedroom 1 bath house is ready for its next owners to come and make it home! It is a couple of blocks away from the East Texas Baptist University campus and near US 80! The wooden fence around it provides the perfect amount of privacy! Check it out today!
-
2026-02-10$115,000 Active 271-char remark
Show marketing remark (271 chars)
This wonderful 2 bedroom 1 bath house is ready for its next owners to come and make it home! It is a couple of blocks away from the East Texas Baptist University campus and near US 80! The wooden fence around it provides the perfect amount of privacy! Check it out today!
-
2003-09-23soldstatus
ⓘ Source: listings_history table (triggers on properties + properties_extension) + one-shot
backfill from property_details.listing_events for pre-trigger history.
Tax reassessment forecast TX · Resets to sale price
- Current annual tax
- $569 · $47/mo
- Projected year-2 tax
- $1,976 · $165/mo
- Expected delta
- +$1,407/yr (+$117/mo · 247.1%)
ⓘ Screening estimate from a state-policy table — verify with the county assessor before closing.
Climate risk First Street
- Flood 1/10 Low FEMA zone X (unshaded) · 0% chance over 30 yrs
- Wildfire 4/10 Moderate
- Heat 6/10 Major 7 d/yr ≥110°F today · 23 d/yr by 30 yrs out
- Wind 6/10 Major 58% chance of damaging wind over 30 yrs
- Air quality 2/10 Low 1 unhealthy d/yr today · 2 by 30 yrs out
Nearby sold comps map
Loading sold comps map…
Walkable amenities ~0.75 mi
Loading nearby amenities…
Taxation est. · year 1
- Rental income
- $11,592
- − Mortgage interest
- −$6,050
- − Property taxes
- −$569
- − Insurance
- −$540
- − Repairs & maintenance
- −$927
- − Management
- −$927
- − Depreciation
- −$3,142
- Taxable loss
- −$564
- Est. tax savings @ 24.0%
- +$135
- After-tax cash flow
- $1,387/yr
For passive investors: Depreciation is non-cash, so a rental often shows a tax loss while cash-flowing — sheltering income. Rental losses are passive: they offset passive income freely, and up to $25,000/yr can offset ordinary (W-2) income if you actively participate and your MAGI is under $100k (phasing out to $0 by $150k); unused losses carry forward. On sale, claimed depreciation is recaptured at up to 25%, and gains may owe capital-gains tax (a 1031 exchange can defer both). Figures are a year-1 estimate at your 24.0% rate — not tax advice; consult a CPA.
Schools (NCES district)
- District
- Marshall ISD
- NCES district ID
- 4829160
- Math proficiency
- 29% ▼ -7.00%
- Reading proficiency
- 29% ▼ -7.00%
- Median HH income
- $40,095
- Composite
- 24.43/100
- National rank
- #7680
- State rank
- #658 of 826 in TX
Livability — Marshall
- Score
- 68/100
- State rank
- #451
- US rank
- #9156
Category grades
Schools grade is shown separately in the Schools card above.
Census & demographics
- Census place
- Marshall, TX
- County
- Harrison County · 18,670 people
- City population
- 18,670
- Metro
- Longview, TX
- Population (ZIP)
- 18,670
- Household income
- $42,386
- Rent vs Own
- Severe rent burden
- 598.0
Population outlook (Harrison County) Hauer SSP2
- Today (2025)
- 68,691 people
- By 2030
- 69,317 · +0.9%
- By 2040
- 69,973 · +1.9%
- By 2050
- 70,090 · +2.0%
- By 2075
- 70,607 · +2.8%
- By 2100
- 67,546 · -1.7%
Race, ethnicity, and origin ACS 2023
- Neighborhood character
- Diverse neighborhood (Simpson 0.67)
- Race & ethnicity
- Black 39% White 35% Hispanic / Latino 23% Two or more races 11%
- Hispanic origin (detail)
- Mexican 22%
- Common ancestry
- Lithuanian 1% Italian 1% Slovak 1%
- Foreign-born
- 6% · Canada
- Languages at home
- 85% English-only · Spanish 14%
Political lean MEDSL · Harrison
- 2024 margin
- Solid R (+50.6) · D 24.4% · R 75.0%
- 2008→2024 swing
- -19.2pp toward R · 2008: -31.4pp · 2024: -50.6pp
- All cycles
- 2024: R+50.6 2020: R+45.6 2016: R+43.9 2012: R+34.6 2008: R+31.4
Not yet ingested
- Civics
- —
Market trends
- HPI YoY
- ▼ -51.33%
- Current HPI
- 100.3741
- Rent YoY
- —
- Metro
- Longview, TX
- State GDP YoY
- ▲ 3.95%
- F500 in state
- 110
Industry mix (Fortune 500 HQ in TX)
| Industry | F500 HQs | Revenue |
|---|---|---|
| Energy | 16 | $1,198B |
|
||
| Technology | 5 | $198B |
|
||
| Engineering / Construction | 4 | $72B |
|
||
| Energy Services | 3 | $60B |
|
||
| Utilities | 3 | $41B |
|
||
| Healthcare | 2 | $330B |
|
||
Price history
-6.1% since first listed3 events — show timeline
- 2026-03-23 Price Changed $108,000 LAAR
- 2026-02-10 Listed $115,000 LAAR
- 2003-09-23 Sold (Public Records) — Public Records
Property tax history
+4.8%/yrLatest (2025): $569 · +9.0% YoY. Source: county tax records.
Cash-flow waterfall
monthlySold comps — $/sqft
last 12 mo · ≤1 miLoading sold comps…