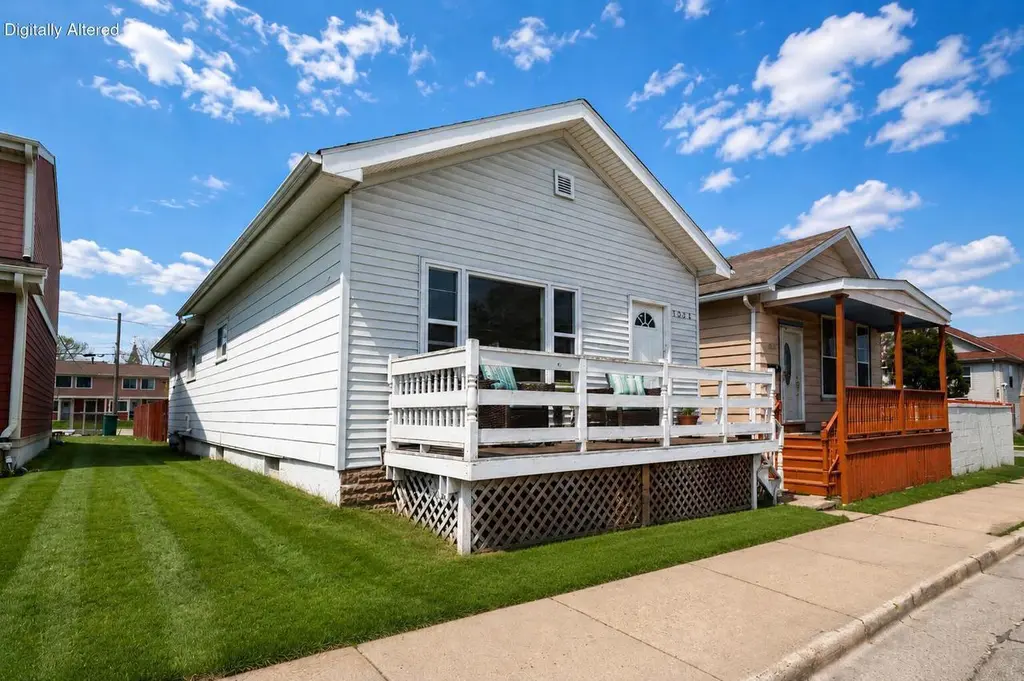
1211 S 6th St · Milwaukee, WI
Flood risk 1/10 · Minimal
- FEMA flood zone
- X (unshaded)
- Chance of flooding over 30 yrs
- 0.0%
- Est. flood insurance / yr
- $473 – $860
Fire risk 1/10 · Minimal
- Est. fire insurance / yr
- $636 – $1,182
Heat risk 2/10 · Minimal
- Hot days now (above 96°F)
- 7 days/yr
- Hot days in 30 yrs
- 13 days/yr
Wind risk 2/10 · Minimal
- Chance of severe wind over 30 yrs
- —
Air-quality risk 3/10 · Minor
- Unhealthy air days now
- 3 days/yr
- Unhealthy air days in 30 yrs
- 3 days/yr
Risk factors via First Street. Map © Google.
Why this score? — see what drove the A grade
The composite is a weighted blend of 9 inputs, each scored 0–100. Each bar is that input's sub-score; the figure is the points it added to the 100-point composite (weight × sub-score).
- Cash flow +30.0/30.0
- ARV discount +15.0/15.0
- 1% rule +10.0/10.0
- DSCR +10.0/10.0
- Appreciation +10.0/10.0
- Livability +4.0/5.0
- Rent growth +3.0/5.0
- Condition / age +2.5/5.0
- Schools +1.2/10.0
$119,900
🖨 Deal sheet 📄 Offer letter ✓ Due diligence
Listing remarks MLS
HUD case# 581-304646 Property sold in AS IS condition, without repairs or warranties. Offered to owner-occupant buyers first. In some cases, HUD properties may only be available to Non-profits, Government agencies. Check website for availability. No repairs allowed before closing.
Key facts
- 3,484 sq ft lot
- Parking
- Built 1860
Property features AI
Exterior
- Parking: 1 parking space
- Utilities: Municipal water; Municipal sewer; Natural gas
- Home design: Single-family, one-story home
- Construction: Aluminum/steel exterior construction
- Exterior features: Aluminum/steel exterior; Garden shed; Sidewalks on the lot
Interior
- Kitchen: Oven; Refrigerator
- Bedrooms: Main-level primary bedroom approximately 13 x 13; Main-level second bedroom approximately 11 x 7
- Bathrooms: One full bathroom with tub and shower over tub
- Heating & cooling: Forced air heating (natural gas)
- Interior features: Full basement; Fenced yard
- Laundry & utility: Forced air heating (natural gas)
Neighborhood map
What this means for you Summary
Snapshot
- This is a 2-bed/1.5-bath single-family listed at $120k.
Deal economics
- At list price, monthly cash flow is $888 ($11k/yr) — positive.
- The deal already cash-flows at list — no discount required.
- Meets the 1% rule at list price ($2k rent vs $120k).
- Cap rate 15.2% vs local median 5.1% in Milwaukee — top-decile yield for the area; either an underpriced asset or a hidden risk that comps aren't pricing in. Stress-test before assuming the spread holds.
Location & tenants
- Location reads 81/100 on livability (#55 in WI, #1,534 nationally) — a professional / high-income tenant draw. Strengths: amenities A+, commute A+, cost of living A+; Watch: employment D+, schools F, crime F.
- Milwaukee School District (urban): math 10% / reading 18% proficiency, ranked #337 of 342 in WI (top 98%) — low school quality limits family demand, transient renter base, plan for 1-2y turnover; 77% free/reduced lunch — lower-income household profile, screen leases tightly.
- Market conditions: Rents rising (+2.0%/yr); 55 active listings in the ZIP; 40 comparable units currently listed for rent nearby; rentals at typical pace (median 24d on market — plan ~3-4 weeks tenant-placement turnaround); 1,017 units permitted in Milwaukee County in 2024 (803 in 5+ unit buildings).
- At $2,264/mo this rent would consume 59% of the median local household income ($46k/yr) (locally 2357% of renters already pay >50% of income on rent) — very limited rent-growth headroom before tenants either downsize or default.
Forward outlook
- In year one you build about $13k of equity ($829 loan paydown + $12k appreciation (10.0% local appreciation)).
- Milwaukee County population projected at +4% by 2050 — modest demand growth; plan on rents tracking national, not racing it.
- At projected returns (10.0% appreciation + 2.0% rent growth), your $34k cash investment doubles in ~2 years — after that, you're playing with house money.
- By year 3, paydown + projected appreciation supports a ~$32k cash-out refi (75% LTV) — recoverable capital for the next deal without selling this one.
Negotiation context
- Only 5 days on market — expect competitive offers; lowballing is unlikely to land.
- 2 sale attempts since 13y ago with the ask held roughly flat each time — persistent listings suggest the price (not the market) is what's stuck; bring a comps-based counter.
Risks & watch-outs
- Watch-outs: built in 1860 — expect roof / HVAC / electrical / plumbing capex.
Questions for the listing agent
- Built in 1860 — when were the roof, HVAC, electrical panel, plumbing, and water heater last replaced?
- Is there a deadline driving the sale (1031 exchange, divorce, estate, relocation)? That informs how much negotiation room exists.
- Schools are F-rated, which usually means shorter tenancies and higher turnover. Who's the typical renter profile here, and what's been the actual vacancy rate?
- Crime grade is F in this area — have there been break-ins, vandalism, or insurance claims at this property in the last 3 years? What carrier currently insures it and at what premium?
- What's the average days-on-market for RENTAL listings here right now (not sales)? A rising rental-DOM trend means longer vacancies and softer asking-rent achievability than the comps imply.
- What's the recent tenant-quality profile in this submarket — average credit score on applications, eviction rate, late-payment / NSF rate, and stable-employment percentage? A property-management company in the area should have these aggregated.
- How much new for-sale + rental construction is in the pipeline within 1–3 miles? Heavy new supply typically softens prices + rents 12–24 months out; constrained supply supports both.
Investment metrics
- 1% rule
- 1.89% ✓
- Cap rate
- 15.18%
- Cash-on-cash
- 31.72%
- DSCR
- 2.41
- GRM
- 4.4
CMA / ARV
- ARV (median comp)
- $159,179
- List price
- $119,900
- Delta
- -24.68%
- Verdict
- UNDERPRICED
- Comps
- 20 within 1.0 mi
Show comp detail 12 sales within ~0.75 mi
| Address | Dist | Beds/Ba | Sqft | Sold | Price | $/sf | Match |
|---|---|---|---|---|---|---|---|
| 1211 S 6th St | 0.00mi | 2/1.0 | 1,288 (0%) | 1mo | $130,000 | $101 | 97 |
| 915 W Walker St | 0.32mi | 3/2.0 (+1) | 1,300 (+1%) | 6mo | $165,000 | $127 | 71 |
| 1123 S 3rd St | 0.21mi | 3/2.0 (+1) | 1,250 (-3%) | 12mo | $285,000 | $228 | 68 |
| 1530 S 10th St | 0.36mi | 3/1.0 (+1) | 1,210 (-6%) | 6mo | $125,000 | $103 | 61 |
| 122 W Maple St | 0.62mi | 2/1.0 | 1,236 (-4%) | 5mo | $265,000 | $214 | 59 |
| 1227 S 10th St | 0.29mi | 3/1.0 (+1) | 1,466 (+14%) | 5mo | $185,000 | $126 | 52 |
| 1730 S 6th St | 0.50mi | 2/2.0 | 1,133 (-12%) | 4mo | $151,500 | $134 | 52 |
| 1624 S 4th St | 0.39mi | 3/2.0 (+1) | 1,380 (+7%) | 14mo | $160,000 | $116 | 51 |
| 1966 S 7th St | 0.70mi | 3/2.0 (+1) | 1,259 (-2%) | 7mo | $145,000 | $115 | 51 |
| 1732 S 4th St | 0.53mi | 3/1.5 (+1) | 1,399 (+9%) | 14mo | $140,000 | $100 | 45 |
| 927A S 11th St | 0.42mi | 3/1.0 (+1) | 1,480 (+15%) | 7mo | $190,000 | $128 | 42 |
| 602 W Maple St | 0.52mi | 3/2.0 (+1) | 1,100 (-15%) | 6mo | $150,000 | $136 | 39 |
Match score weights: distance 35% · size 25% · config 20% · recency 20%. Top-matched comps best support the ARV.
Projected returns pro-forma
10.0% appreciation · 2.0% rent growth · sell at horizon
- IRR
- 47.8%
- Equity multiple
- 4.56×
- Total profit
- $119,650
- Equity at exit
- $108,015
- IRR
- 41.2%
- Equity multiple
- 10.05×
- Total profit
- $303,662
- Equity at exit
- $232,939
Cash invested: $33,572 (down + closing). Projections, not guarantees.
Landlord ↔ Tenant lean methodology
- Overall (STATE)
- 73 Landlord-Friendly
- State Wisconsin
- 73 Landlord-Friendly · R+2
- County
- — inherits STATE
- City
- — inherits STATE
ZIP-level market 53204
- Home prices YoY
- 19.0%
- Rents YoY
- 2.0%
- Active inventory
- 55
- Price-to-rent
- 4.4×
Monthly cashflow live
- Estimated rent
- $2,264 high interval (Pro) →
- Mortgage (P&I)
- −$629
- Tax from tax record
- −$222 /mo · $2,669/yr
- Insurance
- −$50
- HOA
- −$0
- Vacancy / Maint / Mgmt
- −$475
- Net cashflow
- $888
Break-even live
UW: 25.0% down · 7.5% · 30yr · 1.5% tax · 5.0% vac · 8.0% maint · 8.0% mgmt
Financing live
Cash to close
- Down payment
- $29,975
- Closing costs
- $3,597
- Reserves months
- —
- Total cash needed
- —
Loan-product check · same deal, 3 products live
Conventional
25% down · 7.5% · 30yr
- Down + closing
- —
- Monthly P&I
- —
- Monthly cashflow
- —
- DSCR
- —
- Eligible?
- —
Personal DTI + credit; lowest rate.
DSCR
20% down · 8.5% · 30yr
- Down + closing
- —
- Monthly P&I
- —
- Monthly cashflow
- —
- DSCR
- —
- Eligible?
- —
No personal income docs; deal must DSCR.
Hard money
10% down · 12.0% · 12mo
- Down + closing
- —
- Monthly P&I
- —
- Monthly cashflow
- —
- DSCR
- —
- Eligible?
- —
Short-term bridge; refi at stabilization.
Rent comps 40 comps
| Address | Beds | Baths | Sqft | Rent | $/sqft | DOM | Units | Dist |
|---|---|---|---|---|---|---|---|---|
| 924 S 5th St Unit 501 Milwaukee, WI | 2.0 | 1.0 | 1005 | $1,917 | $1.91 | 43d | 1 | 0.19mi |
| 611 W National Ave Milwaukee, WI | 1.0–2.0 | 1.0–2.0 | 866 | $1,900 | $2.19 | 3d | 3 | 0.28mi |
| 124 W Washington St Milwaukee, WI | 2.0 | 1.0–2.0 | 845 | $2,126 | $2.52 | 43d | 11 | 0.32mi |
| 1812 S 7th St Milwaukee, WI | 3.0 | 1.5 | 1703 | $2,100 | $1.23 | 23d | 1 | 0.58mi |
| 720 W Virginia St Milwaukee, WI | 1.0 | 1.0 | 746 | $1,800 | $2.41 | 10d | 5 | 0.59mi |
| 300 W Florida St Unit 415 Milwaukee, WI | 2.0 | 1.0 | 991 | $2,350 | $2.37 | 43d | 1 | 0.62mi |
| 747 W Freshwater Way Unit 112 Milwaukee, WI | 2.0 | 1.0 | 983 | $2,725 | $2.77 | 43d | 1 | 0.64mi |
| 747 W Freshwater Way Apt 502 Milwaukee, WI | 2.0 | 2.0 | 1200 | $3,650 | $3.04 | 17d | 1 | 0.64mi |
| 625 W Freshwater Way Milwaukee, WI | 1.0–2.0 | 1.0–2.0 | 1137 | $3,650 | $3.21 | 2d | 12 | 0.64mi |
| 625 W Freshwater Way Unit 508 Milwaukee, WI | 1.0 | 1.0 | 900 | $2,200 | $2.44 | 43d | 1 | 0.65mi |
| 324 S 2nd St Unit 1504185P Milwaukee, WI | 2.0 | 1.0 | 1033 | $4,467 | $4.32 | 2d | 1 | 0.66mi |
| 324 S 2nd St Apt 309 Milwaukee, WI | 2.0 | 2.0 | 1085 | $2,525 | $2.33 | 4d | 1 | 0.66mi |
| 324 S 2nd St Unit 1504186P Milwaukee, WI | 2.0 | 1.0 | 1033 | $4,713 | $4.56 | 43d | 1 | 0.66mi |
| 205 W Oregon St Unit 322 Milwaukee, WI | 2.0 | 2.0 | 1037 | $2,360 | $2.28 | 43d | 1 | 0.67mi |
| 205 W Oregon St Apt 402 Milwaukee, WI | 2.0 | 2.0 | 1238 | $2,705 | $2.18 | 4d | 1 | 0.67mi |
| 133 W Oregon St Milwaukee, WI | 3.0 | 2.0 | 1561 | $2,775 | $1.78 | 3d | 3 | 0.71mi |
| 222 S 3rd St Milwaukee, WI | 2.0 | 2.0 | 1369 | $2,300 | $1.68 | 17d | 1 | 0.71mi |
| 174 W Pittsburgh Ave Unit 174 Milwaukee, WI | 1.0 | 1.0 | 1282 | $1,995 | $1.56 | 43d | 1 | 0.79mi |
| 235 E Pittsburgh Ave Milwaukee, WI | 1.0–2.0 | 1.0–2.5 | 1008 | $2,775 | $2.75 | 3d | 6 | 0.82mi |
| 135 W Seeboth St Unit Cream City Lofts-104 Milwaukee, WI | 3.0 | 2.0 | 1856 | $2,995 | $1.61 | 17d | 1 | 0.84mi |
| 441 E Erie St Milwaukee, WI | 1.0–2.0 | 1.0–2.0 | 1044 | $4,099 | $3.93 | 3d | 4 | 0.97mi |
| 1578 S Union St Unit 1 Milwaukee, WI | 2.0 | 1.0 | 900 | $1,050 | $1.17 | 23d | 1 | 1.01mi |
| 239 E Chicago St Milwaukee, WI | 1.0–2.0 | 1.0–2.0 | 1510 | $3,348 | $2.22 | 43d | 2 | 1.05mi |
| 239 E Chicago St Milwaukee, WI | 1.0–3.0 | 1.0–2.5 | 1652 | $2,425 | $1.47 | 4d | 2 | 1.05mi |
| 425 E Menomonee St Milwaukee, WI | 2.0 | 1.0–2.0 | 1021 | $2,633 | $2.58 | 3d | 5 | 1.06mi |
| 2252 S 7th St Unit Upper Front Milwaukee, WI | 2.0 | 1.0 | 900 | $1,200 | $1.33 | 43d | 1 | 1.08mi |
| 2141 S Robinson Ave Milwaukee, WI | 3.0 | 1.0–2.0 | 1006 | $2,272 | $2.26 | 1d | 20 | 1.08mi |
| 249 N Water St Milwaukee, WI | 1.0 | 1.0 | 891 | $1,750 | $1.96 | 23d | 1 | 1.10mi |
| 615 E Corcoran Ave Milwaukee, WI | 3.0 | 1.0–2.5 | 1106 | $3,797 | $3.43 | 3d | 14 | 1.10mi |
| 2100 W National Ave Unit 4 Milwaukee, WI | 2.0 | 1.0 | 900 | $1,225 | $1.36 | 23d | 1 | 1.13mi |
| 333 N Water St Milwaukee, WI | 3.0 | 1.0–2.0 | 1186 | $5,948 | $5.02 | 2d | 34 | 1.16mi |
| 159 N Jackson St Unit 106 Live/Work Retail Milwaukee, WI | 1.0 | 1.0 | 1060 | $1,895 | $1.79 | 43d | 1 | 1.17mi |
| 333 N Broadway Milwaukee, WI | 2.0 | 2.0 | 1175 | $3,645 | $3.10 | 2d | 1 | 1.20mi |
| 401 W Michigan St Milwaukee, WI | 2.0 | 1.0–2.0 | 913 | $2,218 | $2.43 | 4d | 6 | 1.25mi |
| 321 N Jefferson St Unit 321 Jefferson-606 Milwaukee, WI | 2.0 | 2.0 | 1503 | $3,750 | $2.50 | 43d | 1 | 1.26mi |
| 630 N Vel R Phillips Ave Milwaukee, WI | 1.0–2.0 | 1.0–2.0 | 1058 | $2,219 | $2.10 | 3d | 9 | 1.29mi |
| 2435 S 9th St Milwaukee, WI | 2.0 | 1.0 | 900 | $895 | $0.99 | 23d | 1 | 1.30mi |
| 2435 S 9th St Unit 2435A Milwaukee, WI | 2.0 | 1.0 | 900 | $1,025 | $1.14 | 43d | 1 | 1.30mi |
| 2435 S 9th St Unit 2435 Milwaukee, WI | 2.0 | 1.0 | 900 | $895 | $0.99 | 43d | 1 | 1.30mi |
| 2482 S 5th St Milwaukee, WI | 2.0 | 1.0 | 900 | $1,095 | $1.22 | 23d | 1 | 1.34mi |
Listing history 7 events
-
2026-05-16$119,900 Active 421-char remark
-
2026-05-16historical $119,900 421-char remark
-
2013-11-23$25,000 281-char remark
Show marketing remark (281 chars)
HUD case# 581-304646 Property sold in AS IS condition, without repairs or warranties. Offered to owner-occupant buyers first. In some cases, HUD properties may only be available to Non-profits, Government agencies. Check website for availability. No repairs allowed before closing.
-
2013-11-23historical 281-char remark
Show marketing remark (281 chars)
HUD case# 581-304646 Property sold in AS IS condition, without repairs or warranties. Offered to owner-occupant buyers first. In some cases, HUD properties may only be available to Non-profits, Government agencies. Check website for availability. No repairs allowed before closing.
-
2013-11-21soldstatus $25,500 281-char remark
Show marketing remark (281 chars)
HUD case# 581-304646 Property sold in AS IS condition, without repairs or warranties. Offered to owner-occupant buyers first. In some cases, HUD properties may only be available to Non-profits, Government agencies. Check website for availability. No repairs allowed before closing.
-
1999-10-04soldstatus $38,900
-
1994-11-01soldstatus $34,900
ⓘ Source: listings_history table (triggers on properties + properties_extension) + one-shot
backfill from property_details.listing_events for pre-trigger history.
Tax reassessment forecast WI · Partial reset (capped growth)
- Current annual tax
- $2,669 · $222/mo
- Projected year-2 tax
- $2,669 · $222/mo
- Expected delta
- $0/yr ($0/mo · 0.0%)
ⓘ Screening estimate from a state-policy table — verify with the county assessor before closing.
Climate risk First Street
- Flood 1/10 Low FEMA zone X (unshaded) · 0% chance over 30 yrs
- Wildfire 1/10 Low
- Heat 2/10 Low 7 d/yr ≥96°F today · 13 d/yr by 30 yrs out
- Wind 2/10 Low
- Air quality 3/10 Moderate 3 unhealthy d/yr today · 3 by 30 yrs out
Nearby sold comps map
Loading sold comps map…
Walkable amenities ~0.75 mi
Loading nearby amenities…
Taxation est. · year 1
- Rental income
- $27,169
- − Mortgage interest
- −$6,716
- − Property taxes
- −$2,669
- − Insurance
- −$600
- − Repairs & maintenance
- −$2,174
- − Management
- −$2,174
- − Depreciation
- −$3,488
- Taxable income
- $9,350
- Est. tax owed @ 24.0%
- −$2,244
- After-tax cash flow
- $8,406/yr
For passive investors: Depreciation is non-cash, so a rental often shows a tax loss while cash-flowing — sheltering income. Rental losses are passive: they offset passive income freely, and up to $25,000/yr can offset ordinary (W-2) income if you actively participate and your MAGI is under $100k (phasing out to $0 by $150k); unused losses carry forward. On sale, claimed depreciation is recaptured at up to 25%, and gains may owe capital-gains tax (a 1031 exchange can defer both). Figures are a year-1 estimate at your 24.0% rate — not tax advice; consult a CPA.
Schools (NCES district)
- District
- Milwaukee School District
- NCES district ID
- 5509600
- Math proficiency
- 10% ▼ -5.00%
- Reading proficiency
- 18% ▬ 0.00%
- Median HH income
- $36,339
- Composite
- 11.61/100
- National rank
- #9696
- State rank
- #337 of 342 in WI
Livability — Milwaukee
- Score
- 81/100
- State rank
- #55
- US rank
- #1534
Category grades
Schools grade is shown separately in the Schools card above.
Census & demographics
- Census place
- Milwaukee, WI
- County
- Milwaukee County · 926,379 people
- City population
- 573,768
- Metro
- Milwaukee-Waukesha, WI
- Population (ZIP)
- 39,996
- Household income
- $45,934
- Rent vs Own
- Severe rent burden
- 2357.0
Population outlook (Milwaukee County) Hauer SSP2
- Today (2025)
- 995,758 people
- By 2030
- 1,009,124 · +1.3%
- By 2040
- 1,028,128 · +3.3%
- By 2050
- 1,040,066 · +4.4%
- By 2075
- 1,057,849 · +6.2%
- By 2100
- 1,039,774 · +4.4%
Race, ethnicity, and origin ACS 2023
- Neighborhood character
- Predominantly Hispanic (68%)
- Race & ethnicity
- Hispanic / Latino 68% Two or more races 35% White 15% Black 11% Asian 3% Native American 1%
- Hispanic origin (detail)
- Mexican 51% Puerto Rican 13%
- Common ancestry
- Romanian 3% Portuguese 1% Lithuanian 1%
- Foreign-born
- 28% · Canada
- Languages at home
- 35% English-only · Spanish 61% Other Asian/Pacific 1%
Political lean MEDSL · Milwaukee
- 2024 margin
- Solid D (+38.5) · D 68.3% · R 29.8% · Other 1.8%
- 2008→2024 swing
- +2.7pp toward D · 2008: 35.9pp · 2024: 38.5pp
- All cycles
- 2024: D+38.5 2020: D+39.9 2016: D+37.5 2012: D+34.6 2008: D+35.9
Not yet ingested
- Civics
- —
Market trends
- HPI YoY
- ▲ 64.27%
- Current HPI
- 403.236
- Rent YoY
- ▲ 2.00%
- Metro
- Milwaukee-Waukesha, WI
- State GDP YoY
- ▲ 2.10%
- F500 in state
- 20
Industry mix (Fortune 500 HQ in WI)
| Industry | F500 HQs | Revenue |
|---|---|---|
| Industrial Machinery | 4 | $23B |
|
||
| Industrial Technology | 2 | $36B |
|
||
| Insurance | 1 | $36B |
|
||
| Professional Services | 1 | $19B |
|
||
| Utilities | 1 | $9B |
|
||
| Consumer Goods | 1 | $3B |
|
||
Price history
+272.5% since first listed11 events — show timeline
- 2026-06-01 Sold (Public Records) $130,000 Public Records
- 2026-05-29 Sold (MLS) $130,000 METROMLS
- 2026-05-22 Pending — METROMLS
- 2026-05-19 Contingent — METROMLS
- 2026-05-16 Listed $119,900 METROMLS
- 2026-05-16 Coming Soon $119,900 METROMLS
- 2013-11-23 Listing Removed — METROMLS
- 2013-11-23 Listed $25,000 METROMLS
- 2013-11-21 Sold (MLS) $25,500 METROMLS
- 1999-10-04 Sold (Public Records) $38,900 Public Records
- 1994-11-01 Sold (Public Records) $34,900 Public Records
Property tax history
+4.1%/yrLatest (2024): $2,669 · +42.4% YoY. Source: county tax records.
Cash-flow waterfall
monthlySold comps — $/sqft
last 12 mo · ≤1 miLoading sold comps…