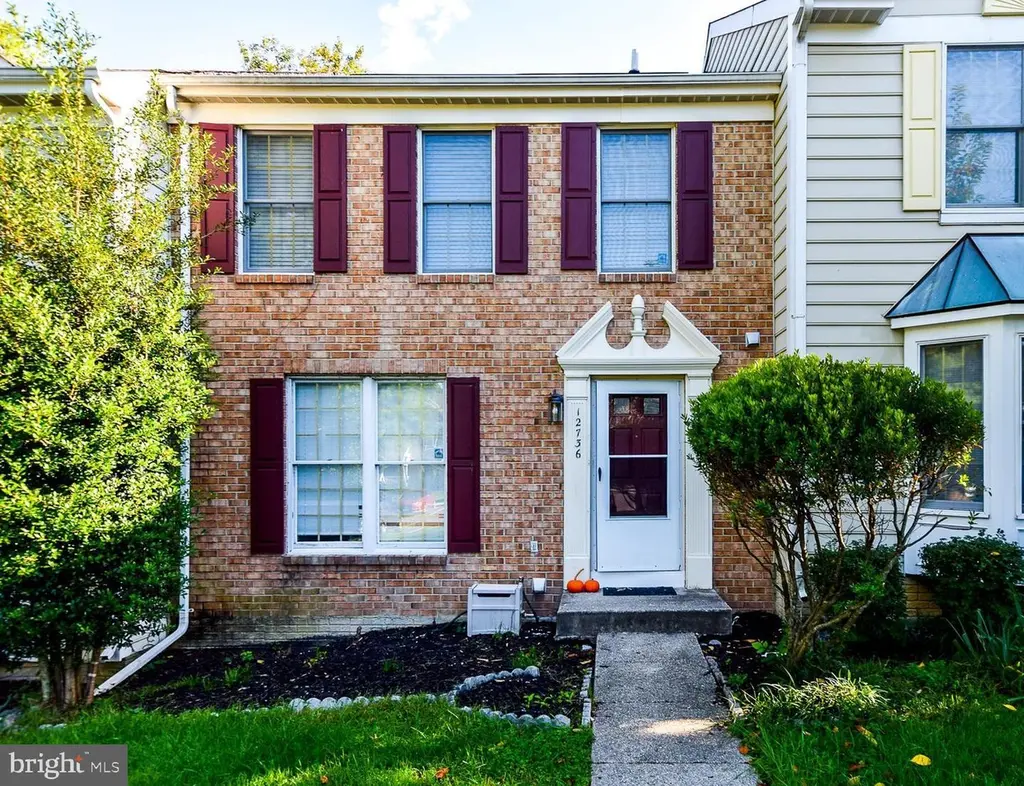
12736 Wedgedale Ct · Marlton, MD
Flood risk 1/10 · Minimal
- FEMA flood zone
- X (unshaded)
- Chance of flooding over 30 yrs
- 0.0%
- Est. flood insurance / yr
- $473 – $860
Fire risk 4/10 · Minor
- Est. fire insurance / yr
- $755 – $1,403
Heat risk 8/10 · Major
- Hot days now (above 103°F)
- 7 days/yr
- Hot days in 30 yrs
- 17 days/yr
Wind risk 5/10 · Moderate
- Chance of severe wind over 30 yrs
- 25.0%
Air-quality risk 2/10 · Minimal
- Unhealthy air days now
- 2 days/yr
- Unhealthy air days in 30 yrs
- 2 days/yr
Risk factors via First Street. Map © Google.
Why this score? — see what drove the D- grade
The composite is a weighted blend of 9 inputs, each scored 0–100. Each bar is that input's sub-score; the figure is the points it added to the 100-point composite (weight × sub-score).
- ARV discount +10.9/15.0
- Cash flow +10.3/30.0
- Rent growth +5.0/5.0
- 1% rule +3.3/10.0
- Livability +3.3/5.0
- DSCR +2.9/10.0
- Condition / age +2.5/5.0
- Schools +1.7/10.0
- Appreciation +0.0/10.0
$364,000
🖨 Deal sheet 📄 Offer letter ✓ Due diligence
Listing remarks MLS
Watch your buyer fall in love w/ this renovated 4BR 3FB 1HB townhome. Features include: updated kitchen w/ SS appliances & granite counter, hardwood floors on the main level, new carpet, fresh paint, fully finished basement, new hot water heater, new compressor, deck, fenced back yard and more!
Key facts
- Living room
- Rec room
- Utility laundry room
Tags
Neighborhood map
What this means for you Summary
Snapshot
- This is a 3-bed/3.5-bath townhouse listed at $364k.
Deal economics
- At list price, monthly cash flow is $-202 ($-2k/yr) — negative.
- To cash-flow at today's rent, offer at most $328k (9.8% below list).
- To meet the 1% rule (rent ≥ 1% of price), the offer needs to be $303k (16.8% below list).
- Recommended offer: $303k (16.8% below list) — sets the bar for 1% rule.
Location & tenants
- Location reads 66/100 on livability (#224 in MD) — a middle-class / working-renter tenant base. Strengths: employment A+, housing A+; Watch: schools D+, amenities F, commute F.
- Prince George'S County Public Schools (suburban): math 8% / reading 24% proficiency, ranked #21 of 24 in MD (top 88%) — low school quality limits family demand, transient renter base, plan for 1-2y turnover.
- Market conditions: Rents rising fast (+9.8%/yr); 309 active listings in the ZIP; 9 comparable units currently listed for rent nearby; rentals leasing fast (median 13d on market — plan ~1-2 weeks tenant-placement turnaround); high-income renter base; 1,481 units permitted in Prince George's County in 2024 (0 in 5+ unit buildings).
Forward outlook
- Local home prices are declining (-3.0%/yr); year-one equity from $3k of loan paydown is wiped out by about $11k of value loss. Plan a longer hold.
- Prince George's County population projected at +18% by 2050 — long-run rental-demand tailwind backs the buy-and-hold thesis.
Negotiation context
- It's been on market 15 days — a 2% lower offer ($359k) is reasonable based on typical stale-listing flexibility.
- 11 sale attempts since 15y ago; this cycle's ask is 16% above the opening price — seller raised mid-cycle; expect resistance to lowballs.
- Current owner paid $310k; 17% above their basis — modest negotiation headroom, anchor on the comps not their cost.
Risks & watch-outs
- Climate carrying-cost: moderate wind risk, 25% chance of damaging wind over 30y; extreme-heat days projected 7→17/yr by 2055 (HVAC capex compounding) — expect insurance premiums to compound above CPI over the hold.
Questions for the listing agent
- What do current leases actually rent for vs. the listed asking? Can we see a recent rent roll and the last 12 months of T-12 income?
- What does the HOA fee cover, when was the last increase, and are there any pending special assessments or reserve-fund shortfalls?
- Is there a deadline driving the sale (1031 exchange, divorce, estate, relocation)? That informs how much negotiation room exists.
- Schools are D-rated, which usually means shorter tenancies and higher turnover. Who's the typical renter profile here, and what's been the actual vacancy rate?
- The area grade is low — what's the realistic commute time and amenity access for the typical tenant pool here? Any planned neighborhood developments (good or bad) we should know about?
- What's the average days-on-market for RENTAL listings here right now (not sales)? A rising rental-DOM trend means longer vacancies and softer asking-rent achievability than the comps imply.
- What's the recent tenant-quality profile in this submarket — average credit score on applications, eviction rate, late-payment / NSF rate, and stable-employment percentage? A property-management company in the area should have these aggregated.
- How much new for-sale + rental construction is in the pipeline within 1–3 miles? Heavy new supply typically softens prices + rents 12–24 months out; constrained supply supports both.
Investment metrics
- 1% rule
- 0.83% ✗
- Cap rate
- 5.63%
- Cash-on-cash
- -2.38%
- DSCR
- 0.89
- GRM
- 10.0
CMA / ARV
- ARV (median comp)
- $394,100
- List price
- $364,000
- Delta
- -20.50%
- Verdict
- UNDERPRICED
- Comps
- 20 within 1.0 mi
Show comp detail 12 sales within ~0.75 mi
| Address | Dist | Beds/Ba | Sqft | Sold | Price | $/sf | Match |
|---|---|---|---|---|---|---|---|
| 12824 Town Center Way | 0.08mi | 3/2.5 | 1,504 (+4%) | 2mo | $400,000 | $266 | 85 |
| 12819 Carousel Ct | 0.11mi | 3/3.0 | 1,408 (-3%) | 9mo | $380,000 | $270 | 80 |
| 8500 Biscayne Ct | 0.26mi | 2/3.5 (-1) | 1,468 (+1%) | 4mo | $365,000 | $249 | 78 |
| 12608 Marlton Center Dr | 0.21mi | 4/3.5 (+1) | 1,374 (-5%) | 1mo | $375,000 | $273 | 75 |
| 8401 Old Colony Dr S | 0.24mi | 3/2.5 | 1,558 (+7%) | 5mo | $375,000 | $241 | 68 |
| 8603 Sweet Rose Ct | 0.29mi | 3/2.5 | 1,384 (-5%) | 8mo | $410,000 | $296 | 68 |
| 8604 Binghampton Pl | 0.30mi | 3/2.5 | 1,540 (+6%) | 6mo | $367,000 | $238 | 67 |
| 12921 Marlton Center Dr | 0.26mi | 3/2.5 | 1,360 (-6%) | 9mo | $420,000 | $309 | 65 |
| 8912 Woodstock Dr W | 0.44mi | 3/2.5 | 1,540 (+6%) | 3mo | $350,000 | $227 | 62 |
| 8636 Binghampton Pl | 0.37mi | 3/2.5 | 1,540 (+6%) | 9mo | $355,000 | $231 | 61 |
| 12528 Woodstock Dr E | 0.37mi | 4/2.5 (+1) | 1,540 (+6%) | 4mo | $325,000 | $211 | 61 |
| 9093 Florin Way | 0.49mi | 3/1.5 | 1,378 (-5%) | 1mo | $340,000 | $247 | 60 |
Match score weights: distance 35% · size 25% · config 20% · recency 20%. Top-matched comps best support the ARV.
Projected returns pro-forma
-3.0% appreciation · 8.0% rent growth · sell at horizon
- IRR
- -14.6%
- Equity multiple
- 0.45×
- Total profit
- $-55,741
- Equity at exit
- $54,274
- IRR
- 0.9%
- Equity multiple
- 1.08×
- Total profit
- $8,141
- Equity at exit
- $31,472
Cash invested: $101,920 (down + closing). Projections, not guarantees.
Landlord ↔ Tenant lean methodology
- Overall (STATE)
- 27 Tenant-Leaning
- State Maryland
- 27 Tenant-Leaning · D+14
- County
- — inherits STATE
- City
- — inherits STATE
ZIP-level market 20772
- Rents YoY
- 9.8%
- Active inventory
- 309
- Price-to-rent
- 10.0×
Monthly cashflow live
- Estimated rent
- $3,029 high interval (Pro) →
- Mortgage (P&I)
- −$1,909
- Tax from tax record
- −$459 /mo · $5,511/yr
- Insurance
- −$152
- HOA
- −$75
- Vacancy / Maint / Mgmt
- −$636
- Net cashflow
- $-202
Break-even live
UW: 25.0% down · 7.5% · 30yr · 1.5% tax · 5.0% vac · 8.0% maint · 8.0% mgmt
Financing live
Cash to close
- Down payment
- $91,000
- Closing costs
- $10,920
- Reserves months
- —
- Total cash needed
- —
Loan-product check · same deal, 3 products live
Conventional
25% down · 7.5% · 30yr
- Down + closing
- —
- Monthly P&I
- —
- Monthly cashflow
- —
- DSCR
- —
- Eligible?
- —
Personal DTI + credit; lowest rate.
DSCR
20% down · 8.5% · 30yr
- Down + closing
- —
- Monthly P&I
- —
- Monthly cashflow
- —
- DSCR
- —
- Eligible?
- —
No personal income docs; deal must DSCR.
Hard money
10% down · 12.0% · 12mo
- Down + closing
- —
- Monthly P&I
- —
- Monthly cashflow
- —
- DSCR
- —
- Eligible?
- —
Short-term bridge; refi at stabilization.
Rent comps 9 comps
| Address | Beds | Baths | Sqft | Rent | $/sqft | DOM | Units | Dist |
|---|---|---|---|---|---|---|---|---|
| 12825 Town Center Way Upper Marlboro, MD | 3.0 | 2.5 | 1854 | $2,900 | $1.56 | 43d | 1 | 0.08mi |
| 12705 Town Center Way Upper Marlboro, MD | 3.0 | 2.5 | 1240 | $2,700 | $2.18 | 18d | 1 | 0.16mi |
| 8516 Grandhaven Ave Upper Marlboro, MD | 3.0 | 2.5 | 1332 | $2,900 | $2.18 | 12d | 1 | 0.21mi |
| 12902 Woods View St Upper Marlboro, MD | 3.0 | 3.5 | 1360 | $2,695 | $1.98 | 12d | 1 | 0.29mi |
| 8605 Sweet Rose Ct Upper Marlboro, MD | 3.0 | 3.5 | 1600 | $3,200 | $2.00 | 5d | 1 | 0.31mi |
| 11904 N Marlton Ave Upper Marlboro, MD | 4.0 | 3.0 | 1444 | $2,900 | $2.01 | 12d | 1 | 0.32mi |
| 12605 Trumbull Dr Upper Marlboro, MD | 3.0 | 2.5 | 1422 | $2,500 | $1.76 | 5d | 1 | 0.47mi |
| 9023 Florin Way Upper Marlboro, MD | 3.0 | 1.5 | 1268 | $3,190 | $2.52 | 43d | 1 | 0.53mi |
| 7223 Havre Turn Upper Marlboro, MD | 2.0 | 2.0 | 1680 | $2,650 | $1.58 | 12d | 1 | 1.33mi |
HOA detail
- Monthly dues
- $75 · $900/yr
- Likely covers
- water
Listing history 44 events
-
2026-06-18days on market $364,000 Active 15 DOM
-
2026-06-17days on market $364,000 Active 14 DOM
-
2026-06-16days on market $364,000 Active 13 DOM
-
2026-06-15days on market $364,000 Active 12 DOM
-
2026-06-13days on market $364,000 Active 10 DOM
-
2026-06-10days on market $364,000 Active 6 DOM
-
2026-06-08days on market $364,000 Active 5 DOM
-
2026-06-07days on market $364,000 Active 4 DOM
-
2026-06-04remarks 699-char remark
-
2026-06-04pricestatusdays on market $364,000 Active 1 DOM
-
2026-05-05historical
-
2025-05-29status Active
-
2025-05-12status Pending
-
2025-01-29$313,300 Active
-
2020-11-06soldstatus $310,000
-
2020-10-23soldstatus $310,000 Closed 302-char remark
Show marketing remark (302 chars)
Watch your buyer fall in love w/ this renovated 4BR 3FB 1HB townhome. Features include: updated kitchen w/ SS appliances & granite counter, hardwood floors on the main level, new carpet, fresh paint, fully finished basement, new hot water heater, new compressor, deck, fenced back yard and more!
-
2020-10-06status Pending 302-char remark
Show marketing remark (302 chars)
Watch your buyer fall in love w/ this renovated 4BR 3FB 1HB townhome. Features include: updated kitchen w/ SS appliances & granite counter, hardwood floors on the main level, new carpet, fresh paint, fully finished basement, new hot water heater, new compressor, deck, fenced back yard and more!
-
2020-10-02price $310,000 302-char remark
Show marketing remark (302 chars)
Watch your buyer fall in love w/ this renovated 4BR 3FB 1HB townhome. Features include: updated kitchen w/ SS appliances & granite counter, hardwood floors on the main level, new carpet, fresh paint, fully finished basement, new hot water heater, new compressor, deck, fenced back yard and more!
-
2020-10-02status Active 302-char remark
Show marketing remark (302 chars)
Watch your buyer fall in love w/ this renovated 4BR 3FB 1HB townhome. Features include: updated kitchen w/ SS appliances & granite counter, hardwood floors on the main level, new carpet, fresh paint, fully finished basement, new hot water heater, new compressor, deck, fenced back yard and more!
-
2020-09-27historical 302-char remark
Show marketing remark (302 chars)
Watch your buyer fall in love w/ this renovated 4BR 3FB 1HB townhome. Features include: updated kitchen w/ SS appliances & granite counter, hardwood floors on the main level, new carpet, fresh paint, fully finished basement, new hot water heater, new compressor, deck, fenced back yard and more!
-
2020-09-24status Active 302-char remark
Show marketing remark (302 chars)
Watch your buyer fall in love w/ this renovated 4BR 3FB 1HB townhome. Features include: updated kitchen w/ SS appliances & granite counter, hardwood floors on the main level, new carpet, fresh paint, fully finished basement, new hot water heater, new compressor, deck, fenced back yard and more!
-
2020-09-01$315,000 302-char remark
Show marketing remark (302 chars)
Watch your buyer fall in love w/ this renovated 4BR 3FB 1HB townhome. Features include: updated kitchen w/ SS appliances & granite counter, hardwood floors on the main level, new carpet, fresh paint, fully finished basement, new hot water heater, new compressor, deck, fenced back yard and more!
-
2020-09-01historical 302-char remark
Show marketing remark (302 chars)
Watch your buyer fall in love w/ this renovated 4BR 3FB 1HB townhome. Features include: updated kitchen w/ SS appliances & granite counter, hardwood floors on the main level, new carpet, fresh paint, fully finished basement, new hot water heater, new compressor, deck, fenced back yard and more!
-
2014-02-26historical
-
2014-02-26soldstatus $207,000 Sold
-
2014-02-26soldstatus $207,000
-
2014-02-01status Contingent (No Kick Out)
-
2014-02-01historical
-
2014-01-31historical
-
2014-01-23status Active
-
2014-01-23$207,000
-
2014-01-23historical
-
2014-01-23$207,000
-
2012-02-08historical
-
2012-02-08historical
-
2011-10-17status Active
-
2011-10-16historical Expired
-
2011-08-16price
-
2011-05-10price
-
2011-05-02price
-
2011-03-16Active
-
2011-03-15$175,000
-
2005-08-16soldstatus $270,000
-
1990-11-20soldstatus $138,876
ⓘ Source: listings_history table (triggers on properties + properties_extension) + one-shot
backfill from property_details.listing_events for pre-trigger history.
Tax reassessment forecast MD · Partial reset (capped growth)
- Current annual tax
- $5,511 · $459/mo
- Projected year-2 tax
- $5,511 · $459/mo
- Expected delta
- $0/yr ($0/mo · 0.0%)
ⓘ Screening estimate from a state-policy table — verify with the county assessor before closing.
Climate risk First Street
- Flood 1/10 Low FEMA zone X (unshaded) · 0% chance over 30 yrs
- Wildfire 4/10 Moderate
- Heat 8/10 Severe 7 d/yr ≥103°F today · 17 d/yr by 30 yrs out
- Wind 5/10 Major 25% chance of damaging wind over 30 yrs
- Air quality 2/10 Low 2 unhealthy d/yr today · 2 by 30 yrs out
Nearby sold comps map
Loading sold comps map…
Walkable amenities ~0.75 mi
Loading nearby amenities…
Taxation est. · year 1
- Rental income
- $36,347
- − Mortgage interest
- −$20,390
- − Property taxes
- −$5,511
- − Insurance
- −$1,820
- − Repairs & maintenance
- −$2,908
- − Management
- −$2,908
- − HOA
- −$900
- − Depreciation
- −$10,589
- Taxable loss
- −$8,678
- Est. tax savings @ 24.0%
- +$2,083
- After-tax cash flow
- $-340/yr
For passive investors: Depreciation is non-cash, so a rental often shows a tax loss while cash-flowing — sheltering income. Rental losses are passive: they offset passive income freely, and up to $25,000/yr can offset ordinary (W-2) income if you actively participate and your MAGI is under $100k (phasing out to $0 by $150k); unused losses carry forward. On sale, claimed depreciation is recaptured at up to 25%, and gains may owe capital-gains tax (a 1031 exchange can defer both). Figures are a year-1 estimate at your 24.0% rate — not tax advice; consult a CPA.
Schools (NCES district)
- District
- Prince George'S County Public Schools
- NCES district ID
- 2400510
- Math proficiency
- 8% ▼ -11.00%
- Reading proficiency
- 24% ▼ -9.00%
- Median HH income
- $73,967
- Composite
- 16.82/100
- National rank
- #9151
- State rank
- #21 of 24 in MD
Livability — Marlton
- Score
- 66/100
- State rank
- #224
- US rank
- #11234
Category grades
Schools grade is shown separately in the Schools card above.
Census & demographics
- Census place
- Marlton, MD
- County
- Prince Georges County · 919,866 people
- Metro
- Washington-Arlington-Alexandria, DC-VA-MD-WV
- Population (ZIP)
- 54,319
- Household income
- $139,403
- Rent vs Own
- Severe rent burden
- 524.0
Population outlook (Prince George's County) Hauer SSP2
- Today (2025)
- 1,005,426 people
- By 2030
- 1,048,416 · +4.3%
- By 2040
- 1,123,425 · +11.7%
- By 2050
- 1,183,220 · +17.7%
- By 2075
- 1,306,202 · +29.9%
- By 2100
- 1,408,179 · +40.1%
Race, ethnicity, and origin ACS 2023
- Neighborhood character
- Predominantly Black (78%)
- Race & ethnicity
- Black 78% White 10% Hispanic / Latino 7% Two or more races 5% Asian 1%
- Hispanic origin (detail)
- Mexican 1%
- Foreign-born
- 10% · Canada, China
- Languages at home
- 88% English-only · Spanish 5% French/Haitian/Cajun 1% Other Indo-European 1%
Political lean MEDSL · Prince George's
- 2024 margin
- Solid D (+75.2) · D 86.3% · R 11.2% · Other 2.5%
- 2008→2024 swing
- -3.3pp toward R · 2008: 78.5pp · 2024: 75.2pp
- All cycles
- 2024: D+75.2 2020: D+80.5 2016: D+81.0 2012: D+80.9 2008: D+78.5
Not yet ingested
- Civics
- —
Market trends
- HPI YoY
- ▼ -184.63%
- Current HPI
- 251.8236
- Rent YoY
- ▲ 9.80%
- Metro
- Washington-Arlington-Alexandria, DC-VA-MD-WV
- State GDP YoY
- ▲ 2.97%
- F500 in state
- 12
Industry mix (Fortune 500 HQ in MD)
| Industry | F500 HQs | Revenue |
|---|---|---|
| Aerospace / Defense | 1 | $71B |
|
||
| Utilities | 1 | $25B |
|
||
| Hotels | 1 | $24B |
|
||
| Consumer Goods | 1 | $7B |
|
||
| Real Estate | 1 | $6B |
|
||
| Chemicals | 1 | $2B |
|
||
Price history
+125.6% since first listed34 events — show timeline
- 2026-05-05 Listing Removed — BRIGHT MLS
- 2025-05-29 Relisted — BRIGHT MLS
- 2025-05-12 Pending — BRIGHT MLS
- 2025-01-29 Listed $313,300 BRIGHT MLS
- 2020-11-06 Sold (Public Records) $310,000 Public Records
- 2020-10-23 Sold (MLS) $310,000 BRIGHT MLS
- 2020-10-06 Pending — BRIGHT MLS
- 2020-10-02 Price Changed $310,000 BRIGHT MLS
- 2020-10-02 Relisted — BRIGHT MLS
- 2020-09-27 Listing Removed — BRIGHT MLS
- 2020-09-24 Relisted — BRIGHT MLS
- 2020-09-01 Listing Removed — BRIGHT MLS
- 2020-09-01 Listed $315,000 BRIGHT MLS
- 2014-02-26 Delisted — MRIS
- 2014-02-26 Sold (MLS) $207,000 BRIGHT MLS
- 2014-02-26 Sold (MLS) $207,000 MRIS
- 2014-02-01 Pending — MRIS
- 2014-02-01 Delisted — MRIS
- 2014-01-31 Listing Removed — BRIGHT MLS
- 2014-01-23 Relisted — MRIS
- 2014-01-23 Listed $207,000 BRIGHT MLS
- 2014-01-23 Delisted — MRIS
- 2014-01-23 Listed $207,000 MRIS
- 2012-02-08 Delisted — MRIS
- 2012-02-08 Listing Removed — BRIGHT MLS
- 2011-10-17 Relisted — MRIS
- 2011-10-16 Delisted — MRIS
- 2011-08-16 Price Changed — MRIS
- 2011-05-10 Price Changed — MRIS
- 2011-05-02 Price Changed — MRIS
- 2011-03-16 Listed — MRIS
- 2011-03-15 Listed $175,000 BRIGHT MLS
- 2005-08-16 Sold (Public Records) $270,000 Public Records
- 1990-11-20 Sold (Public Records) $138,876 Public Records
Property tax history
+6.2%/yrLatest (2025): $5,511 · +9.9% YoY. Source: county tax records.
Cash-flow waterfall
monthlySold comps — $/sqft
last 12 mo · ≤1 miLoading sold comps…