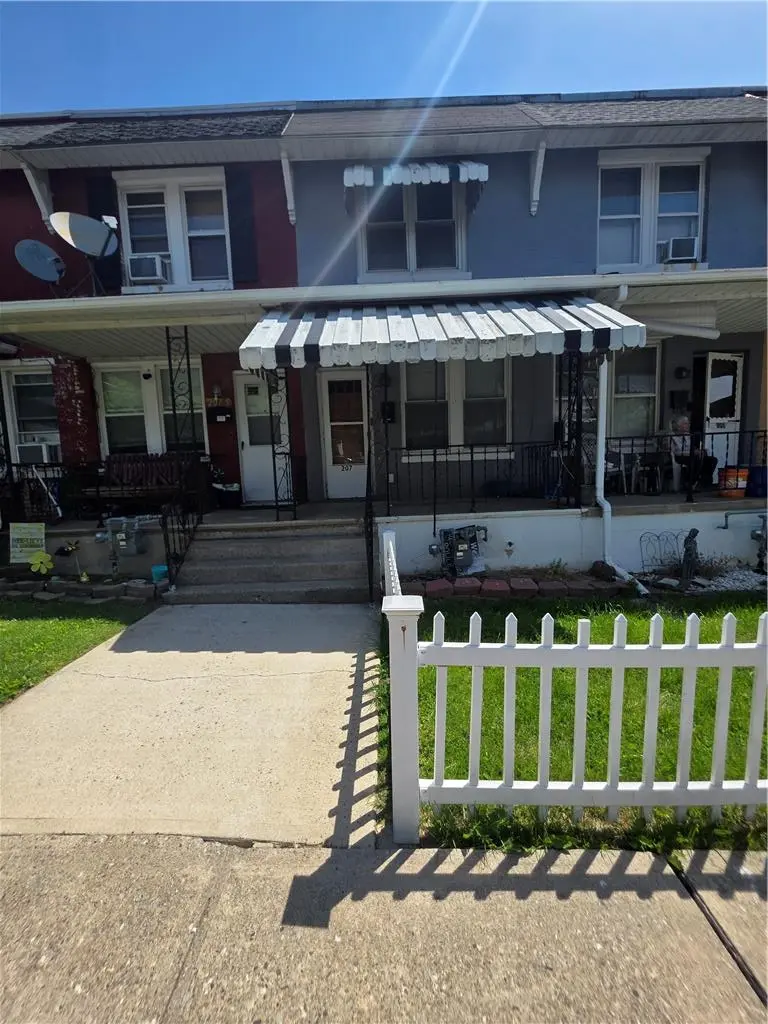
207 Clearfield St · Freemansburg, PA
Flood risk 1/10 · Minimal
- FEMA flood zone
- X (unshaded)
- Chance of flooding over 30 yrs
- 0.0%
- Est. flood insurance / yr
- $473 – $860
Fire risk 3/10 · Minor
- Est. fire insurance / yr
- $511 – $949
Heat risk 5/10 · Moderate
- Hot days now (above 100°F)
- 7 days/yr
- Hot days in 30 yrs
- 15 days/yr
Wind risk 4/10 · Minor
- Chance of severe wind over 30 yrs
- 20.0%
Air-quality risk 3/10 · Minor
- Unhealthy air days now
- 3 days/yr
- Unhealthy air days in 30 yrs
- 4 days/yr
Risk factors via First Street. Map © Google.
Why this score? — see what drove the B+ grade
The composite is a weighted blend of 9 inputs, each scored 0–100. Each bar is that input's sub-score; the figure is the points it added to the 100-point composite (weight × sub-score).
- Cash flow +30.0/30.0
- ARV discount +15.0/15.0
- 1% rule +10.0/10.0
- DSCR +10.0/10.0
- Livability +4.0/5.0
- Schools +3.5/10.0
- Rent growth +3.2/5.0
- Condition / age +2.5/5.0
- Appreciation +0.0/10.0
$115,000
🖨 Deal sheet 📄 Offer letter ✓ Due diligence
Listing remarks MLS
Wonderful opportunity to own a bright and spacious home located near major access routes, shopping and dining. The kitchen and bathroom are updated and modern. Newer windows, a walk-in closet adjacent to the master bedroom, mud room, covered front and back porch. The home features hardwood floors and a finished basement. Don't miss this great opportunity for a first-time home buyer or investor.
Key facts
- Efficient gas heat
- Built 1900
- Listed 3 days
Tags
Property features AI
Exterior
- Parking: On-street parking
- Utilities: Public water; Public sewer
- Home design: Two-story home
- Construction: Brick and wood siding exterior; Asphalt/fiberglass roof; Block foundation; Originally built area above grade listed as 900
- Exterior features: Public records list the lot as approximately 1,440 sq ft
Interior
- Kitchen: Gas oven and gas range; Refrigerator
- Bedrooms: Two bedrooms on the second floor (9 x 8 and 13 x 11)
- Bathrooms: One full bathroom (on the second floor)
- Heating & cooling: Gas heating
- Interior features: Dining area and a separate/formal dining room; Full exterior-entry basement
- Laundry & utility: First-floor laundry room (10 x 6); Electric water heater
Neighborhood map
What this means for you Summary
Snapshot
- This is a 2-bed/1.0-bath townhouse listed at $115k.
Deal economics
- At list price, monthly cash flow is $625 ($7k/yr) — positive.
- The deal already cash-flows at list — no discount required.
- Meets the 1% rule at list price ($2k rent vs $115k).
Location & tenants
- Location reads 79/100 on livability (#244 in PA, #2,082 nationally) — a middle-class / working-renter tenant base. Strengths: crime A+, housing A+, health & safety A+; Watch: amenities D, schools F, commute F.
- Bethlehem Area SD (urban): math 31% / reading 49% proficiency, ranked #342 of 539 in PA (top 64%) — families likely to look elsewhere, expect single-tenant / working-renter base with shorter leases.
- Market conditions: Rents rising (+2.6%/yr); 153 active listings in the ZIP; 23 comparable units currently listed for rent nearby; rentals at typical pace (median 15d on market — plan ~3-4 weeks tenant-placement turnaround); solid renter incomes; 567 units permitted in Northampton County in 2024 (151 in 5+ unit buildings).
Forward outlook
- Local home prices are declining (-3.0%/yr); year-one equity from $795 of loan paydown is wiped out by about $3k of value loss. Plan a longer hold.
- At projected returns (-3.0% appreciation + 2.6% rent growth), your $32k cash investment doubles in ~6 years — after that, you're playing with house money.
Negotiation context
- Only 3 days on market — expect competitive offers; lowballing is unlikely to land.
- 4 sale attempts since 19y ago with the ask held roughly flat each time — persistent listings suggest the price (not the market) is what's stuck; bring a comps-based counter.
- Current owner paid $45k; list at $115k implies a 156% gain — meaningful room to come down on a strong offer.
Risks & watch-outs
- Watch-outs: built in 1900 — expect roof / HVAC / electrical / plumbing capex.
- Climate carrying-cost: extreme-heat days projected 7→15/yr by 2055 (HVAC capex compounding) — expect insurance premiums to compound above CPI over the hold.
Questions for the listing agent
- Built in 1900 — when were the roof, HVAC, electrical panel, plumbing, and water heater last replaced?
- Is there a deadline driving the sale (1031 exchange, divorce, estate, relocation)? That informs how much negotiation room exists.
- Schools are F-rated, which usually means shorter tenancies and higher turnover. Who's the typical renter profile here, and what's been the actual vacancy rate?
- What's the average days-on-market for RENTAL listings here right now (not sales)? A rising rental-DOM trend means longer vacancies and softer asking-rent achievability than the comps imply.
- What's the recent tenant-quality profile in this submarket — average credit score on applications, eviction rate, late-payment / NSF rate, and stable-employment percentage? A property-management company in the area should have these aggregated.
- How much new for-sale + rental construction is in the pipeline within 1–3 miles? Heavy new supply typically softens prices + rents 12–24 months out; constrained supply supports both.
Investment metrics
- 1% rule
- 1.62% ✓
- Cap rate
- 12.81%
- Cash-on-cash
- 23.28%
- DSCR
- 2.04
- GRM
- 5.1
CMA / ARV
- ARV (on-the-fly)
- $167,508
- Comps found
- 11
Show comp detail 11 sales within ~0.75 mi
| Address | Dist | Beds/Ba | Sqft | Sold | Price | $/sf | Match |
|---|---|---|---|---|---|---|---|
| 218 Clearfield St | 0.03mi | 2/1.0 | 846 (0%) | 2mo | $161,900 | $191 | 97 |
| 220 Clearfield St | 0.03mi | 2/1.0 | 846 (0%) | 8mo | $175,000 | $207 | 92 |
| 234 Clearfield St | 0.05mi | 2/1.0 | 822 (-3%) | 1mo | $162,500 | $198 | 92 |
| 203 Clearfield St | 0.01mi | 2/1.0 | 846 (0%) | 13mo | $165,000 | $195 | 89 |
| 210 Clearfield St | 0.02mi | 3/1.0 (+1) | 878 (+4%) | 1mo | $175,000 | $199 | 87 |
| 211-1/2 Clearfield St | 0.01mi | 2/2.0 | 846 (0%) | 15mo | $185,000 | $219 | 83 |
| 225 Clearfield St | 0.03mi | 2/1.0 | 846 (0%) | 20mo | $160,000 | $189 | 82 |
| 208 Clearfield St | 0.02mi | 2/1.0 | 890 (+5%) | 16mo | $185,000 | $208 | 77 |
| 236 Clearfield St | 0.06mi | 2/1.0 | 822 (-3%) | 21mo | $160,000 | $195 | 76 |
| 222 Juniata St | 0.04mi | 2/1.0 | 936 (+11%) | 22mo | $185,000 | $198 | 62 |
| 1515 Livingston St | 0.73mi | 3/1.0 (+1) | 840 (-1%) | 20mo | $225,000 | $268 | 43 |
Match score weights: distance 35% · size 25% · config 20% · recency 20%. Top-matched comps best support the ARV.
Projected returns pro-forma
-3.0% appreciation · 2.6% rent growth · sell at horizon
- IRR
- 15.9%
- Equity multiple
- 1.64×
- Total profit
- $20,465
- Equity at exit
- $17,147
- IRR
- 24.2%
- Equity multiple
- 3.06×
- Total profit
- $66,258
- Equity at exit
- $9,943
Cash invested: $32,200 (down + closing). Projections, not guarantees.
Landlord ↔ Tenant lean methodology
- Overall (STATE)
- 62 Landlord-Friendly
- State Pennsylvania
- 62 Landlord-Friendly · EVEN
- County
- — inherits STATE
- City
- — inherits STATE
ZIP-level market 18017
- Rents YoY
- 2.6%
- Active inventory
- 153
- Price-to-rent
- 5.1×
Monthly cashflow live
- Estimated rent
- $1,864 high interval (Pro) →
- Mortgage (P&I)
- −$603
- Tax from tax record
- −$197 /mo · $2,362/yr
- Insurance
- −$48
- HOA
- −$0
- Vacancy / Maint / Mgmt
- −$391
- Net cashflow
- $625
Break-even live
UW: 25.0% down · 7.5% · 30yr · 1.5% tax · 5.0% vac · 8.0% maint · 8.0% mgmt
Financing live
Cash to close
- Down payment
- $28,750
- Closing costs
- $3,450
- Reserves months
- —
- Total cash needed
- —
Loan-product check · same deal, 3 products live
Conventional
25% down · 7.5% · 30yr
- Down + closing
- —
- Monthly P&I
- —
- Monthly cashflow
- —
- DSCR
- —
- Eligible?
- —
Personal DTI + credit; lowest rate.
DSCR
20% down · 8.5% · 30yr
- Down + closing
- —
- Monthly P&I
- —
- Monthly cashflow
- —
- DSCR
- —
- Eligible?
- —
No personal income docs; deal must DSCR.
Hard money
10% down · 12.0% · 12mo
- Down + closing
- —
- Monthly P&I
- —
- Monthly cashflow
- —
- DSCR
- —
- Eligible?
- —
Short-term bridge; refi at stabilization.
Rent comps 23 comps
| Address | Beds | Baths | Sqft | Rent | $/sqft | DOM | Units | Dist |
|---|---|---|---|---|---|---|---|---|
| 214 Clearfield St Freemansburg, PA | 3.0 | 1.0 | 966 | $1,700 | $1.76 | 3d | 1 | 0.04mi |
| 315 Clearfield St Freemansburg, PA | 2.0 | 1.0 | 1040 | $2,000 | $1.92 | 3d | 1 | 0.09mi |
| 315 Clearfield St Unit A Freemansburg, PA | 2.0 | 1.0 | 1040 | $2,000 | $1.92 | 3d | 1 | 0.09mi |
| 321 Monroe St Freemansburg, PA | 1.0 | 1.0 | 700 | $1,418 | $2.03 | 3d | 1 | 0.28mi |
| 1416 Livingston St Bethlehem, PA | 1.0–4.0 | 1.0–2.0 | 1002 | $1,741 | $1.74 | 3d | 20 | 0.58mi |
| 1130 Pembroke Rd Unit 2 Bethlehem, PA | 2.0 | 1.0 | 750 | $1,750 | $2.33 | 44d | 1 | 0.62mi |
| 650 E North St Bethlehem, PA | 2.0 | 1.0–2.0 | 935 | $2,350 | $2.51 | 14d | 7 | 1.04mi |
| 410 William St Unit 102 Bethlehem, PA | 1.0 | 1.0 | 760 | $1,650 | $2.17 | 14d | 1 | 1.13mi |
| 410 William St #204 Bethlehem, PA | 1.0 | 1.0 | 760 | $1,695 | $2.23 | 14d | 1 | 1.13mi |
| 410 William St Unit 102 Bethlehem, PA | 1.0 | 1.0 | 760 | $1,695 | $2.23 | 23d | 1 | 1.13mi |
| 1306 E 4th St #3 Bethlehem, PA | 2.0 | 1.0 | 1000 | $1,550 | $1.55 | 44d | 1 | 1.16mi |
| 1630 E 9th St Bethlehem, PA | 2.0 | 1.0 | 750 | $1,750 | $2.33 | 14d | 1 | 1.20mi |
| 1348 E 6th St Fl Rear Bethlehem, PA | 1.0 | 1.0 | 800 | $1,350 | $1.69 | 14d | 1 | 1.24mi |
| 3203 Washington St Bethlehem, PA | 1.0 | 1.0 | 654 | $1,800 | $2.75 | 3d | 1 | 1.25mi |
| 1218 Mechanic St Unit 5 Bethlehem, PA | 1.0 | 1.0 | 750 | $1,200 | $1.60 | 23d | 1 | 1.25mi |
| 1209 Mechanic St Bethlehem, PA | 3.0 | 1.0 | 1003 | $2,000 | $1.99 | 21d | 1 | 1.25mi |
| 1201 E 4th St Unit 4 Bethlehem, PA | 3.0 | 1.5 | 1100 | $1,800 | $1.64 | 44d | 1 | 1.28mi |
| 401 E Goepp St #2 Bethlehem, PA | 2.0 | 1.0 | 750 | $1,875 | $2.50 | 23d | 1 | 1.35mi |
| 330 E Goepp St Unit 1 Bethlehem, PA | 1.0 | 1.0 | 714 | $1,500 | $2.10 | 14d | 1 | 1.38mi |
| 1113 E 4th St Unit 1 Bethlehem, PA | 2.0 | 1.0 | 1000 | $1,350 | $1.35 | 23d | 1 | 1.40mi |
| 746 Linden St Unit 2 Bethlehem, PA | 3.0 | 1.0 | 1008 | $1,975 | $1.96 | 44d | 1 | 1.43mi |
| 708 Linden St Unit 2 Bethlehem, PA | 2.0 | 1.0 | 800 | $1,500 | $1.88 | 14d | 1 | 1.44mi |
| 315 State St Unit 2 Bethlehem, PA | 1.0 | 1.0 | 900 | $1,200 | $1.33 | 3d | 1 | 1.45mi |
Listing history 12 events
-
2026-06-01status $115,000 Pending 3 DOM
-
2026-05-31days on market $115,000 Active 3 DOM
-
2026-05-31days on market $115,000 Active 2 DOM
-
2026-05-28$115,000 Active
-
2013-03-05soldstatus $45,000
-
2013-02-21soldstatus $45,000 400-char remark
Show marketing remark (400 chars)
Wonderful opportunity to own a bright and spacious home located near major access routes, shopping and dining. The kitchen and bathroom are updated and modern. Newer windows, a walk-in closet adjacent to the master bedroom, mud room, covered front and back porch. The home features hardwood floors and a finished basement. Don't miss this great opportunity for a first-time home buyer or investor.
-
2012-08-27$63,000 400-char remark
Show marketing remark (400 chars)
Wonderful opportunity to own a bright and spacious home located near major access routes, shopping and dining. The kitchen and bathroom are updated and modern. Newer windows, a walk-in closet adjacent to the master bedroom, mud room, covered front and back porch. The home features hardwood floors and a finished basement. Don't miss this great opportunity for a first-time home buyer or investor.
-
2012-08-25historical
-
2012-02-25$49,000
-
2007-12-21soldstatus $83,700
-
2007-10-29$79,900
-
2002-11-05soldstatus $43,300
ⓘ Source: listings_history table (triggers on properties + properties_extension) + one-shot
backfill from property_details.listing_events for pre-trigger history.
Tax reassessment forecast PA · Partial reset (capped growth)
- Current annual tax
- $2,362 · $197/mo
- Projected year-2 tax
- $2,362 · $197/mo
- Expected delta
- $0/yr ($0/mo · 0.0%)
ⓘ Screening estimate from a state-policy table — verify with the county assessor before closing.
Climate risk First Street
- Flood 1/10 Low FEMA zone X (unshaded) · 0% chance over 30 yrs
- Wildfire 3/10 Moderate
- Heat 5/10 Major 7 d/yr ≥100°F today · 15 d/yr by 30 yrs out
- Wind 4/10 Moderate 20% chance of damaging wind over 30 yrs
- Air quality 3/10 Moderate 3 unhealthy d/yr today · 4 by 30 yrs out
Nearby sold comps map
Loading sold comps map…
Walkable amenities ~0.75 mi
Loading nearby amenities…
Taxation est. · year 1
- Rental income
- $22,367
- − Mortgage interest
- −$6,442
- − Property taxes
- −$2,362
- − Insurance
- −$575
- − Repairs & maintenance
- −$1,789
- − Management
- −$1,789
- − Depreciation
- −$3,345
- Taxable income
- $6,064
- Est. tax owed @ 24.0%
- −$1,455
- After-tax cash flow
- $6,041/yr
For passive investors: Depreciation is non-cash, so a rental often shows a tax loss while cash-flowing — sheltering income. Rental losses are passive: they offset passive income freely, and up to $25,000/yr can offset ordinary (W-2) income if you actively participate and your MAGI is under $100k (phasing out to $0 by $150k); unused losses carry forward. On sale, claimed depreciation is recaptured at up to 25%, and gains may owe capital-gains tax (a 1031 exchange can defer both). Figures are a year-1 estimate at your 24.0% rate — not tax advice; consult a CPA.
Schools (NCES district)
- District
- Bethlehem Area SD
- NCES district ID
- 4203570
- Math proficiency
- 31% ▼ -2.00%
- Reading proficiency
- 49% ▼ -6.00%
- Median HH income
- $55,124
- Composite
- 34.92/100
- National rank
- #5068
- State rank
- #342 of 539 in PA
Livability — Freemansburg
- Score
- 79/100
- State rank
- #244
- US rank
- #2082
Category grades
Schools grade is shown separately in the Schools card above.
Census & demographics
- Census place
- Freemansburg, PA
- County
- Northampton County · 236,814 people
- Metro
- Allentown-Bethlehem-Easton, PA-NJ
- Population (ZIP)
- 40,640
- Household income
- $91,173
- Rent vs Own
- Severe rent burden
- 950.0
Population outlook (Northampton County) Hauer SSP2
- Today (2025)
- 312,227 people
- By 2030
- 314,769 · +0.8%
- By 2040
- 316,914 · +1.5%
- By 2050
- 318,037 · +1.9%
- By 2075
- 334,003 · +7.0%
- By 2100
- 344,696 · +10.4%
Race, ethnicity, and origin ACS 2023
- Neighborhood character
- Majority White (64%)
- Race & ethnicity
- White 64% Hispanic / Latino 25% Two or more races 14% Black 5% Asian 4%
- Hispanic origin (detail)
- Puerto Rican 16% Dominican 4%
- Common ancestry
- Romanian 4% Polish 2% Lithuanian 1%
- Foreign-born
- 10% · Canada, China, Vietnam
- Languages at home
- 77% English-only · Spanish 15% Other Indo-European 2% French/Haitian/Cajun 1%
Political lean MEDSL · Northampton
- 2024 margin
- Toss-up / Even · D 48.6% · R 50.4%
- 2008→2024 swing
- -14.1pp toward R · 2008: 12.3pp · 2024: -1.8pp
- All cycles
- 2024: R+1.8 2020: D+0.7 2016: R+3.8 2012: D+4.6 2008: D+12.3
Not yet ingested
- Civics
- —
Market trends
- HPI YoY
- ▼ -218.92%
- Current HPI
- 203.0358
- Rent YoY
- ▲ 2.60%
- Metro
- Allentown-Bethlehem-Easton, PA-NJ
- State GDP YoY
- ▲ 1.68%
- F500 in state
- 34
Industry mix (Fortune 500 HQ in PA)
| Industry | F500 HQs | Revenue |
|---|---|---|
| Healthcare | 2 | $309B |
|
||
| Insurance | 2 | $27B |
|
||
| Telecommunications / Media | 1 | $124B |
|
||
| Industrial Distribution | 1 | $22B |
|
||
| Financial Services | 1 | $20B |
|
||
| Chemicals / Materials | 1 | $18B |
|
||
Price history
+165.6% since first listed9 events — show timeline
- 2026-05-28 Listed $115,000 GLVRMLS
- 2013-03-05 Sold (Public Records) $45,000 Public Records
- 2013-02-21 Sold (MLS) $45,000 GLVRMLS
- 2012-08-27 Listed $63,000 GLVRMLS
- 2012-08-25 Listing Removed — GLVRMLS
- 2012-02-25 Listed $49,000 GLVRMLS
- 2007-12-21 Sold (MLS) $83,700 GLVRMLS
- 2007-10-29 Listed $79,900 GLVRMLS
- 2002-11-05 Sold (Public Records) $43,300 Public Records
Property tax history
+1.6%/yrLatest (2026): $2,362 · +5.2% YoY. Source: county tax records.
Cash-flow waterfall
monthlySold comps — $/sqft
last 12 mo · ≤1 miLoading sold comps…