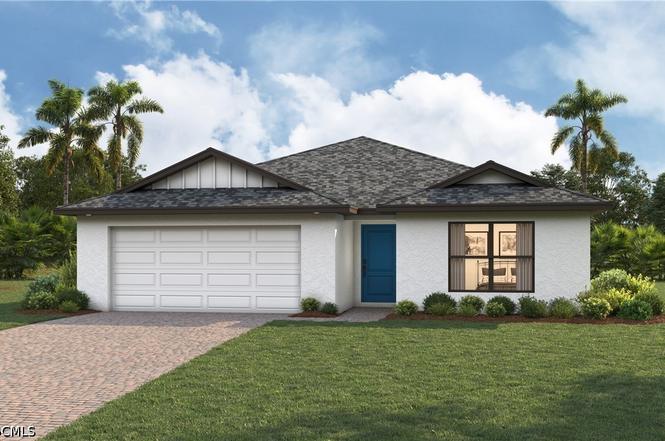
734 Brazos St E · Lehigh Acres, FL
Flood risk No data
- FEMA flood zone
- —
- Chance of flooding over 30 yrs
- —
- Est. flood insurance / yr
- —
Fire risk No data
- Est. fire insurance / yr
- —
Heat risk No data
- Hot days now (above threshold)
- —
- Hot days in 30 yrs
- —
Wind risk No data
- Chance of severe wind over 30 yrs
- —
Air-quality risk No data
- Unhealthy air days now
- —
- Unhealthy air days in 30 yrs
- —
Risk factors via First Street. Map © Google.
Why this score? — see what drove the D+ grade
The composite is a weighted blend of 9 inputs, each scored 0–100. Each bar is that input's sub-score; the figure is the points it added to the 100-point composite (weight × sub-score).
- ARV discount +13.7/15.0
- Appreciation +10.0/10.0
- Cash flow +7.2/30.0
- Schools +4.1/10.0
- Livability +3.0/5.0
- Condition / age +2.5/5.0
- 1% rule +2.0/10.0
- DSCR +1.3/10.0
- Rent growth +1.3/5.0
$293,700
🖨 Deal sheet 📄 Offer letter ✓ Due diligence
Listing remarks
As one of Southwest Florida's most affordable real estate markets, Lehigh Acres is home to national and local businesses, championship golf courses, minutes from the Boston Red Sox spring training home at JetBlue Park, 12 miles from historic downtown Fort Myers and close to Gulf of Mexico beaches. DRE# 175519667
Key facts
- 2 garage spots
- Built 2026
- Listed 119 days
Property features AI
Finance
- Financial info: Listing price $293,700
Exterior
- Parking: 2 covered garage spaces (2 total parking spaces)
- Home design: Single-family property (spec build)
- Exterior features: Living area of 1,550
Interior
- Bedrooms: 3 bedrooms
- Bathrooms: 2 full bathrooms
- Interior features: Spec home (Palm plan)
Neighborhood map
What this means for you Summary
Snapshot
- This is a 3-bed/2.0-bath single-family listed at $294k.
Deal economics
- At list price, monthly cash flow is $-410 ($-5k/yr) — negative.
- To cash-flow at today's rent, offer at most $234k (20.2% below list).
- To meet the 1% rule (rent ≥ 1% of price), the offer needs to be $205k (30.2% below list).
- Recommended offer: $205k (30.2% below list) — sets the bar for 1% rule.
Location & tenants
- Location reads 59/100 on livability (#826 in FL) — a working-class tenant base; expect higher turnover. Strengths: cost of living A+, housing A+; Watch: crime C-, employment D+, schools D-.
- Lee (suburban): math 47% / reading 50% proficiency, ranked #42 of 73 in FL (top 58%) — families likely to look elsewhere, expect single-tenant / working-renter base with shorter leases.
- Market conditions: Rents falling (-4.7%/yr); 2460 active listings in the ZIP; 40 comparable units currently listed for rent nearby; rentals at typical pace (median 21d on market — plan ~3-4 weeks tenant-placement turnaround); 15,411 units permitted in Lee County in 2024 (4,686 in 5+ unit buildings).
- This rent runs 34% of the median local income ($72k/yr) — at the standard rent-burdened threshold; future hikes will face affordability resistance.
Forward outlook
- In year one you build about $31k of equity ($2k loan paydown + $29k appreciation (10.0% local appreciation)).
- Lee County population projected at +44% by 2050 — long-run rental-demand tailwind backs the buy-and-hold thesis.
- By year 2, paydown + projected appreciation supports a ~$50k cash-out refi (75% LTV) — recoverable capital for the next deal without selling this one.
Negotiation context
- It's been on market 120 days — a 9% lower offer ($267k) is reasonable based on typical stale-listing flexibility.
Questions for the listing agent
- What do current leases actually rent for vs. the listed asking? Can we see a recent rent roll and the last 12 months of T-12 income?
- It's been on market 120 days. Have you received any prior offers? Is the seller open to a 30% concession, seller financing, or rate buy-down credit?
- Why hasn't it sold? Are there any deal-killer items the seller is aware of (foundation, flood, title, zoning, code violations)?
- Is there a deadline driving the sale (1031 exchange, divorce, estate, relocation)? That informs how much negotiation room exists.
- Schools are D-rated, which usually means shorter tenancies and higher turnover. Who's the typical renter profile here, and what's been the actual vacancy rate?
- The area grade is low — what's the realistic commute time and amenity access for the typical tenant pool here? Any planned neighborhood developments (good or bad) we should know about?
- What's the average days-on-market for RENTAL listings here right now (not sales)? A rising rental-DOM trend means longer vacancies and softer asking-rent achievability than the comps imply.
- What's the recent tenant-quality profile in this submarket — average credit score on applications, eviction rate, late-payment / NSF rate, and stable-employment percentage? A property-management company in the area should have these aggregated.
- How much new for-sale + rental construction is in the pipeline within 1–3 miles? Heavy new supply typically softens prices + rents 12–24 months out; constrained supply supports both.
Investment metrics
- 1% rule
- 0.70% ✗
- Cap rate
- 4.62%
- Cash-on-cash
- -5.99%
- DSCR
- 0.73
- GRM
- 11.9
CMA / ARV
- ARV (on-the-fly)
- $341,000
- Comps found
- 12
Show comp detail 12 sales within ~0.75 mi
| Address | Dist | Beds/Ba | Sqft | Sold | Price | $/sf | Match |
|---|---|---|---|---|---|---|---|
| 756 Anaconda Ave S | 0.29mi | 3/2.0 | 1,562 (+1%) | 12mo | $395,000 | $253 | 76 |
| 712 Clemwood Ave S | 0.18mi | 3/3.0 | 1,500 (-3%) | 9mo | $318,000 | $212 | 75 |
| 789 Bell Blvd S | 0.25mi | 4/2.0 (+1) | 1,677 (+8%) | 10mo | $80,000 | $48 | 61 |
| 734 Fleming Ave S | 0.45mi | 3/2.0 | 1,477 (-5%) | 12mo | $289,990 | $196 | 61 |
| 812 Jaguar Blvd | 0.46mi | 3/2.0 | 1,410 (-9%) | 10mo | $325,000 | $230 | 55 |
| 810 Jaguar Blvd | 0.45mi | 4/2.0 (+1) | 1,650 (+6%) | 10mo | $375,000 | $227 | 55 |
| 814 Jaguar Blvd | 0.47mi | 4/2.0 (+1) | 1,650 (+6%) | 10mo | $363,000 | $220 | 54 |
| 849 Bently St E | 0.67mi | 3/2.0 | 1,670 (+8%) | 7mo | $300,000 | $180 | 50 |
| 732 Newhall St E | 0.61mi | 4/3.0 (+1) | 1,452 (-6%) | 2mo | $325,000 | $224 | 50 |
| 744 Goodrich Ave S | 0.51mi | 3/2.0 | 1,727 (+11%) | 12mo | $325,000 | $188 | 48 |
| 836 Dawhert Ave S | 0.64mi | 3/2.0 | 1,757 (+13%) | 9mo | $250,000 | $142 | 40 |
| 841 Bently St E | 0.61mi | 3/3.0 | 1,735 (+12%) | 14mo | $395,000 | $228 | 36 |
Match score weights: distance 35% · size 25% · config 20% · recency 20%. Top-matched comps best support the ARV.
Projected returns pro-forma
10.0% appreciation · 0.0% rent growth · sell at horizon
- IRR
- 19.2%
- Equity multiple
- 2.55×
- Total profit
- $127,842
- Equity at exit
- $264,588
- IRR
- 17.2%
- Equity multiple
- 5.70×
- Total profit
- $386,335
- Equity at exit
- $570,595
Cash invested: $82,236 (down + closing). Projections, not guarantees.
Landlord ↔ Tenant lean methodology
- Overall (STATE)
- 87 Strongly Landlord-Friendly
- State Florida
- 87 Strongly Landlord-Friendly · R+3
- County
- — inherits STATE
- City
- — inherits STATE
ZIP-level market 33974
- Home prices YoY
- 5.8%
- Rents YoY
- -4.7%
- Active inventory
- 2460
- Price-to-rent
- 11.9×
Monthly cashflow live
- Estimated rent
- $2,050 high interval (Pro) →
- Mortgage (P&I)
- −$1,540
- Tax est. 1.5%
- −$367 /mo · $4,406/yr
- Insurance
- −$122
- HOA
- −$0
- Vacancy / Maint / Mgmt
- −$430
- Net cashflow
- $-410
Break-even live
UW: 25.0% down · 7.5% · 30yr · 1.5% tax · 5.0% vac · 8.0% maint · 8.0% mgmt
Financing live
Cash to close
- Down payment
- $73,425
- Closing costs
- $8,811
- Reserves months
- —
- Total cash needed
- —
Loan-product check · same deal, 3 products live
Conventional
25% down · 7.5% · 30yr
- Down + closing
- —
- Monthly P&I
- —
- Monthly cashflow
- —
- DSCR
- —
- Eligible?
- —
Personal DTI + credit; lowest rate.
DSCR
20% down · 8.5% · 30yr
- Down + closing
- —
- Monthly P&I
- —
- Monthly cashflow
- —
- DSCR
- —
- Eligible?
- —
No personal income docs; deal must DSCR.
Hard money
10% down · 12.0% · 12mo
- Down + closing
- —
- Monthly P&I
- —
- Monthly cashflow
- —
- DSCR
- —
- Eligible?
- —
Short-term bridge; refi at stabilization.
Rent comps 40 comps
| Address | Beds | Baths | Sqft | Rent | $/sqft | DOM | Units | Dist |
|---|---|---|---|---|---|---|---|---|
| 728 Crestline Ave S Lehigh Acres, FL | 4.0 | 3.0 | 1904 | $2,000 | $1.05 | 21d | 1 | 0.07mi |
| 715 Bering Ave S Lehigh Acres, FL | 3.0 | 2.0 | 1835 | $1,895 | $1.03 | 21d | 1 | 0.16mi |
| 814 Crystal Ave S Lehigh Acres, FL | 3.0 | 2.0 | 1865 | $1,815 | $0.97 | 23d | 1 | 0.40mi |
| 760 Festival Ave S Lehigh Acres, FL | 3.0 | 2.0 | 1650 | $2,000 | $1.21 | 23d | 1 | 0.44mi |
| 719 Fullerton Ave S Lehigh Acres, FL | 3.0 | 2.0 | 1650 | $2,000 | $1.21 | 19d | 1 | 0.49mi |
| 762 Gallo Ave S #764 Lehigh Acres, FL | 3.0 | 2.0 | 1127 | $1,195 | $1.06 | 21d | 1 | 0.56mi |
| 826 Dawhert Ave S Lehigh Acres, FL | 4.0 | 2.0 | 1365 | $1,750 | $1.28 | 3d | 1 | 0.57mi |
| 710 Godwid Ave S Lehigh Acres, FL | 3.0 | 2.0 | 1758 | $2,150 | $1.22 | 21d | 1 | 0.59mi |
| 710 Godwid Ave S Lehigh Acres, FL | 3.0 | 2.0 | 1758 | $2,150 | $1.22 | 2d | 1 | 0.59mi |
| 710 Godwid Ave S Lehigh Acres, FL | 3.0 | 2.0 | 1758 | $2,150 | $1.22 | 3d | 1 | 0.59mi |
| 750 Newhall St E Lehigh Acres, FL | 3.0 | 2.0 | 1147 | $1,675 | $1.46 | 23d | 1 | 0.60mi |
| 750 Newhall St E Lehigh Acres, FL | 3.0 | 2.0 | 1147 | $1,675 | $1.46 | 19d | 1 | 0.60mi |
| 652 Keller St E Lehigh Acres, FL | 3.0 | 2.0 | 1417 | $1,861 | $1.31 | 21d | 1 | 0.60mi |
| 708 Godwid Ave S Lehigh Acres, FL | 3.0 | 2.0 | 1758 | $2,150 | $1.22 | 21d | 1 | 0.60mi |
| 771 Gaylord Ave S Lehigh Acres, FL | 3.0 | 2.0 | 1523 | $2,000 | $1.31 | 23d | 1 | 0.66mi |
| 684 Thomas Sherwin Ave S Lehigh Acres, FL | 3.0 | 2.0 | 1288 | $1,695 | $1.32 | 3d | 1 | 0.70mi |
| 804 Gaylord Ave S Lehigh Acres, FL | 4.0 | 2.0 | 1833 | $1,875 | $1.02 | 23d | 1 | 0.71mi |
| 758 Worth Ave Lehigh Acres, FL | 3.0 | 2.0 | 1360 | $2,000 | $1.47 | 16d | 1 | 0.71mi |
| 862 Charles Sise St E Lehigh Acres, FL | 3.0 | 2.0 | 1582 | $2,664 | $1.68 | 23d | 1 | 0.78mi |
| 874 Apartment St Lehigh Acres, FL | 3.0 | 2.0 | 1200 | $1,750 | $1.46 | 23d | 1 | 0.83mi |
| 907 Chenault St Lehigh Acres, FL | 2.0 | 4.0 | 1200 | $1,250 | $1.04 | 14d | 1 | 0.87mi |
| 604 Thomas Sherwin Ave S Lehigh Acres, FL | 4.0 | 2.0 | 1493 | $2,200 | $1.47 | 3d | 1 | 0.88mi |
| 736 Barcia St E Lehigh Acres, FL | 4.0 | 2.0 | 1833 | $1,775 | $0.97 | 23d | 1 | 0.93mi |
| 696 Homestead Rd S Lehigh Acres, FL | 4.0 | 2.0 | 1777 | $2,200 | $1.24 | 23d | 1 | 0.94mi |
| 930 Ainsworth St W Lehigh Acres, FL | 3.0 | 2.0 | 1165 | $1,395 | $1.20 | 16d | 1 | 0.95mi |
| 925 Chenault St Lehigh Acres, FL | 3.0 | 2.0 | 1132 | $1,700 | $1.50 | 23d | 1 | 0.95mi |
| 927 Chenault St Lehigh Acres, FL | 3.0 | 2.0 | 1132 | $1,700 | $1.50 | 23d | 1 | 0.95mi |
| 886 Milwaukee Blvd Lehigh Acres, FL | 3.0 | 2.0 | 1205 | $1,900 | $1.58 | 23d | 1 | 0.98mi |
| 744 Oakridge Ave S Lehigh Acres, FL | 3.0 | 2.0 | 1493 | $2,000 | $1.34 | 19d | 1 | 0.99mi |
| 546 Whispering Wind Bnd Lehigh Acres, FL | 3.0 | 2.0 | 1437 | $1,950 | $1.36 | 1d | 1 | 1.01mi |
| 908 Winters St E Lehigh Acres, FL | 3.0 | 2.0 | 1639 | $2,200 | $1.34 | 10d | 1 | 1.01mi |
| 711 Nimitz Blvd Lehigh Acres, FL | 4.0 | 2.0 | 1571 | $2,191 | $1.39 | 3d | 1 | 1.03mi |
| 528 Raintree St E Lehigh Acres, FL | 4.0 | 3.0 | 1400 | $1,700 | $1.21 | 23d | 1 | 1.04mi |
| 567 Charwood Ave S Lehigh Acres, FL | 3.0 | 2.0 | 1564 | $1,900 | $1.21 | 14d | 1 | 1.06mi |
| 598 Aston Lake Ct Lehigh Acres, FL | 3.0 | 2.0 | 1703 | $2,395 | $1.41 | 21d | 1 | 1.08mi |
| 530 Kilgour Ave Lehigh Acres, FL | 3.0 | 2.0 | 2214 | $1,795 | $0.81 | 3d | 1 | 1.10mi |
| 606 Morningmist Ln Lehigh Acres, FL | 4.0 | 2.5 | 1817 | $2,295 | $1.26 | 3d | 1 | 1.11mi |
| 573 Bell Blvd S Lehigh Acres, FL | 3.0 | 2.0 | 1218 | $1,900 | $1.56 | 14d | 1 | 1.12mi |
| 541 Chalet Ave S Lehigh Acres, FL | 4.0 | 3.0 | 1650 | $2,400 | $1.45 | 23d | 1 | 1.12mi |
| 645 Homestead Rd S Lehigh Acres, FL | 3.0 | 2.0 | 1165 | $1,700 | $1.46 | 23d | 1 | 1.16mi |
Listing history 8 events
-
2026-06-17days on market $293,700 Active 120 DOM
-
2026-06-16days on market $293,700 Active 119 DOM
-
2026-06-16days on market $293,700 Active 118 DOM
-
2026-06-13days on market $293,700 Active 116 DOM
-
2026-06-09days on market $293,700 Active 112 DOM
-
2026-06-07days on market $293,700 Active 110 DOM
-
2026-06-01days on market $293,700 Active 104 DOM
-
2026-06-01days on market $293,700 Active 103 DOM
ⓘ Source: listings_history table (triggers on properties + properties_extension) + one-shot
backfill from property_details.listing_events for pre-trigger history.
Nearby sold comps map
Loading sold comps map…
Walkable amenities ~0.75 mi
Loading nearby amenities…
Taxation est. · year 1
- Rental income
- $24,597
- − Mortgage interest
- −$16,452
- − Property taxes
- −$4,406
- − Insurance
- −$1,468
- − Repairs & maintenance
- −$1,968
- − Management
- −$1,968
- − Depreciation
- −$8,544
- Taxable loss
- −$10,208
- Est. tax savings @ 24.0%
- +$2,450
- After-tax cash flow
- $-2,475/yr
For passive investors: Depreciation is non-cash, so a rental often shows a tax loss while cash-flowing — sheltering income. Rental losses are passive: they offset passive income freely, and up to $25,000/yr can offset ordinary (W-2) income if you actively participate and your MAGI is under $100k (phasing out to $0 by $150k); unused losses carry forward. On sale, claimed depreciation is recaptured at up to 25%, and gains may owe capital-gains tax (a 1031 exchange can defer both). Figures are a year-1 estimate at your 24.0% rate — not tax advice; consult a CPA.
Schools (NCES district)
- District
- Lee
- NCES district ID
- 1201080
- Math proficiency
- 47% ▼ -11.00%
- Reading proficiency
- 50% ▼ -4.00%
- Median HH income
- $49,518
- Composite
- 41.49/100
- National rank
- #3458
- State rank
- #42 of 73 in FL
Livability — Lehigh Acres
- Score
- 59/100
- State rank
- #826
- US rank
- #20055
Category grades
Schools grade is shown separately in the Schools card above.
Census & demographics
- Census place
- Lehigh Acres, FL
- County
- Lee County · 788,662 people
- City population
- 130,638
- Metro
- Cape Coral-Fort Myers, FL
- Population (ZIP)
- 19,927
- Household income
- $72,192
- Rent vs Own
- Severe rent burden
- 434.0
Population outlook (Lee County) Hauer SSP2
- Today (2025)
- 871,946 people
- By 2030
- 955,468 · +9.6%
- By 2040
- 1,113,587 · +27.7%
- By 2050
- 1,256,891 · +44.1%
- By 2075
- 1,560,270 · +78.9%
- By 2100
- 1,726,848 · +98.0%
Race, ethnicity, and origin ACS 2023
- Neighborhood character
- Diverse neighborhood (Simpson 0.64)
- Race & ethnicity
- Hispanic / Latino 52% Two or more races 31% White 26% Black 18%
- Hispanic origin (detail)
- Mexican 12% Puerto Rican 7% Cuban 20% Dominican 4%
- Common ancestry
- Hispanic 7% Italian 1% Portuguese 1%
- Foreign-born
- 32% · Canada, Jamaica
- Languages at home
- 48% English-only · Spanish 43% French/Haitian/Cajun 7% Other Indo-European 1%
Political lean MEDSL · Lee
- 2024 margin
- Strong R (+28.4) · D 35.5% · R 63.9%
- 2008→2024 swing
- -18.0pp toward R · 2008: -10.4pp · 2024: -28.4pp
- All cycles
- 2024: R+28.4 2020: R+19.2 2016: R+20.4 2012: R+16.6 2008: R+10.4
Not yet ingested
- Civics
- —
Market trends
- HPI YoY
- ▲ 16.53%
- Current HPI
- 303.3399
- Rent YoY
- ▼ -4.68%
- Metro
- Cape Coral-Fort Myers, FL
- State GDP YoY
- ▲ 3.28%
- F500 in state
- 36
Industry mix (Fortune 500 HQ in FL)
| Industry | F500 HQs | Revenue |
|---|---|---|
| Industrial Technology | 2 | $29B |
|
||
| Insurance | 2 | $17B |
|
||
| Retail | 1 | $60B |
|
||
| Technology Distribution | 1 | $58B |
|
||
| Homebuilding | 1 | $35B |
|
||
| Technology Manufacturing | 1 | $35B |
|
||
Cash-flow waterfall
monthlySold comps — $/sqft
last 12 mo · ≤1 miLoading sold comps…