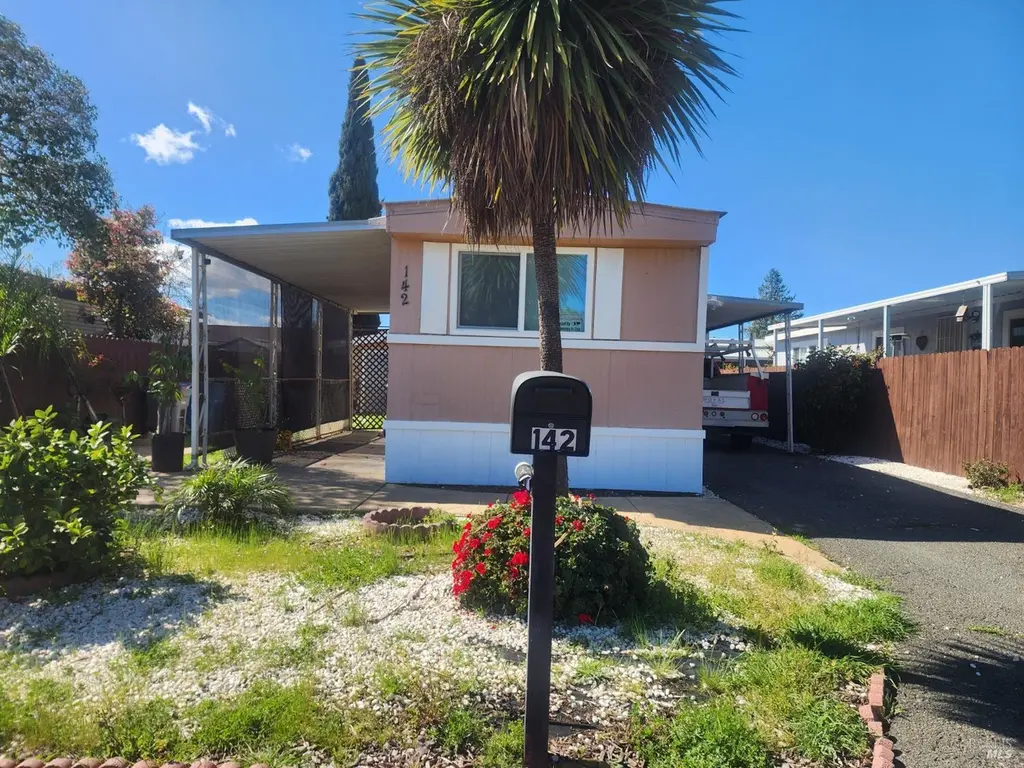
260 American Canyon Rd #142 · American Canyon, CA
Flood risk 1/10 · Minimal
- FEMA flood zone
- X (unshaded)
- Chance of flooding over 30 yrs
- 0.0%
- Est. flood insurance / yr
- $507 – $1,088
Fire risk 6/10 · Moderate
- Est. fire insurance / yr
- $659 – $1,223
Heat risk 4/10 · Minor
- Hot days now (above 94°F)
- 7 days/yr
- Hot days in 30 yrs
- 13 days/yr
Wind risk 1/10 · Minimal
- Chance of severe wind over 30 yrs
- —
Air-quality risk 8/10 · Major
- Unhealthy air days now
- 13 days/yr
- Unhealthy air days in 30 yrs
- 13 days/yr
Risk factors via First Street. Map © Google.
Why this score? — see what drove the C+ grade
The composite is a weighted blend of 9 inputs, each scored 0–100. Each bar is that input's sub-score; the figure is the points it added to the 100-point composite (weight × sub-score).
- Cash flow +30.0/30.0
- 1% rule +10.0/10.0
- DSCR +10.0/10.0
- Schools +4.0/10.0
- Livability +3.7/5.0
- Rent growth +2.5/5.0
- Condition / age +2.5/5.0
- ARV discount +0.4/15.0
- Appreciation +0.0/10.0
$142,500
🖨 Deal sheet (PDF) 📄 Offer letter ✓ Due diligence
Listing remarks MLS
Beautifully Updated! New kitchen -dual pane window-Open living Area. Has 2 bedroom with the primary bedroom in rear. I One full bathroom with a half bath Park has a community center AND A INGROUND POOL.
Key facts
- New kitchen
- Open living area
- Inground pool
Tags
Neighborhood map
What this means for you Summary
Snapshot
- This is a 2-bed/2.0-bath manufactured listed at $142k.
Deal economics
- At list price, monthly cash flow is $750 ($9k/yr) — positive.
- The deal already cash-flows at list — no discount required.
- Meets the 1% rule at list price ($2k rent vs $142k).
- Recommended offer: $134k (6.0% below list) — sets the bar for market timing.
- Cap rate 12.6% vs local median 3.2% in American Canyon — top-decile yield for the area; either an underpriced asset or a hidden risk that comps aren't pricing in. Stress-test before assuming the spread holds.
Location & tenants
- Location reads 74/100 on livability (#133 in CA, #4,684 nationally) — a middle-class / working-renter tenant base. Strengths: employment A+, housing A+, health & safety A+; Watch: schools C-, amenities F, cost of living F.
- Napa Valley Unified (urban): math 35% / reading 48% proficiency, ranked #599 of 1,400 in CA (top 43%) — families likely to look elsewhere, expect single-tenant / working-renter base with shorter leases.
- Market conditions: 67 active listings in the ZIP; 3 comparable units currently listed for rent nearby; rentals lingering (median 45d on market — plan ~5-8 weeks vacancy on turnover, expect pricing pressure); 67% of comp listings sitting > 30 days — soft ceiling on asking rent; high-income renter base; 427 units permitted in Napa County in 2024 (189 in 5+ unit buildings).
Forward outlook
- Local home prices are declining (-3.0%/yr); year-one equity from $985 of loan paydown is wiped out by about $4k of value loss. Plan a longer hold.
- Napa County population projected at +14% by 2050 — modest demand growth; plan on rents tracking national, not racing it.
- At projected returns (-3.0% appreciation + 3.0% rent growth), your $40k cash investment doubles in ~6 years — after that, you're playing with house money.
Negotiation context
- It's been on market 83 days — a 6% lower offer ($134k) is reasonable based on typical stale-listing flexibility.
Risks & watch-outs
- Climate carrying-cost: major wildfire risk — expect insurance premiums to compound above CPI over the hold.
Questions for the listing agent
- It's been on market 83 days. Have you received any prior offers? Is the seller open to a 6% concession, seller financing, or rate buy-down credit?
- Built in 1974 — when were the roof, HVAC, electrical panel, plumbing, and water heater last replaced?
- Why hasn't it sold? Are there any deal-killer items the seller is aware of (foundation, flood, title, zoning, code violations)?
- Is there a deadline driving the sale (1031 exchange, divorce, estate, relocation)? That informs how much negotiation room exists.
- What's the average days-on-market for RENTAL listings here right now (not sales)? A rising rental-DOM trend means longer vacancies and softer asking-rent achievability than the comps imply.
- What's the recent tenant-quality profile in this submarket — average credit score on applications, eviction rate, late-payment / NSF rate, and stable-employment percentage? A property-management company in the area should have these aggregated.
- How much new for-sale + rental construction is in the pipeline within 1–3 miles? Heavy new supply typically softens prices + rents 12–24 months out; constrained supply supports both.
Investment metrics
- 1% rule
- 1.54% ✓
- Cap rate
- 12.61%
- Cash-on-cash
- 22.54%
- DSCR
- 2.00
- GRM
- 5.4
CMA / ARV
- ARV (median comp)
- $123,088
- List price
- $142,500
- Delta
- 15.77%
- Verdict
- OVERPRICED
- Comps
- 2 within 1.0 mi
Show comp detail 6 sales within ~0.75 mi
| Address | Dist | Beds/Ba | Sqft | Sold | Price | $/sf | Match |
|---|---|---|---|---|---|---|---|
| 260 American Canyon Rd #13 | 0.01mi | 2/1.0 | 768 (+7%) | 12mo | $78,000 | $102 | 74 |
| 3000 Broadway St #26 | 0.32mi | 2/1.5 | 672 (-7%) | 10mo | $125,000 | $186 | 64 |
| 2525 Flosden Rd #43 | 0.61mi | 2/1.0 | 720 (0%) | 10mo | $125,000 | $174 | 59 |
| 244 American Canyon Rd #11 | 0.19mi | 2/1.0 | 800 (+11%) | 21mo | $160,000 | $200 | 51 |
| 2525 Flosden Rd #51 | 0.61mi | 2/1.0 | 672 (-7%) | 22mo | $59,000 | $88 | 38 |
| 2525 Flosden Rd #87 | 0.52mi | 2/1.0 | 800 (+11%) | 22mo | $99,000 | $124 | 35 |
Match score weights: distance 35% · size 25% · config 20% · recency 20%. Top-matched comps best support the ARV.
Projected returns pro-forma
-3.0% appreciation · 3.0% rent growth · sell at horizon
- IRR
- 15.4%
- Equity multiple
- 1.62×
- Total profit
- $24,683
- Equity at exit
- $21,247
- IRR
- 24.1%
- Equity multiple
- 3.08×
- Total profit
- $83,102
- Equity at exit
- $12,321
Cash invested: $39,900 (down + closing). Projections, not guarantees.
Landlord ↔ Tenant lean methodology
- Overall (STATE)
- 18 Strongly Tenant-Friendly
- State California
- 18 Strongly Tenant-Friendly · D+13
- County
- — inherits STATE
- City
- — inherits STATE
ZIP-level market 94503
- Home prices YoY
- -21.0%
- Active inventory
- 67
- Price-to-rent
- 5.4×
Monthly cashflow live
- Estimated rent
- $2,195 medium interval (Pro) →
- Mortgage (P&I)
- −$747
- Tax est. 1.5%
- −$178 /mo · $2,138/yr
- Insurance
- −$59
- HOA
- −$0
- Vacancy / Maint / Mgmt
- −$461
- Net cashflow
- $750
Break-even live
Sensitivity live
| Price | -10% $848 | -5% $799 | +0% $750 | +5% $700 | +10% $651 |
|---|---|---|---|---|---|
| Rent | -10% $576 | -5% $663 | +0% $750 | +5% $836 | +10% $923 |
| Rate | -1.0pp $821 | -0.5pp $786 | base $750 | +0.5pp $713 | +1.0pp $675 |
UW: 25.0% down · 7.5% · 30yr · 1.5% tax · 5.0% vac · 8.0% maint · 8.0% mgmt
Financing live
Cash to close
- Down payment
- $35,625
- Closing costs
- $4,275
- Reserves months
- —
- Total cash needed
- —
Loan-product check · same deal, 3 products live
Conventional
25% down · 7.5% · 30yr
- Down + closing
- —
- Monthly P&I
- —
- Monthly cashflow
- —
- DSCR
- —
- Eligible?
- —
Personal DTI + credit; lowest rate.
DSCR
20% down · 8.5% · 30yr
- Down + closing
- —
- Monthly P&I
- —
- Monthly cashflow
- —
- DSCR
- —
- Eligible?
- —
No personal income docs; deal must DSCR.
Hard money
10% down · 12.0% · 12mo
- Down + closing
- —
- Monthly P&I
- —
- Monthly cashflow
- —
- DSCR
- —
- Eligible?
- —
Short-term bridge; refi at stabilization.
Rent comps 3 comps
| Address | Beds | Baths | Sqft | Rent | $/sqft | DOM | Units | Dist |
|---|---|---|---|---|---|---|---|---|
| 2401 Broadway Unit 105 Vallejo, CA | 1.0 | 1.0 | 589 | $1,795 | $3.05 | 14d | 1 | 0.77mi |
| 2401 Broadway Unit 107 Vallejo, CA | 1.0 | 1.0 | 590 | $1,795 | $3.04 | 44d | 1 | 0.78mi |
| 35 Peacock Cir American Canyon, CA | 1.0 | 1.0 | 450 | $1,950 | $4.33 | 44d | 1 | 1.28mi |
Listing history 21 events
-
2026-06-21days on market $142,500 Active 83 DOM
-
2026-06-19price $142,500 Active 80 DOM
-
2026-06-18days on market $149,999 Active 80 DOM
-
2026-06-17days on market $149,999 Active 79 DOM
-
2026-06-16days on market $149,999 Active 78 DOM
-
2026-06-15days on market $149,999 Active 77 DOM
-
2026-06-14days on market $149,999 Active 75 DOM
-
2026-06-13days on market $149,999 Active 74 DOM
-
2026-06-10days on market $149,999 Active 72 DOM
-
2026-06-09days on market $149,999 Active 71 DOM
-
2026-06-08days on market $149,999 Active 70 DOM
-
2026-06-07days on market $149,999 Active 69 DOM
-
2026-06-05pricedays on market $149,999 Active 66 DOM
-
2026-06-03days on market $159,999 Active 65 DOM
-
2026-06-02days on market $159,999 Active 64 DOM
-
2026-06-01days on market $159,999 Active 63 DOM
-
2026-05-31days on market $159,999 Active 62 DOM
-
2026-05-30days on market $159,999 Active 61 DOM
-
2026-04-28price $159,999 208-char remark
Show marketing remark (208 chars)
Beautifully Updated! New kitchen -dual pane window-Open living Area. Has 2 bedroom with the primary bedroom in rear. I One full bathroom with a half bath Park has a community center AND A INGROUND POOL.
-
2026-03-30$169,000 Active 208-char remark
Show marketing remark (208 chars)
Beautifully Updated! New kitchen -dual pane window-Open living Area. Has 2 bedroom with the primary bedroom in rear. I One full bathroom with a half bath Park has a community center AND A INGROUND POOL.
-
2009-02-23price $22,000
ⓘ Source: listings_history table (triggers on properties + properties_extension) + one-shot
backfill from property_details.listing_events for pre-trigger history.
Climate risk First Street
- Flood 1/10 Low FEMA zone X (unshaded) · 0% chance over 30 yrs
- Wildfire 6/10 Major
- Heat 4/10 Moderate 7 d/yr ≥94°F today · 13 d/yr by 30 yrs out
- Wind 1/10 Low
- Air quality 8/10 Severe 13 unhealthy d/yr today · 13 by 30 yrs out
Nearby sold comps map
Loading sold comps map…
Walkable amenities ~0.75 mi
Loading nearby amenities…
Taxation est. · year 1
- Rental income
- $26,345
- − Mortgage interest
- −$7,982
- − Property taxes
- −$2,138
- − Insurance
- −$712
- − Repairs & maintenance
- −$2,108
- − Management
- −$2,108
- − Depreciation
- −$4,145
- Taxable income
- $7,152
- Est. tax owed @ 24.0%
- −$1,716
- After-tax cash flow
- $7,278/yr
For passive investors: Depreciation is non-cash, so a rental often shows a tax loss while cash-flowing — sheltering income. Rental losses are passive: they offset passive income freely, and up to $25,000/yr can offset ordinary (W-2) income if you actively participate and your MAGI is under $100k (phasing out to $0 by $150k); unused losses carry forward. On sale, claimed depreciation is recaptured at up to 25%, and gains may owe capital-gains tax (a 1031 exchange can defer both). Figures are a year-1 estimate at your 24.0% rate — not tax advice; consult a CPA.
Schools (NCES district)
- District
- Napa Valley Unified
- NCES district ID
- 0626640
- Math proficiency
- 35% ▲ 1.00%
- Reading proficiency
- 48% ▲ 2.00%
- Median HH income
- $72,007
- Composite
- 40.18/100
- National rank
- #7827
- State rank
- #599 of 1400 in CA
Livability — American Canyon
- Score
- 74/100
- State rank
- #133
- US rank
- #4684
Category grades
Schools grade is shown separately in the Schools card above.
Census & demographics
- Census place
- American Canyon, CA
- County
- Napa County · 120,669 people
- City population
- 21,841
- Metro
- Napa, CA
- Population (ZIP)
- 21,841
- Household income
- $121,088
- Rent vs Own
- Severe rent burden
- 486.0
Population outlook (Napa County) Hauer SSP2
- Today (2025)
- 153,987 people
- By 2030
- 159,490 · +3.6%
- By 2040
- 168,796 · +9.6%
- By 2050
- 176,213 · +14.4%
- By 2075
- 190,113 · +23.5%
- By 2100
- 190,528 · +23.7%
Race, ethnicity, and origin ACS 2023
- Neighborhood character
- Highly diverse neighborhood (Simpson 0.75)
- Race & ethnicity
- Asian 33% Hispanic / Latino 31% White 21% Two or more races 15% Black 6% Pacific Islander 1%
- Hispanic origin (detail)
- Mexican 25%
- Common ancestry
- Italian 2% Lithuanian 1% Romanian 1%
- Foreign-born
- 31% · Canada, China, Vietnam
- Languages at home
- 57% English-only · Spanish 22% Tagalog/Filipino 15% Other Indo-European 3%
Political lean MEDSL · Napa
- 2024 margin
- Solid D (+34.9) · D 65.9% · R 31.1% · Other 3.0%
- 2008→2024 swing
- +2.4pp toward D · 2008: 32.5pp · 2024: 34.9pp
- All cycles
- 2024: D+34.9 2020: D+40.4 2016: D+35.2 2012: D+25.7 2008: D+32.5
Not yet ingested
- Civics
- —
Market trends
- HPI YoY
- ▼ -97.47%
- Current HPI
- 366.9139
- Rent YoY
- —
- Metro
- Napa, CA
- State GDP YoY
- ▲ 3.21%
- F500 in state
- 116
Industry mix (Fortune 500 HQ in CA)
| Industry | F500 HQs | Revenue |
|---|---|---|
| Technology | 27 | $1,492B |
|
||
| Financial Services | 3 | $174B |
|
||
| Retail | 3 | $44B |
|
||
| Insurance | 3 | $26B |
|
||
| Media / Entertainment | 2 | $115B |
|
||
| Pharmaceuticals / Biotech | 2 | $62B |
|
||
Price history
+627.3% since first listed3 events — show timeline
- 2026-04-28 Price Changed $159,999 BAREIS
- 2026-03-30 Listed $169,000 BAREIS
- 2009-02-23 Price Changed $22,000 BAREIS
Cash-flow waterfall
monthlySold comps — $/sqft
last 12 mo · ≤1 miLoading sold comps…