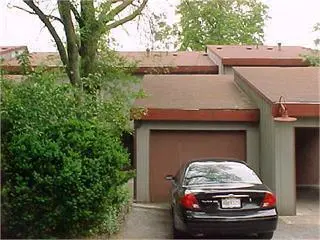
506 E Coolspring Ave Unit C · Michigan City, IN
Flood risk 1/10 · Minimal
- FEMA flood zone
- X (unshaded)
- Chance of flooding over 30 yrs
- 0.0%
- Est. flood insurance / yr
- $507 – $1,088
Fire risk 1/10 · Minimal
- Est. fire insurance / yr
- $717 – $1,331
Heat risk 2/10 · Minimal
- Hot days now (above 100°F)
- 7 days/yr
- Hot days in 30 yrs
- 15 days/yr
Wind risk 2/10 · Minimal
- Chance of severe wind over 30 yrs
- —
Air-quality risk 3/10 · Minor
- Unhealthy air days now
- 2 days/yr
- Unhealthy air days in 30 yrs
- 3 days/yr
Risk factors via First Street. Map © Google.
Why this score? — see what drove the C+ grade
The composite is a weighted blend of 9 inputs, each scored 0–100. Each bar is that input's sub-score; the figure is the points it added to the 100-point composite (weight × sub-score).
- Cash flow +20.5/30.0
- ARV discount +15.0/15.0
- 1% rule +7.2/10.0
- DSCR +6.5/10.0
- Rent growth +4.9/5.0
- Livability +4.0/5.0
- Condition / age +2.5/5.0
- Schools +2.2/10.0
- Appreciation +0.0/10.0
$120,000
🖨 Deal sheet (PDF) 📄 Offer letter ✓ Due diligence
Listing remarks MLS
Great condo in a phenomenal location! So close to everything Michigan City has to offer. This 3-bedroom, 3-bath condo features a kitchen and dining area plus not one, but TWO private patios. The association installed a new roof just two years ago. This hidden gem has so much potential. While it could use some cosmetic updates, the upside is huge, build instant equity and enjoy strong income potential. Excellent investment opportunity!
Key facts
- $250 HOA
- Garage
- Built 1975
Neighborhood map
What this means for you Summary
Snapshot
- This is a 3-bed/2.5-bath condo listed at $120k.
Deal economics
- At list price, monthly cash flow is $158 ($2k/yr) — positive.
- The deal already cash-flows at list — no discount required.
- Meets the 1% rule at list price ($1k rent vs $120k).
- Recommended offer: $109k (9.0% below list) — sets the bar for market timing.
- Cap rate 7.9% vs local median 2.7% in Michigan City — top-decile yield for the area; either an underpriced asset or a hidden risk that comps aren't pricing in. Stress-test before assuming the spread holds.
Location & tenants
- Location reads 81/100 on livability (#15 in IN, #1,317 nationally) — a professional / high-income tenant draw. Strengths: commute A+, cost of living A+, housing A+; Watch: employment D, schools D-, amenities D-.
- Michigan City Area Schools (urban): math 23% / reading 28% proficiency, ranked #262 of 301 in IN (top 87%) — low school quality limits family demand, transient renter base, plan for 1-2y turnover; 68% free/reduced lunch — lower-income household profile, screen leases tightly.
- Market conditions: Rents rising fast (+9.7%/yr); 371 active listings in the ZIP; 8 comparable units currently listed for rent nearby; rentals lingering (median 45d on market — plan ~5-8 weeks vacancy on turnover, expect pricing pressure); 100% of comp listings sitting > 30 days — soft ceiling on asking rent; 216 units permitted in LaPorte County in 2024 (75 in 5+ unit buildings).
Forward outlook
- Local home prices are declining (-3.0%/yr); year-one equity from $830 of loan paydown is wiped out by about $4k of value loss. Plan a longer hold.
- LaPorte County population projected to shrink 7% by 2050 — rents likely to lag national; underwrite the cash flow, not the appreciation.
- At projected returns (-3.0% appreciation + 8.0% rent growth), your $34k cash investment doubles in ~9 years — after that, you're playing with house money.
Negotiation context
- It's been on market 99 days — a 9% lower offer ($109k) is reasonable based on typical stale-listing flexibility.
- 3 sale attempts with the ask held roughly flat each time — persistent listings suggest the price (not the market) is what's stuck; bring a comps-based counter.
Questions for the listing agent
- It's been on market 99 days. Have you received any prior offers? Is the seller open to a 9% concession, seller financing, or rate buy-down credit?
- Built in 1975 — when were the roof, HVAC, electrical panel, plumbing, and water heater last replaced?
- What does the HOA fee cover, when was the last increase, and are there any pending special assessments or reserve-fund shortfalls?
- Any open or pending special assessments — roof, HVAC, plumbing, elevator, façade? What's the per-unit balance and payoff schedule, and is the seller paying it off at close or rolling it to the buyer?
- Why hasn't it sold? Are there any deal-killer items the seller is aware of (foundation, flood, title, zoning, code violations)?
- Is there a deadline driving the sale (1031 exchange, divorce, estate, relocation)? That informs how much negotiation room exists.
- Schools are D-rated, which usually means shorter tenancies and higher turnover. Who's the typical renter profile here, and what's been the actual vacancy rate?
- What's the average days-on-market for RENTAL listings here right now (not sales)? A rising rental-DOM trend means longer vacancies and softer asking-rent achievability than the comps imply.
- What's the recent tenant-quality profile in this submarket — average credit score on applications, eviction rate, late-payment / NSF rate, and stable-employment percentage? A property-management company in the area should have these aggregated.
- How much new apartment / multifamily construction is in the pipeline within 1–3 miles? Heavy new supply (>2% of stock underway) typically softens rents 12–24 months out; light construction supports rent growth.
Investment metrics
- 1% rule
- 1.22% ✓
- Cap rate
- 7.87%
- Cash-on-cash
- 5.64%
- DSCR
- 1.25
- GRM
- 6.8
CMA / ARV
- ARV (median comp)
- $193,905
- List price
- $120,000
- Delta
- -38.11%
- Verdict
- UNDERPRICED
- Comps
- 10 within 1.0 mi
Projected returns pro-forma
-3.0% appreciation · 8.0% rent growth · sell at horizon
- IRR
- -1.1%
- Equity multiple
- 0.95×
- Total profit
- $-1,517
- Equity at exit
- $17,892
- IRR
- 13.9%
- Equity multiple
- 2.41×
- Total profit
- $47,417
- Equity at exit
- $10,375
Cash invested: $33,600 (down + closing). Projections, not guarantees.
Landlord ↔ Tenant lean methodology
- Overall (STATE)
- 90 Strongly Landlord-Friendly
- State Indiana
- 90 Strongly Landlord-Friendly · R+11
- County
- — inherits STATE
- City
- — inherits STATE
ZIP-level market 46360
- Rents YoY
- 9.7%
- Active inventory
- 371
- Price-to-rent
- 6.8×
Monthly cashflow live
- Estimated rent
- $1,467 high interval (Pro) →
- Mortgage (P&I)
- −$629
- Tax from tax record
- −$72 /mo · $859/yr
- Insurance
- −$50
- HOA
- −$250
- Vacancy / Maint / Mgmt
- −$308
- Net cashflow
- $158
Break-even live
Sensitivity live
| Price | -10% $226 | -5% $192 | +0% $158 | +5% $124 | +10% $90 |
|---|---|---|---|---|---|
| Rent | -10% $42 | -5% $100 | +0% $158 | +5% $216 | +10% $274 |
| Rate | -1.0pp $218 | -0.5pp $188 | base $158 | +0.5pp $127 | +1.0pp $95 |
UW: 25.0% down · 7.5% · 30yr · 1.5% tax · 5.0% vac · 8.0% maint · 8.0% mgmt
Financing live
Cash to close
- Down payment
- $30,000
- Closing costs
- $3,600
- Reserves months
- —
- Total cash needed
- —
Loan-product check · same deal, 3 products live
Conventional
25% down · 7.5% · 30yr
- Down + closing
- —
- Monthly P&I
- —
- Monthly cashflow
- —
- DSCR
- —
- Eligible?
- —
Personal DTI + credit; lowest rate.
DSCR
20% down · 8.5% · 30yr
- Down + closing
- —
- Monthly P&I
- —
- Monthly cashflow
- —
- DSCR
- —
- Eligible?
- —
No personal income docs; deal must DSCR.
Hard money
10% down · 12.0% · 12mo
- Down + closing
- —
- Monthly P&I
- —
- Monthly cashflow
- —
- DSCR
- —
- Eligible?
- —
Short-term bridge; refi at stabilization.
Rent comps 8 comps
| Address | Beds | Baths | Sqft | Rent | $/sqft | DOM | Units | Dist |
|---|---|---|---|---|---|---|---|---|
| 910 S Carroll Ave Michigan City, IN | 2.0–3.0 | 2.0 | 1187 | $1,600 | $1.35 | 44d | 3 | 0.96mi |
| 1810 E Barker Ave Michigan City, IN | 1.0–2.0 | 1.0 | 900 | $1,250 | $1.39 | 44d | 1 | 1.00mi |
| 3581 Hampden Rd Michigan City, IN | 4.0 | 1.0 | 1120 | $2,000 | $1.79 | 44d | 1 | 1.07mi |
| 121 S Porter St Unit A Michigan City, IN | 2.0 | 2.0 | 1050 | $925 | $0.88 | 44d | 1 | 1.11mi |
| 934 Henry St Michigan City, IN | 3.0 | 1.0 | 1100 | $1,250 | $1.14 | 44d | 1 | 1.21mi |
| 215 N Woodland Ave Michigan City, IN | 3.0 | 1.0 | 1112 | $1,395 | $1.25 | 44d | 1 | 1.26mi |
| 1303 Buffalo St Unit 1 Michigan City, IN | 3.0 | 1.0 | 1700 | $1,700 | $1.00 | 44d | 1 | 1.28mi |
| 416 E 9th St Unit 2 Michigan City, IN | 3.0 | 2.0 | 1400 | $1,325 | $0.95 | 44d | 1 | 1.42mi |
HOA detail condo
- Monthly dues
- $250 · $3,000/yr
- Assessments
- None detected in remarks — confirm with the listing agent.
Listing history 6 events
-
2026-04-28status Active 438-char remark
Show marketing remark (438 chars)
Great condo in a phenomenal location! So close to everything Michigan City has to offer. This 3-bedroom, 3-bath condo features a kitchen and dining area plus not one, but TWO private patios. The association installed a new roof just two years ago. This hidden gem has so much potential. While it could use some cosmetic updates, the upside is huge, build instant equity and enjoy strong income potential. Excellent investment opportunity!
-
2026-04-20historical Active Under Contract 438-char remark
Show marketing remark (438 chars)
Great condo in a phenomenal location! So close to everything Michigan City has to offer. This 3-bedroom, 3-bath condo features a kitchen and dining area plus not one, but TWO private patios. The association installed a new roof just two years ago. This hidden gem has so much potential. While it could use some cosmetic updates, the upside is huge, build instant equity and enjoy strong income potential. Excellent investment opportunity!
-
2026-03-17price $120,000 438-char remark
Show marketing remark (438 chars)
Great condo in a phenomenal location! So close to everything Michigan City has to offer. This 3-bedroom, 3-bath condo features a kitchen and dining area plus not one, but TWO private patios. The association installed a new roof just two years ago. This hidden gem has so much potential. While it could use some cosmetic updates, the upside is huge, build instant equity and enjoy strong income potential. Excellent investment opportunity!
-
2026-02-14status Active 438-char remark
Show marketing remark (438 chars)
Great condo in a phenomenal location! So close to everything Michigan City has to offer. This 3-bedroom, 3-bath condo features a kitchen and dining area plus not one, but TWO private patios. The association installed a new roof just two years ago. This hidden gem has so much potential. While it could use some cosmetic updates, the upside is huge, build instant equity and enjoy strong income potential. Excellent investment opportunity!
-
2026-02-07historical 438-char remark
Show marketing remark (438 chars)
Great condo in a phenomenal location! So close to everything Michigan City has to offer. This 3-bedroom, 3-bath condo features a kitchen and dining area plus not one, but TWO private patios. The association installed a new roof just two years ago. This hidden gem has so much potential. While it could use some cosmetic updates, the upside is huge, build instant equity and enjoy strong income potential. Excellent investment opportunity!
-
2026-02-06$125,000 438-char remark
Show marketing remark (438 chars)
Great condo in a phenomenal location! So close to everything Michigan City has to offer. This 3-bedroom, 3-bath condo features a kitchen and dining area plus not one, but TWO private patios. The association installed a new roof just two years ago. This hidden gem has so much potential. While it could use some cosmetic updates, the upside is huge, build instant equity and enjoy strong income potential. Excellent investment opportunity!
ⓘ Source: listings_history table (triggers on properties + properties_extension) + one-shot
backfill from property_details.listing_events for pre-trigger history.
Tax reassessment forecast IN · Partial reset (capped growth)
- Current annual tax
- $859 · $72/mo
- Projected year-2 tax
- $940 · $78/mo
- Expected delta
- +$80/yr (+$7/mo · 9.4%)
ⓘ Screening estimate from a state-policy table — verify with the county assessor before closing.
Climate risk First Street
- Flood 1/10 Low FEMA zone X (unshaded) · 0% chance over 30 yrs
- Wildfire 1/10 Low
- Heat 2/10 Low 7 d/yr ≥100°F today · 15 d/yr by 30 yrs out
- Wind 2/10 Low
- Air quality 3/10 Moderate 2 unhealthy d/yr today · 3 by 30 yrs out
Nearby sold comps map
Loading sold comps map…
Walkable amenities ~0.75 mi
Loading nearby amenities…
Taxation est. · year 1
- Rental income
- $17,600
- − Mortgage interest
- −$6,722
- − Property taxes
- −$859
- − Insurance
- −$600
- − Repairs & maintenance
- −$1,408
- − Management
- −$1,408
- − HOA
- −$3,000
- − Depreciation
- −$3,491
- Taxable income
- $112
- Est. tax owed @ 24.0%
- −$27
- After-tax cash flow
- $1,867/yr
For passive investors: Depreciation is non-cash, so a rental often shows a tax loss while cash-flowing — sheltering income. Rental losses are passive: they offset passive income freely, and up to $25,000/yr can offset ordinary (W-2) income if you actively participate and your MAGI is under $100k (phasing out to $0 by $150k); unused losses carry forward. On sale, claimed depreciation is recaptured at up to 25%, and gains may owe capital-gains tax (a 1031 exchange can defer both). Figures are a year-1 estimate at your 24.0% rate — not tax advice; consult a CPA.
Schools (NCES district)
- District
- Michigan City Area Schools
- NCES district ID
- 1806570
- Math proficiency
- 23% ▼ -16.00%
- Reading proficiency
- 28% ▼ -10.00%
- Median HH income
- $42,629
- Composite
- 21.76/100
- National rank
- #8257
- State rank
- #262 of 301 in IN
Livability — Michigan City
- Score
- 81/100
- State rank
- #15
- US rank
- #1317
Category grades
Schools grade is shown separately in the Schools card above.
Census & demographics
- Census place
- Michigan City, IN
- County
- La Porte County · 88,580 people
- City population
- 43,817
- Metro
- Michigan City-La Porte, IN
- Population (ZIP)
- 43,817
- Household income
- $59,266
- Rent vs Own
- Severe rent burden
- 1152.0
Population outlook (LaPorte County) Hauer SSP2
- Today (2025)
- 109,757 people
- By 2030
- 108,288 · -1.3%
- By 2040
- 105,070 · -4.3%
- By 2050
- 102,330 · -6.8%
- By 2075
- 97,009 · -11.6%
- By 2100
- 86,459 · -21.2%
Race, ethnicity, and origin ACS 2023
- Neighborhood character
- Predominantly White (67%)
- Race & ethnicity
- White 67% Black 20% Hispanic / Latino 8% Two or more races 7%
- Hispanic origin (detail)
- Mexican 5%
- Common ancestry
- Romanian 11% Lithuanian 2% Iranian 1%
- Foreign-born
- 3% · Canada
- Languages at home
- 95% English-only · Spanish 3%
Political lean MEDSL · LaPorte
- 2024 margin
- R (+14.1) · D 42.1% · R 56.2% · Other 1.7%
- 2008→2024 swing
- -19.1pp toward R · 2008: 5.0pp · 2024: -14.1pp
- All cycles
- 2024: R+14.1 2020: R+7.2 2016: R+6.4 2012: D+12.6 2008: D+5.0
Not yet ingested
- Civics
- —
Market trends
- HPI YoY
- ▼ -210.27%
- Current HPI
- 206.0882
- Rent YoY
- ▲ 9.72%
- Metro
- Michigan City-La Porte, IN
- State GDP YoY
- ▲ 2.90%
- F500 in state
- 18
Industry mix (Fortune 500 HQ in IN)
| Industry | F500 HQs | Revenue |
|---|---|---|
| Industrial Machinery | 2 | $37B |
|
||
| Healthcare | 1 | $177B |
|
||
| Pharmaceuticals | 1 | $45B |
|
||
| Metals / Steel | 1 | $18B |
|
||
| Agriculture | 1 | $17B |
|
||
| Packaging | 1 | $12B |
|
||
Price history
-4.0% since first listed6 events — show timeline
- 2026-04-28 Relisted — NIRA MLS as Distributed by MLS Grid
- 2026-04-20 Contingent — NIRA MLS as Distributed by MLS Grid
- 2026-03-17 Price Changed $120,000 NIRA MLS as Distributed by MLS Grid
- 2026-02-14 Relisted — NIRA MLS as Distributed by MLS Grid
- 2026-02-07 Listing Removed — NIRA MLS as Distributed by MLS Grid
- 2026-02-06 Listed $125,000 NIRA MLS as Distributed by MLS Grid
Property tax history
+4.0%/yrLatest (2024): $859 · +0.1% YoY. Source: county tax records.
Cash-flow waterfall
monthlySold comps — $/sqft
last 12 mo · ≤1 miLoading sold comps…