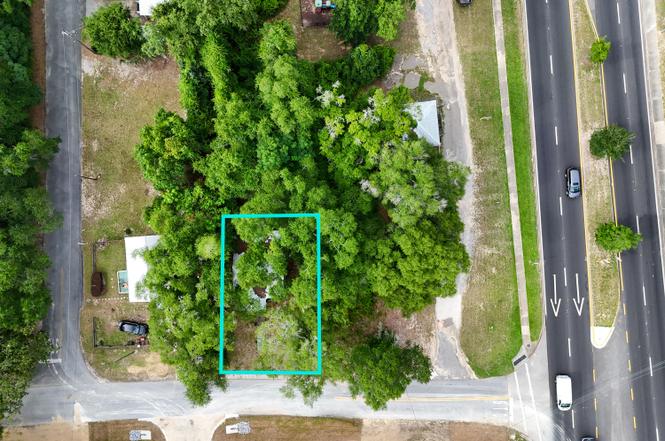
32 Myrtle Ave · DeFuniak Springs, FL
Flood risk 1/10 · Minimal
- FEMA flood zone
- X (unshaded)
- Chance of flooding over 30 yrs
- 0.0%
- Est. flood insurance / yr
- $507 – $1,088
Fire risk 4/10 · Minor
- Est. fire insurance / yr
- $947 – $1,759
Heat risk 9/10 · Severe
- Hot days now (above 107°F)
- 7 days/yr
- Hot days in 30 yrs
- 20 days/yr
Wind risk 9/10 · Severe
- Chance of severe wind over 30 yrs
- 99.0%
Air-quality risk 1/10 · Minimal
- Unhealthy air days now
- 0 days/yr
- Unhealthy air days in 30 yrs
- 0 days/yr
Risk factors via First Street. Map © Google.
Why this score? — see what drove the A- grade
The composite is a weighted blend of 9 inputs, each scored 0–100. Each bar is that input's sub-score; the figure is the points it added to the 100-point composite (weight × sub-score).
- Cash flow +30.0/30.0
- 1% rule +10.0/10.0
- DSCR +10.0/10.0
- Appreciation +10.0/10.0
- ARV discount +7.5/15.0
- Schools +5.2/10.0
- Livability +3.2/5.0
- Rent growth +2.5/5.0
- Condition / age +2.5/5.0
$75,000
🖨 Deal sheet 📄 Offer letter ✓ Due diligence
Listing remarks MLS
Fixer upper in downtown DeFuniak Springs. Zoned residential with commercial zoning across the street and on the adjacent lot that faces Hwy 331S. Is it in rough shape? Yes. Can it be salvaged? Sure thing. Could it be scraped and be ready for a new build with water and sewer taps paid? Also yes. You won't find another home (or vacant lot) anywhere near this price point downtown.
Key facts
- 7,405 sq ft lot
- Built 1900
Property features AI
Finance
- HOA & community: Located in the Town of Defuniak Springs subdivision
Exterior
- Utilities: Public water; Public sewer; Electric service
- Home design: Single-story home; Built in 1900
- Construction: Metal roof; Concrete and off-grade foundation; Wood siding
- Exterior features: Open porch; Wooded lot; City street frontage on a paved road
Interior
- Kitchen: First-floor kitchen
- Bedrooms: Three bedrooms on the first floor
- Bathrooms: One full bathroom on the first floor
- Heating & cooling: Central heating; Central air conditioning; Electric heat controls
- Interior features: First-floor living areas; Country architectural style
Neighborhood map
What this means for you Summary
Snapshot
- This is a 3-bed/1.0-bath single-family listed at $75k.
Deal economics
- At list price, monthly cash flow is $770 ($9k/yr) — positive.
- The deal already cash-flows at list — no discount required.
- Meets the 1% rule at list price ($2k rent vs $75k).
- Cap rate 18.6% vs local median 4.8% in DeFuniak Springs — top-decile yield for the area; either an underpriced asset or a hidden risk that comps aren't pricing in. Stress-test before assuming the spread holds.
Location & tenants
- Location reads 64/100 on livability (#694 in FL) — a middle-class / working-renter tenant base. Strengths: cost of living A+, housing A+; Watch: health & safety C-, crime D, amenities F.
- Walton (rural): math 62% / reading 61% proficiency, ranked #10 of 73 in FL (top 14%) — acceptable for families but not a draw, mixed tenant base, ~2y average lease.
- Zoned schools: West Defuniak Elementary School (math 67% / reading 57%, grade B, #608 of 2,144 statewide, top 29%, 669 students, 69% FRL); Walton High School (math 52% / reading 53%, grade C-, #154 of 667 statewide, top 24%, 856 students, 65% FRL) — zoned schools average 67% FRL vs 48% district-wide (19 pts higher); higher-poverty schools than district average — tighter screening recommended.
- Market conditions: 122 active listings in the ZIP; 3 comparable units currently listed for rent nearby; rentals at typical pace (median 21d on market — plan ~3-4 weeks tenant-placement turnaround); 2,883 units permitted in Walton County in 2024 (1,322 in 5+ unit buildings).
Forward outlook
- In year one you build about $8k of equity ($519 loan paydown + $8k appreciation (10.0% local appreciation)).
- Walton County population projected at +46% by 2050 — long-run rental-demand tailwind backs the buy-and-hold thesis.
- At projected returns (10.0% appreciation + 3.0% rent growth), your $21k cash investment doubles in ~2 years — after that, you're playing with house money.
- By year 5, paydown + projected appreciation supports a ~$37k cash-out refi (75% LTV) — recoverable capital for the next deal without selling this one.
Negotiation context
- Only 1 days on market — expect competitive offers; lowballing is unlikely to land.
- 2 sale attempts with the ask held roughly flat each time — persistent listings suggest the price (not the market) is what's stuck; bring a comps-based counter.
Risks & watch-outs
- Watch-outs: built in 1900 — expect roof / HVAC / electrical / plumbing capex.
- Climate carrying-cost: severe wind risk, 99% chance of damaging wind over 30y; extreme-heat days projected 7→20/yr by 2055 (HVAC capex compounding) — expect insurance premiums to compound above CPI over the hold.
Questions for the listing agent
- Built in 1900 — when were the roof, HVAC, electrical panel, plumbing, and water heater last replaced?
- Is there a deadline driving the sale (1031 exchange, divorce, estate, relocation)? That informs how much negotiation room exists.
- Schools are D-rated, which usually means shorter tenancies and higher turnover. Who's the typical renter profile here, and what's been the actual vacancy rate?
- Crime grade is D in this area — have there been break-ins, vandalism, or insurance claims at this property in the last 3 years? What carrier currently insures it and at what premium?
- What's the average days-on-market for RENTAL listings here right now (not sales)? A rising rental-DOM trend means longer vacancies and softer asking-rent achievability than the comps imply.
- What's the recent tenant-quality profile in this submarket — average credit score on applications, eviction rate, late-payment / NSF rate, and stable-employment percentage? A property-management company in the area should have these aggregated.
- How much new for-sale + rental construction is in the pipeline within 1–3 miles? Heavy new supply typically softens prices + rents 12–24 months out; constrained supply supports both.
Investment metrics
- 1% rule
- 2.06% ✓
- Cap rate
- 18.61%
- Cash-on-cash
- 43.99%
- DSCR
- 2.96
- GRM
- 4.0
CMA / ARV
- ARV (on-the-fly)
- $188,125
- Comps found
- 1
Show comp detail 1 sale within ~0.75 mi
| Address | Dist | Beds/Ba | Sqft | Sold | Price | $/sf | Match |
|---|---|---|---|---|---|---|---|
| 126 N 11th St | 0.69mi | 2/1.0 (-1) | 975 (+11%) | 7mo | $210,000 | $215 | 38 |
Match score weights: distance 35% · size 25% · config 20% · recency 20%. Top-matched comps best support the ARV.
Projected returns pro-forma
10.0% appreciation · 3.0% rent growth · sell at horizon
- IRR
- 58.5%
- Equity multiple
- 5.28×
- Total profit
- $89,860
- Equity at exit
- $67,566
- IRR
- 52.0%
- Equity multiple
- 11.76×
- Total profit
- $226,035
- Equity at exit
- $145,709
Cash invested: $21,000 (down + closing). Projections, not guarantees.
Landlord ↔ Tenant lean methodology
- Overall (STATE)
- 87 Strongly Landlord-Friendly
- State Florida
- 87 Strongly Landlord-Friendly · R+3
- County
- — inherits STATE
- City
- — inherits STATE
ZIP-level market 32435
- Home prices YoY
- 4.0%
- Active inventory
- 122
- Price-to-rent
- 4.0×
Monthly cashflow live
- Estimated rent
- $1,549 medium interval (Pro) →
- Mortgage (P&I)
- −$393
- Tax from tax record
- −$29 /mo · $349/yr
- Insurance
- −$31
- HOA
- −$0
- Vacancy / Maint / Mgmt
- −$325
- Net cashflow
- $770
Break-even live
UW: 25.0% down · 7.5% · 30yr · 1.5% tax · 5.0% vac · 8.0% maint · 8.0% mgmt
Financing live
Cash to close
- Down payment
- $18,750
- Closing costs
- $2,250
- Reserves months
- —
- Total cash needed
- —
Loan-product check · same deal, 3 products live
Conventional
25% down · 7.5% · 30yr
- Down + closing
- —
- Monthly P&I
- —
- Monthly cashflow
- —
- DSCR
- —
- Eligible?
- —
Personal DTI + credit; lowest rate.
DSCR
20% down · 8.5% · 30yr
- Down + closing
- —
- Monthly P&I
- —
- Monthly cashflow
- —
- DSCR
- —
- Eligible?
- —
No personal income docs; deal must DSCR.
Hard money
10% down · 12.0% · 12mo
- Down + closing
- —
- Monthly P&I
- —
- Monthly cashflow
- —
- DSCR
- —
- Eligible?
- —
Short-term bridge; refi at stabilization.
Rent comps 3 comps
| Address | Beds | Baths | Sqft | Rent | $/sqft | DOM | Units | Dist |
|---|---|---|---|---|---|---|---|---|
| 709 S 11th St Defuniak Springs, FL | 2.0 | 1.0 | 1076 | $1,499 | $1.39 | 21d | 1 | 0.32mi |
| 163 W Chaffin Ave Defuniak Springs, FL | 2.0 | 2.0 | 990 | $1,600 | $1.62 | 21d | 1 | 0.68mi |
| 712 Bruce Ave Defuniak Springs, FL | 3.0 | 2.0 | 1040 | $1,600 | $1.54 | 13d | 1 | 0.72mi |
Listing history 2 events
-
2026-06-17remarks 380-char remark
Show marketing remark (380 chars)
Fixer upper in downtown DeFuniak Springs. Zoned residential with commercial zoning across the street and on the adjacent lot that faces Hwy 331S. Is it in rough shape? Yes. Can it be salvaged? Sure thing. Could it be scraped and be ready for a new build with water and sewer taps paid? Also yes. You won't find another home (or vacant lot) anywhere near this price point downtown.
-
2026-06-17$75,000 Active 1 DOM
Show marketing remark (380 chars)
Fixer upper in downtown DeFuniak Springs. Zoned residential with commercial zoning across the street and on the adjacent lot that faces Hwy 331S. Is it in rough shape? Yes. Can it be salvaged? Sure thing. Could it be scraped and be ready for a new build with water and sewer taps paid? Also yes. You won't find another home (or vacant lot) anywhere near this price point downtown.
ⓘ Source: listings_history table (triggers on properties + properties_extension) + one-shot
backfill from property_details.listing_events for pre-trigger history.
Tax reassessment forecast FL · Resets to sale price
- Current annual tax
- $349 · $29/mo
- Projected year-2 tax
- $622 · $52/mo
- Expected delta
- +$274/yr (+$23/mo · 78.6%)
ⓘ Screening estimate from a state-policy table — verify with the county assessor before closing.
Climate risk First Street
- Flood 1/10 Low FEMA zone X (unshaded) · 0% chance over 30 yrs
- Wildfire 4/10 Moderate
- Heat 9/10 Extreme 7 d/yr ≥107°F today · 20 d/yr by 30 yrs out
- Wind 9/10 Extreme 99% chance of damaging wind over 30 yrs
- Air quality 1/10 Low 0 unhealthy d/yr today · 0 by 30 yrs out
Nearby sold comps map
Loading sold comps map…
Walkable amenities ~0.75 mi
Loading nearby amenities…
Taxation est. · year 1
- Rental income
- $18,584
- − Mortgage interest
- −$4,201
- − Property taxes
- −$349
- − Insurance
- −$375
- − Repairs & maintenance
- −$1,487
- − Management
- −$1,487
- − Depreciation
- −$2,182
- Taxable income
- $8,504
- Est. tax owed @ 24.0%
- −$2,041
- After-tax cash flow
- $7,197/yr
For passive investors: Depreciation is non-cash, so a rental often shows a tax loss while cash-flowing — sheltering income. Rental losses are passive: they offset passive income freely, and up to $25,000/yr can offset ordinary (W-2) income if you actively participate and your MAGI is under $100k (phasing out to $0 by $150k); unused losses carry forward. On sale, claimed depreciation is recaptured at up to 25%, and gains may owe capital-gains tax (a 1031 exchange can defer both). Figures are a year-1 estimate at your 24.0% rate — not tax advice; consult a CPA.
Schools (NCES district)
- District
- Walton
- NCES district ID
- 1201980
- Math proficiency
- 62% ▼ -4.00%
- Reading proficiency
- 61% ▼ -2.00%
- Median HH income
- $46,794
- Composite
- 52.03/100
- National rank
- #1634
- State rank
- #10 of 73 in FL
Livability — DeFuniak Springs
- Score
- 64/100
- State rank
- #694
- US rank
- #14475
Category grades
Schools grade is shown separately in the Schools card above.
Census & demographics
- Census place
- DeFuniak Springs, FL
- City population
- 19,746
- Population (ZIP)
- 6,359
Population outlook (Walton County) Hauer SSP2
- Today (2025)
- 80,014 people
- By 2030
- 88,120 · +10.1%
- By 2040
- 103,537 · +29.4%
- By 2050
- 117,034 · +46.3%
- By 2075
- 143,901 · +79.8%
- By 2100
- 155,138 · +93.9%
Race, ethnicity, and origin ACS 2023
- Neighborhood character
- Predominantly White (83%)
- Race & ethnicity
- White 83% Black 6% Two or more races 6% Hispanic / Latino 4%
- Common ancestry
- Slovak 5% Scottish 2% Serbian 1%
- Foreign-born
- 3% · Canada
- Languages at home
- 97% English-only · Spanish 2%
Political lean MEDSL · Walton
- 2024 margin
- Solid R (+57.8) · D 20.7% · R 78.6%
- 2008→2024 swing
- -12.0pp toward R · 2008: -45.8pp · 2024: -57.8pp
- All cycles
- 2024: R+57.8 2020: R+51.7 2016: R+56.1 2012: R+52.0 2008: R+45.8
Not yet ingested
- Civics
- —
Market trends
- HPI YoY
- ▲ 12.25%
- Current HPI
- 314.8146
- Rent YoY
- —
- Metro
- —
- State GDP YoY
- ▲ 3.28%
- F500 in state
- 36
Industry mix (Fortune 500 HQ in FL)
| Industry | F500 HQs | Revenue |
|---|---|---|
| Industrial Technology | 2 | $29B |
|
||
| Insurance | 2 | $17B |
|
||
| Retail | 1 | $60B |
|
||
| Technology Distribution | 1 | $58B |
|
||
| Homebuilding | 1 | $35B |
|
||
| Technology Manufacturing | 1 | $35B |
|
||
Price history
+0.0% since first listed2 events — show timeline
- 2026-06-17 Listed $75,000 ECAR
- 2026-06-17 Listed $75,000 ECAR
Property tax history
+5.0%/yrLatest (2025): $349 · +4.3% YoY. Source: county tax records.
Cash-flow waterfall
monthlySold comps — $/sqft
last 12 mo · ≤1 miLoading sold comps…