2600 SE Ocean Blvd Unit Bb2 · Stuart, FL
Flood risk 7/10 · Major
- FEMA flood zone
- X (unshaded)
- Chance of flooding over 30 yrs
- 0.95%
- Est. flood insurance / yr
- $507 – $1,088
Fire risk 1/10 · Minimal
- Est. fire insurance / yr
- $947 – $1,759
Heat risk 10/10 · Severe
- Hot days now (above 106°F)
- 7 days/yr
- Hot days in 30 yrs
- 26 days/yr
Wind risk 10/10 · Severe
- Chance of severe wind over 30 yrs
- 99.0%
Air-quality risk 2/10 · Minimal
- Unhealthy air days now
- 2 days/yr
- Unhealthy air days in 30 yrs
- 2 days/yr
Risk factors via First Street. Map © Google.
Why this score? — see what drove the B+ grade
The composite is a weighted blend of 9 inputs, each scored 0–100. Each bar is that input's sub-score; the figure is the points it added to the 100-point composite (weight × sub-score).
- Cash flow +27.6/30.0
- 1% rule +10.0/10.0
- Appreciation +10.0/10.0
- DSCR +9.7/10.0
- ARV discount +7.5/15.0
- Schools +4.5/10.0
- Livability +4.2/5.0
- Rent growth +2.5/5.0
- Condition / age +2.5/5.0
$155,000
🖨 Deal sheet (PDF) 📄 Offer letter ✓ Due diligence
Listing remarks MLS
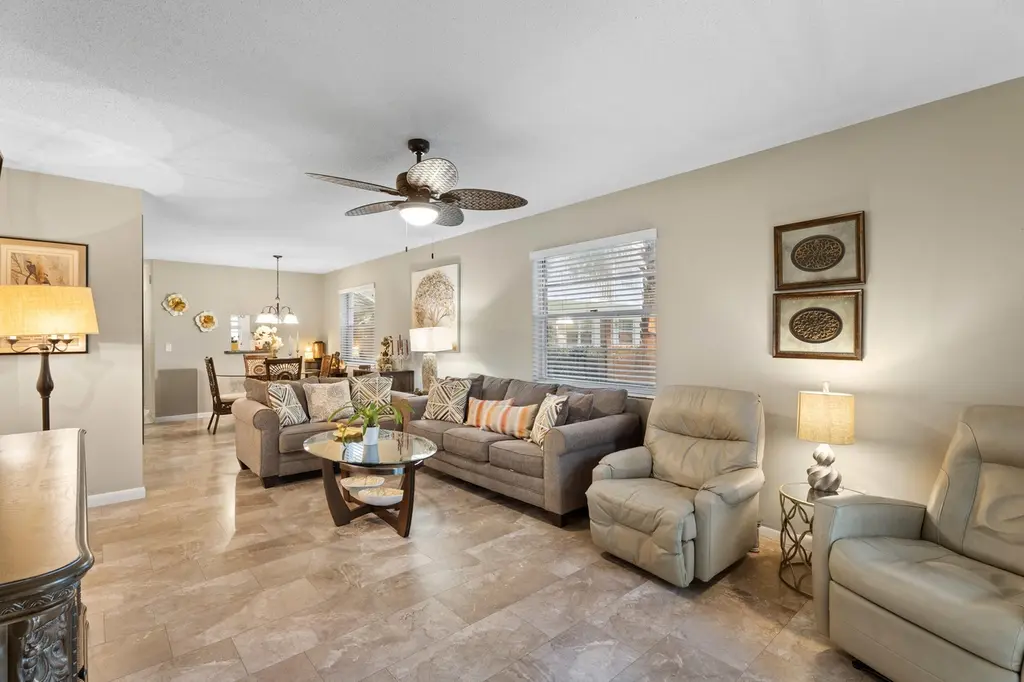
First Floor End Unit with quiet garden views. Electrical panel and water heater replaced 2019. Refrigerator 2019, Laminate flooring 2018. Master Bath is Handicap Accessible. Guest Bath has a Barn Door. Partially Furnished. great location at front of subdivision. walk to restaurants and shopping. minutes to Stuart beaches. Active 55+ community. Clubhouse, pool, fitness center, billiards and more. No pets. No renting for first two years of ownership. Being sold AS IS.
Key facts
- $586 HOA
- Parking
- Community pool
Property features AI
Finance
- Other: Senior community
- Financial info: Pets not allowed
- HOA & community: Part of Vista Pines association; Monthly HOA fee; Association amenities: billiard room, clubhouse, fitness center, game room, laundry, management, picnic area, parking, pool, shuffleboard court, storage, on-site manager, bike storage, bocce ball, business center, community room, kitchen facilities, library, lobby, recreation facilities; HOA fee includes cable TV, grounds maintenance, sewer, trash, water, common areas, legal/accounting, reserve funds, roof repairs, recreation facility
Exterior
- Parking: Assigned parking; Guest parking; Open parking (1 space)
- Security: Closed-circuit cameras; Smoke detectors
- Utilities: Public water; Public sewer; 100 Amp electric service; Cable available; Electricity available; Water available; Sewer available
- Home design: Condominium; One story; West-facing; Resale condition
- Construction: Block, concrete and stucco construction; Mansard/other roof
- Exterior features: Screened patio; Patio; Paved road access; Not waterfront
Interior
- Kitchen: Electric range; Microwave; Refrigerator
- Bedrooms: 2 bedrooms on the main level
- Flooring: Laminate; Tile
- Bathrooms: 2 full bathrooms on the main level
- Heating & cooling: Electric heating (central individual); Central air; Ceiling fan(s); Electric cooling
- Interior features: Walk-in closet(s); Partially furnished; Fireplace
- Laundry & utility: Common area laundry
Neighborhood map
What this means for you Summary
Snapshot
- This is a 2-bed/2.0-bath condo listed at $155k.
Deal economics
- At list price, monthly cash flow is $397 ($5k/yr) — positive.
- The deal already cash-flows at list — no discount required.
- Meets the 1% rule at list price ($3k rent vs $155k).
- Recommended offer: $153k (1.5% below list) — sets the bar for market timing.
Location & tenants
- Location reads 84/100 on livability (#39 in FL, #790 nationally) — a professional / high-income tenant draw. Strengths: commute A+, housing A+, health & safety A+; Watch: crime C-, employment C-, amenities D.
- Martin (suburban): math 52% / reading 53% proficiency, ranked #24 of 73 in FL (top 33%) — acceptable for families but not a draw, mixed tenant base, ~2y average lease.
- Zoned schools: Stuart Middle School (math 55% / reading 55%, grade B-, #180 of 571 statewide, top 32%, 867 students, 49% FRL); Jensen Beach High School (math 53% / reading 71%, grade B-, #98 of 667 statewide, top 15%, 1,584 students, 36% FRL) — zoned schools at 42% FRL track the district average.
- Market conditions: 251 active listings in the ZIP; 15 comparable units currently listed for rent nearby; rentals at typical pace (median 24d on market — plan ~3-4 weeks tenant-placement turnaround); solid renter incomes; 737 units permitted in Martin County in 2024 (167 in 5+ unit buildings).
Forward outlook
- In year one you build about $17k of equity ($1k loan paydown + $16k appreciation (10.0% local appreciation)).
- Martin County population projected at +19% by 2050 — long-run rental-demand tailwind backs the buy-and-hold thesis.
- At projected returns (10.0% appreciation + 3.0% rent growth), your $43k cash investment doubles in ~2 years — after that, you're playing with house money.
- By year 3, paydown + projected appreciation supports a ~$42k cash-out refi (75% LTV) — recoverable capital for the next deal without selling this one.
Negotiation context
- It's been on market 15 days — a 2% lower offer ($153k) is reasonable based on typical stale-listing flexibility.
- 2 sale attempts since 7y ago with the ask held roughly flat each time — persistent listings suggest the price (not the market) is what's stuck; bring a comps-based counter.
- Current owner paid $92k; list at $155k implies a 68% gain — meaningful room to come down on a strong offer.
Risks & watch-outs
- Watch-outs: flood insurance adds $66/mo; HOA is 23% of rent.
- Climate carrying-cost: major flood risk; severe wind risk, 99% chance of damaging wind over 30y; extreme-heat days projected 7→26/yr by 2055 (HVAC capex compounding) — expect insurance premiums to compound above CPI over the hold.
Questions for the listing agent
- Built in 1972 — when were the roof, HVAC, electrical panel, plumbing, and water heater last replaced?
- What's the actual annual flood-insurance premium (NFIP or private), and is the property in a SFHA with mandatory coverage?
- What does the HOA fee cover, when was the last increase, and are there any pending special assessments or reserve-fund shortfalls?
- Any open or pending special assessments — roof, HVAC, plumbing, elevator, façade? What's the per-unit balance and payoff schedule, and is the seller paying it off at close or rolling it to the buyer?
- Is there a deadline driving the sale (1031 exchange, divorce, estate, relocation)? That informs how much negotiation room exists.
- Schools are A-rated — typically a magnet for longer-tenancy family renters. What's the average tenant stay here, and is there a school-zone premium baked into asking?
- What's the average days-on-market for RENTAL listings here right now (not sales)? A rising rental-DOM trend means longer vacancies and softer asking-rent achievability than the comps imply.
- What's the recent tenant-quality profile in this submarket — average credit score on applications, eviction rate, late-payment / NSF rate, and stable-employment percentage? A property-management company in the area should have these aggregated.
- How much new apartment / multifamily construction is in the pipeline within 1–3 miles? Heavy new supply (>2% of stock underway) typically softens rents 12–24 months out; light construction supports rent growth.
Investment metrics
- 1% rule
- 1.67% ✓
- Cap rate
- 9.88%
- Cash-on-cash
- 12.82%
- DSCR
- 1.57
- GRM
- 5.0
CMA / ARV
No comps found within radius.
Projected returns pro-forma
10.0% appreciation · 3.0% rent growth · sell at horizon
- IRR
- 32.4%
- Equity multiple
- 3.54×
- Total profit
- $110,107
- Equity at exit
- $139,636
- IRR
- 28.1%
- Equity multiple
- 8.03×
- Total profit
- $305,141
- Equity at exit
- $301,131
Cash invested: $43,400 (down + closing). Projections, not guarantees.
Landlord ↔ Tenant lean methodology
- Overall (STATE)
- 87 Strongly Landlord-Friendly
- State Florida
- 87 Strongly Landlord-Friendly · R+3
- County
- — inherits STATE
- City
- — inherits STATE
ZIP-level market 34996
- Home prices YoY
- 2.1%
- Active inventory
- 251
- Price-to-rent
- 5.0×
Monthly cashflow live
- Estimated rent
- $2,592 high interval (Pro) →
- Mortgage (P&I)
- −$813
- Tax from tax record
- −$121 /mo · $1,448/yr
- Insurance
- −$65
- Flood insurance flood zone
- −$66 /mo · $798/yr
- HOA
- −$586
- Vacancy / Maint / Mgmt
- −$544
- Net cashflow
- $397
Break-even live
Sensitivity live
| Price | -10% $485 | -5% $441 | +0% $397 | +5% $353 | +10% $309 |
|---|---|---|---|---|---|
| Rent | -10% $192 | -5% $295 | +0% $397 | +5% $500 | +10% $602 |
| Rate | -1.0pp $475 | -0.5pp $437 | base $397 | +0.5pp $357 | +1.0pp $316 |
UW: 25.0% down · 7.5% · 30yr · 1.5% tax · 5.0% vac · 8.0% maint · 8.0% mgmt
Financing live
Cash to close
- Down payment
- $38,750
- Closing costs
- $4,650
- Reserves months
- —
- Total cash needed
- —
Loan-product check · same deal, 3 products live
Conventional
25% down · 7.5% · 30yr
- Down + closing
- —
- Monthly P&I
- —
- Monthly cashflow
- —
- DSCR
- —
- Eligible?
- —
Personal DTI + credit; lowest rate.
DSCR
20% down · 8.5% · 30yr
- Down + closing
- —
- Monthly P&I
- —
- Monthly cashflow
- —
- DSCR
- —
- Eligible?
- —
No personal income docs; deal must DSCR.
Hard money
10% down · 12.0% · 12mo
- Down + closing
- —
- Monthly P&I
- —
- Monthly cashflow
- —
- DSCR
- —
- Eligible?
- —
Short-term bridge; refi at stabilization.
Rent comps 15 comps
| Address | Beds | Baths | Sqft | Rent | $/sqft | DOM | Units | Dist |
|---|---|---|---|---|---|---|---|---|
| 2600 SE Ocean Blvd Stuart, FL | 1.0–2.0 | 1.5–2.0 | 951 | $1,900 | $2.00 | 14d | 3 | 0.07mi |
| 2929 SE Ocean Blvd Stuart, FL | 1.0–2.0 | 1.0–2.0 | 812 | $2,400 | $2.96 | 24d | 6 | 0.27mi |
| 2929 SE Ocean Blvd Stuart, FL | 1.0–2.0 | 1.0–2.0 | 812 | $2,400 | $2.96 | 14d | 8 | 0.27mi |
| 2950 SE Ocean Blvd Stuart, FL | 2.0 | 2.0 | 1157 | $1,800 | $1.56 | 14d | 3 | 0.27mi |
| 2929 SE Ocean Blvd Unit 130 Stuart, FL | 2.0 | 2.0 | 1005 | $1,800 | $1.79 | 24d | 1 | 0.34mi |
| 300 SE Saint Lucie Blvd Stuart, FL | 1.0–3.0 | 1.0–2.0 | 884 | $2,258 | $2.55 | 14d | 12 | 0.42mi |
| 1196 SE Saint Lucie Blvd Stuart, FL | 2.0 | 2.0 | 1309 | $4,300 | $3.28 | 24d | 1 | 0.49mi |
| 262 SE Monterey Ave Stuart, FL | 3.0 | 1.0 | 1001 | $3,500 | $3.50 | 24d | 1 | 0.56mi |
| 333 SE Martin Ave Unit 1F Stuart, FL | 2.0 | 1.0 | 778 | $1,800 | $2.31 | 24d | 1 | 0.61mi |
| 175 SE Saint Lucie Blvd Stuart, FL | 2.0 | 2.0–2.5 | 1300 | $2,600 | $2.00 | 24d | 4 | 0.62mi |
| 150 SE Four Winds Dr Unit B303 Stuart, FL | 2.0 | 2.0 | 1359 | $2,500 | $1.84 | 24d | 1 | 0.75mi |
| 1800 SE Saint Lucie Blvd Stuart, FL | 2.0 | 2.0 | 1044 | $2,600 | $2.49 | 24d | 3 | 0.93mi |
| 217 SE Coconut Ave Stuart, FL | 2.0 | 1.0 | 1197 | $5,000 | $4.18 | 24d | 1 | 1.13mi |
| 917 SE Nassau Ave Stuart, FL | 2.0 | 1.0 | 832 | $3,800 | $4.57 | 24d | 1 | 1.47mi |
| 917 SE Nassau Ave Stuart, FL | 2.0 | 1.0 | 832 | $1,900 | $2.28 | 21d | 1 | 1.47mi |
HOA detail condo
- Monthly dues
- $586 · $7,032/yr
- Likely covers
- waterelectricpoolgym
- Assessments
- None detected in remarks — confirm with the listing agent.
Listing history 11 events
-
2026-06-18days on market $155,000 Active 15 DOM
-
2026-06-17days on market $155,000 Active 14 DOM
-
2026-06-16days on market $155,000 Active 13 DOM
-
2026-06-15days on market $155,000 Active 12 DOM
-
2026-06-14days on market $155,000 Active 10 DOM
-
2026-06-13days on market $155,000 Active 9 DOM
-
2026-06-10days on market $155,000 Active 7 DOM
-
2026-06-09days on market $155,000 Active 6 DOM
-
2026-06-08days on market $155,000 Active 5 DOM
-
2026-06-07remarks 699-char remark
-
2026-06-07$155,000 Active 4 DOM
ⓘ Source: listings_history table (triggers on properties + properties_extension) + one-shot
backfill from property_details.listing_events for pre-trigger history.
Tax reassessment forecast FL · Resets to sale price
- Current annual tax
- $1,448 · $121/mo
- Projected year-2 tax
- $1,448 · $121/mo
- Expected delta
- $0/yr ($0/mo · 0.0%)
ⓘ Screening estimate from a state-policy table — verify with the county assessor before closing.
Climate risk First Street
- Flood 7/10 Severe FEMA zone X (unshaded) · 95% chance over 30 yrs
- Wildfire 1/10 Low
- Heat 10/10 Extreme 7 d/yr ≥106°F today · 26 d/yr by 30 yrs out
- Wind 10/10 Extreme 99% chance of damaging wind over 30 yrs
- Air quality 2/10 Low 2 unhealthy d/yr today · 2 by 30 yrs out
Nearby sold comps map
Loading sold comps map…
Walkable amenities ~0.75 mi
Loading nearby amenities…
Taxation est. · year 1
- Rental income
- $31,104
- − Mortgage interest
- −$8,682
- − Property taxes
- −$1,448
- − Insurance
- −$1,572
- − Repairs & maintenance
- −$2,488
- − Management
- −$2,488
- − HOA
- −$7,032
- − Depreciation
- −$4,509
- Taxable income
- $2,884
- Est. tax owed @ 24.0%
- −$692
- After-tax cash flow
- $4,074/yr
For passive investors: Depreciation is non-cash, so a rental often shows a tax loss while cash-flowing — sheltering income. Rental losses are passive: they offset passive income freely, and up to $25,000/yr can offset ordinary (W-2) income if you actively participate and your MAGI is under $100k (phasing out to $0 by $150k); unused losses carry forward. On sale, claimed depreciation is recaptured at up to 25%, and gains may owe capital-gains tax (a 1031 exchange can defer both). Figures are a year-1 estimate at your 24.0% rate — not tax advice; consult a CPA.
Schools (NCES district)
- District
- Martin
- NCES district ID
- 1201290
- Math proficiency
- 52% ▼ -14.00%
- Reading proficiency
- 53% ▼ -4.00%
- Median HH income
- $52,482
- Composite
- 45.1/100
- National rank
- #2690
- State rank
- #24 of 73 in FL
Livability — Stuart
- Score
- 84/100
- State rank
- #39
- US rank
- #790
Category grades
Schools grade is shown separately in the Schools card above.
Census & demographics
- Census place
- Stuart, FL
- County
- Martin County · 165,223 people
- City population
- 65,812
- Metro
- Port St. Lucie, FL
- Population (ZIP)
- 10,653
- Household income
- $83,929
- Rent vs Own
- Severe rent burden
- 247.0
Population outlook (Martin County) Hauer SSP2
- Today (2025)
- 172,383 people
- By 2030
- 180,192 · +4.5%
- By 2040
- 194,114 · +12.6%
- By 2050
- 204,992 · +18.9%
- By 2075
- 229,641 · +33.2%
- By 2100
- 232,146 · +34.7%
Race, ethnicity, and origin ACS 2023
- Neighborhood character
- Predominantly White (90%)
- Race & ethnicity
- White 90% Hispanic / Latino 7% Two or more races 5%
- Hispanic origin (detail)
- Puerto Rican 2%
- Common ancestry
- Italian 3% Romanian 3% Slovak 3%
- Foreign-born
- 6% · Canada
- Languages at home
- 94% English-only · Spanish 3% Other Indo-European 1% French/Haitian/Cajun 1%
Political lean MEDSL · Martin
- 2024 margin
- Solid R (+31.1) · D 34.1% · R 65.2%
- 2008→2024 swing
- -17.5pp toward R · 2008: -13.6pp · 2024: -31.1pp
- All cycles
- 2024: R+31.1 2020: R+24.6 2016: R+26.9 2012: R+22.9 2008: R+13.6
Not yet ingested
- Civics
- —
Market trends
- HPI YoY
- ▲ 13.71%
- Current HPI
- 658.96
- Rent YoY
- —
- Metro
- Port St. Lucie, FL
- State GDP YoY
- ▲ 3.28%
- F500 in state
- 36
Industry mix (Fortune 500 HQ in FL)
| Industry | F500 HQs | Revenue |
|---|---|---|
| Industrial Technology | 2 | $29B |
|
||
| Insurance | 2 | $17B |
|
||
| Retail | 1 | $60B |
|
||
| Technology Distribution | 1 | $58B |
|
||
| Homebuilding | 1 | $35B |
|
||
| Technology Manufacturing | 1 | $35B |
|
||
Price history
+222.9% since first listed9 events — show timeline
- 2026-06-03 Listed $155,000 Beaches MLS
- 2020-04-28 Sold (Public Records) $92,500 Public Records
- 2020-04-24 Sold (MLS) $92,500 MCRTC
- 2020-04-13 Pending — MCRTC
- 2020-03-14 Contingent — MCRTC
- 2020-02-06 Price Changed $99,000 MCRTC
- 2019-11-22 Listed $109,000 MCRTC
- 2011-07-20 Sold (Public Records) $50,000 Public Records
- 1995-01-25 Sold (Public Records) $48,000 Public Records
Property tax history
+10.9%/yrLatest (2025): $1,448 · -0.4% YoY. Source: county tax records.
Cash-flow waterfall
monthlySold comps — $/sqft
last 12 mo · ≤1 miLoading sold comps…