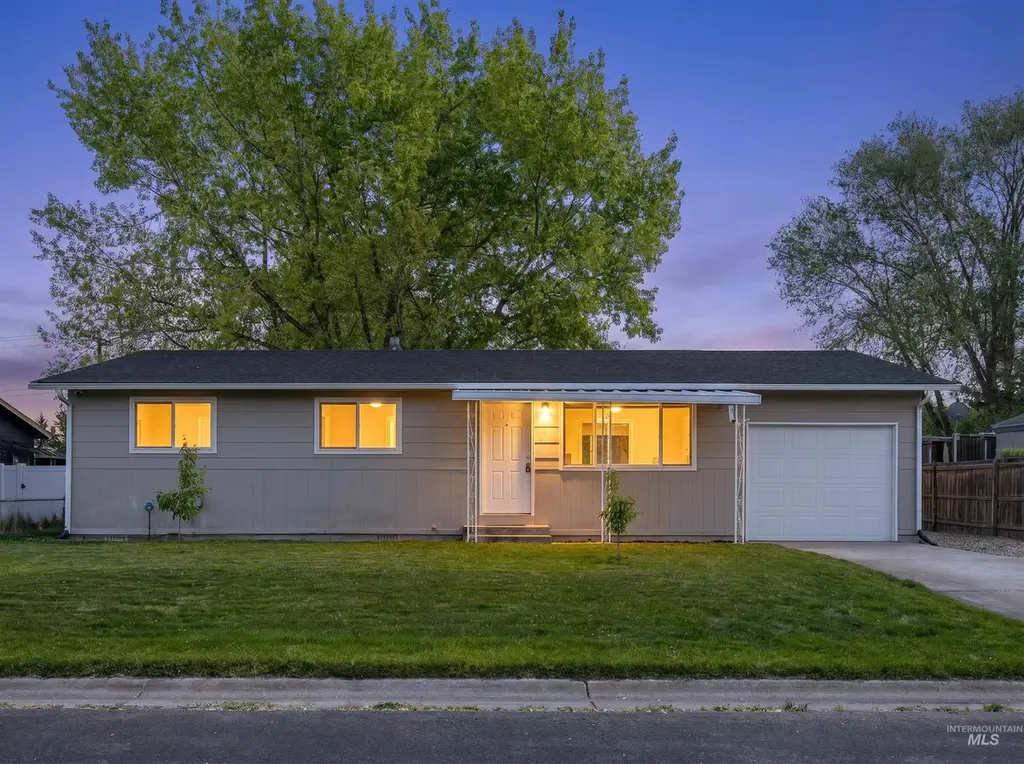
9 Villa Dr · Middleton, ID
Flood risk 5/10 · Moderate
- FEMA flood zone
- X (unshaded)
- Chance of flooding over 30 yrs
- 0.57%
- Est. flood insurance / yr
- $507 – $1,088
Fire risk 5/10 · Moderate
- Est. fire insurance / yr
- $584 – $1,086
Heat risk 5/10 · Moderate
- Hot days now (above 98°F)
- 7 days/yr
- Hot days in 30 yrs
- 19 days/yr
Wind risk 1/10 · Minimal
- Chance of severe wind over 30 yrs
- —
Air-quality risk 8/10 · Major
- Unhealthy air days now
- 16 days/yr
- Unhealthy air days in 30 yrs
- 19 days/yr
Risk factors via First Street. Map © Google.
Why this score? — see what drove the D grade
The composite is a weighted blend of 9 inputs, each scored 0–100. Each bar is that input's sub-score; the figure is the points it added to the 100-point composite (weight × sub-score).
- Cash flow +13.8/30.0
- ARV discount +7.5/15.0
- Schools +4.3/10.0
- DSCR +4.2/10.0
- Livability +3.9/5.0
- 1% rule +2.6/10.0
- Rent growth +2.5/5.0
- Condition / age +2.5/5.0
- Appreciation +0.0/10.0
$314,900
🖨 Deal sheet 📄 Offer letter ✓ Due diligence
Listing remarks
Move-in ready and full of value, this charming home is nestled in a great neighborhood and offers the perfect opportunity for first-time buyers or those looking to downsize without compromise. Thoughtfully updated and well maintained, it’s ready for you to settle in from day one. The kitchen was remodeled in 2018, complemented by newer appliances, a newer roof, and fresh interior paint, giving the home a clean, updated feel throughout. New AC in 2020. Step outside to a large, fully fenced, private yard with apple trees, rasberries and grapes - deal for relaxing, entertaining, or letting pets and kids play freely. The automatic sprinkler system is powered by an on-site irrigation well,
Key facts
- 6,969 sq ft lot
- Garage
- Built 1975
Property features AI
Finance
- HOA & community: Located in the Canyon Villa subdivision
Exterior
- Parking: Attached garage (1 covered space / 1 total parking)
- Utilities: City water service; Sewer connected; Cable connected; Broadband internet
- Home design: Single-family residence; Built in 1975
- Construction: Frame construction; Composition roof; Crawl space foundation
- Exterior features: Full wood fencing; Storage shed; Auto sprinkler / full sprinkler system; Standard lot in a subdivision; Public paved road frontage
Interior
- Kitchen: Dishwasher; Disposal; Oven/range (freestanding); Refrigerator
- Bedrooms: 3 bedrooms (all on the main level) — primary approx. 12 x 10; bedroom 2 approx. 13 x 9/13; bedroom 3 approx. 12 x 9
- Flooring: Carpet; Vinyl
- Bathrooms: 1 bathroom
- Heating & cooling: Forced-air heating (natural gas); Central air conditioning
- Interior features: Main-level primary bedroom; Laminate countertops
- Laundry & utility: Electric water heater
Neighborhood map
What this means for you Summary
Snapshot
- This is a 3-bed/1.0-bath other listed at $315k.
Deal economics
- At list price, monthly cash flow is $28 ($337/yr) — positive.
- The deal already cash-flows at list — no discount required.
- To meet the 1% rule (rent ≥ 1% of price), the offer needs to be $239k (24.2% below list).
- Recommended offer: $239k (24.2% below list) — sets the bar for 1% rule.
- Cap rate 6.4% vs local median 2.4% in Middleton — top-decile yield for the area; either an underpriced asset or a hidden risk that comps aren't pricing in. Stress-test before assuming the spread holds.
Location & tenants
- Location reads 77/100 on livability (#22 in ID, #3,173 nationally) — a middle-class / working-renter tenant base. Strengths: crime A+, housing A+, health & safety A+; Watch: amenities F, commute F.
- Middleton District (suburban): math 41% / reading 58% proficiency, ranked #29 of 92 in ID (top 32%) — families likely to look elsewhere, expect single-tenant / working-renter base with shorter leases.
- Zoned schools: Middleton Mill Creek Elementary (math 52% / reading 60%, grade C+, #102 of 357 statewide, top 29%, 755 students, 18% FRL); Middleton Academy (math 5% / reading 44%, grade F, #132 of 169 statewide, top 78%, 161 students, 34% FRL).
- Market conditions: 461 active listings in the ZIP; 2 comparable units currently listed for rent nearby; solid renter incomes; 3,620 units permitted in Canyon County in 2024 (196 in 5+ unit buildings).
Forward outlook
- Local home prices are declining (-3.0%/yr); year-one equity from $2k of loan paydown is wiped out by about $9k of value loss. Plan a longer hold.
- Canyon County population projected at +41% by 2050 — long-run rental-demand tailwind backs the buy-and-hold thesis.
Negotiation context
- Only 3 days on market — expect competitive offers; lowballing is unlikely to land.
- 5 sale attempts since 21y ago with the ask held roughly flat each time — persistent listings suggest the price (not the market) is what's stuck; bring a comps-based counter.
Risks & watch-outs
- Climate carrying-cost: moderate flood risk; moderate wildfire risk; extreme-heat days projected 7→19/yr by 2055 (HVAC capex compounding) — expect insurance premiums to compound above CPI over the hold.
Questions for the listing agent
- Built in 1975 — when were the roof, HVAC, electrical panel, plumbing, and water heater last replaced?
- Is there a deadline driving the sale (1031 exchange, divorce, estate, relocation)? That informs how much negotiation room exists.
- The area grade is low — what's the realistic commute time and amenity access for the typical tenant pool here? Any planned neighborhood developments (good or bad) we should know about?
- What's the average days-on-market for RENTAL listings here right now (not sales)? A rising rental-DOM trend means longer vacancies and softer asking-rent achievability than the comps imply.
- What's the recent tenant-quality profile in this submarket — average credit score on applications, eviction rate, late-payment / NSF rate, and stable-employment percentage? A property-management company in the area should have these aggregated.
- How much new for-sale + rental construction is in the pipeline within 1–3 miles? Heavy new supply typically softens prices + rents 12–24 months out; constrained supply supports both.
Investment metrics
- 1% rule
- 0.76% ✗
- Cap rate
- 6.40%
- Cash-on-cash
- 0.38%
- DSCR
- 1.02
- GRM
- 11.0
CMA / ARV
No comps found within radius.
Projected returns pro-forma
-3.0% appreciation · 3.0% rent growth · sell at horizon
- IRR
- -15.8%
- Equity multiple
- 0.44×
- Total profit
- $-49,395
- Equity at exit
- $46,953
- IRR
- -7.4%
- Equity multiple
- 0.53×
- Total profit
- $-41,352
- Equity at exit
- $27,227
Cash invested: $88,172 (down + closing). Projections, not guarantees.
Landlord ↔ Tenant lean methodology
- Overall (STATE)
- 91 Strongly Landlord-Friendly
- State Idaho
- 91 Strongly Landlord-Friendly · R+18
- County
- — inherits STATE
- City
- — inherits STATE
ZIP-level market 83644
- Active inventory
- 461
- Price-to-rent
- 11.0×
Monthly cashflow live
- Estimated rent
- $2,388 medium interval (Pro) →
- Mortgage (P&I)
- −$1,651
- Tax from tax record
- −$76 /mo · $914/yr
- Insurance
- −$131
- HOA
- −$0
- Vacancy / Maint / Mgmt
- −$502
- Net cashflow
- $28
Break-even live
UW: 25.0% down · 7.5% · 30yr · 1.5% tax · 5.0% vac · 8.0% maint · 8.0% mgmt
Financing live
Cash to close
- Down payment
- $78,725
- Closing costs
- $9,447
- Reserves months
- —
- Total cash needed
- —
Loan-product check · same deal, 3 products live
Conventional
25% down · 7.5% · 30yr
- Down + closing
- —
- Monthly P&I
- —
- Monthly cashflow
- —
- DSCR
- —
- Eligible?
- —
Personal DTI + credit; lowest rate.
DSCR
20% down · 8.5% · 30yr
- Down + closing
- —
- Monthly P&I
- —
- Monthly cashflow
- —
- DSCR
- —
- Eligible?
- —
No personal income docs; deal must DSCR.
Hard money
10% down · 12.0% · 12mo
- Down + closing
- —
- Monthly P&I
- —
- Monthly cashflow
- —
- DSCR
- —
- Eligible?
- —
Short-term bridge; refi at stabilization.
Rent comps 2 comps
| Address | Beds | Baths | Sqft | Rent | $/sqft | DOM | Units | Dist |
|---|---|---|---|---|---|---|---|---|
| 979 Peregrine Dr Middleton, ID | 3.0 | 2.0 | 1349 | $2,350 | $1.74 | 3d | 1 | 0.48mi |
| 10996 Willis Rd Middleton, ID | 3.0 | 2.0 | 1424 | $2,195 | $1.54 | 2d | 1 | 1.05mi |
Listing history 12 events
-
2026-05-12status Pending
-
2026-05-08$314,900 Active
-
2020-03-17soldstatus Sold
-
2020-03-17soldstatus
-
2020-02-10status Pending
-
2020-02-08$189,900 Active
-
2018-01-21historical
-
2018-01-12status Pending
-
2018-01-11$127,900 Active
-
2011-01-05$42,500
-
2005-12-21soldstatus
-
2005-11-01$89,900
ⓘ Source: listings_history table (triggers on properties + properties_extension) + one-shot
backfill from property_details.listing_events for pre-trigger history.
Tax reassessment forecast ID · Resets to sale price
- Current annual tax
- $914 · $76/mo
- Projected year-2 tax
- $2,173 · $181/mo
- Expected delta
- +$1,259/yr (+$105/mo · 137.7%)
ⓘ Screening estimate from a state-policy table — verify with the county assessor before closing.
Climate risk First Street
- Flood 5/10 Major FEMA zone X (unshaded) · 57% chance over 30 yrs
- Wildfire 5/10 Major
- Heat 5/10 Major 7 d/yr ≥98°F today · 19 d/yr by 30 yrs out
- Wind 1/10 Low
- Air quality 8/10 Severe 16 unhealthy d/yr today · 19 by 30 yrs out
Nearby sold comps map
Loading sold comps map…
Walkable amenities ~0.75 mi
Loading nearby amenities…
Taxation est. · year 1
- Rental income
- $28,661
- − Mortgage interest
- −$17,639
- − Property taxes
- −$914
- − Insurance
- −$1,574
- − Repairs & maintenance
- −$2,293
- − Management
- −$2,293
- − Depreciation
- −$9,161
- Taxable loss
- −$5,213
- Est. tax savings @ 24.0%
- +$1,251
- After-tax cash flow
- $1,589/yr
For passive investors: Depreciation is non-cash, so a rental often shows a tax loss while cash-flowing — sheltering income. Rental losses are passive: they offset passive income freely, and up to $25,000/yr can offset ordinary (W-2) income if you actively participate and your MAGI is under $100k (phasing out to $0 by $150k); unused losses carry forward. On sale, claimed depreciation is recaptured at up to 25%, and gains may owe capital-gains tax (a 1031 exchange can defer both). Figures are a year-1 estimate at your 24.0% rate — not tax advice; consult a CPA.
Schools (NCES district)
- District
- Middleton District
- NCES district ID
- 1602130
- Math proficiency
- 41% ▼ -8.00%
- Reading proficiency
- 58% ▬ 0.00%
- Median HH income
- $53,089
- Composite
- 42.6/100
- National rank
- #3191
- State rank
- #29 of 92 in ID
Livability — Middleton
- Score
- 77/100
- State rank
- #22
- US rank
- #3173
Category grades
Schools grade is shown separately in the Schools card above.
Census & demographics
- Census place
- Middleton, ID
- County
- Canyon County · 235,358 people
- City population
- 16,293
- Metro
- Boise City, ID
- Population (ZIP)
- 16,293
- Household income
- $97,293
- Rent vs Own
- Severe rent burden
- 141.0
Population outlook (Canyon County) Hauer SSP2
- Today (2025)
- 248,853 people
- By 2030
- 269,596 · +8.3%
- By 2040
- 311,081 · +25.0%
- By 2050
- 350,809 · +41.0%
- By 2075
- 441,884 · +77.6%
- By 2100
- 505,641 · +103.2%
Race, ethnicity, and origin ACS 2023
- Neighborhood character
- Predominantly White (80%)
- Race & ethnicity
- White 80% Hispanic / Latino 12% Two or more races 8%
- Hispanic origin (detail)
- Mexican 11%
- Common ancestry
- Slovak 5% Portuguese 2% Iranian 2%
- Foreign-born
- 2% · Canada
- Languages at home
- 88% English-only · Spanish 9% Russian/Polish/Slavic 2% German/W. Germanic 1%
Political lean MEDSL · Canyon
- 2024 margin
- Solid R (+46.6) · D 25.4% · R 72.0% · Other 2.5%
- 2008→2024 swing
- -11.4pp toward R · 2008: -35.2pp · 2024: -46.6pp
- All cycles
- 2024: R+46.6 2020: R+39.7 2016: R+41.8 2012: R+37.1 2008: R+35.2
Not yet ingested
- Civics
- —
Market trends
- HPI YoY
- ▼ -159.72%
- Current HPI
- 295.3575
- Rent YoY
- —
- Metro
- Boise City, ID
- State GDP YoY
- ▲ 4.51%
- F500 in state
- 6
Industry mix (Fortune 500 HQ in ID)
| Industry | F500 HQs | Revenue |
|---|---|---|
| Retail | 1 | $79B |
|
||
| Technology | 1 | $25B |
|
||
| Food / Agriculture | 1 | $6B |
|
||
Price history
+250.3% since first listed12 events — show timeline
- 2026-05-12 Pending — IMLS
- 2026-05-08 Listed $314,900 IMLS
- 2020-03-17 Sold (Public Records) — Public Records
- 2020-03-17 Sold (MLS) — IMLS
- 2020-02-10 Pending — IMLS
- 2020-02-08 Listed $189,900 IMLS
- 2018-01-21 Listing Removed — IMLS
- 2018-01-12 Pending — IMLS
- 2018-01-11 Listed $127,900 IMLS
- 2011-01-05 Listed $42,500 IMLS
- 2005-12-21 Sold (Public Records) — Public Records
- 2005-11-01 Listed $89,900 IMLS
Property tax history
-3.0%/yrLatest (2025): $914 · +6.2% YoY. Source: county tax records.
Cash-flow waterfall
monthlySold comps — $/sqft
last 12 mo · ≤1 miLoading sold comps…