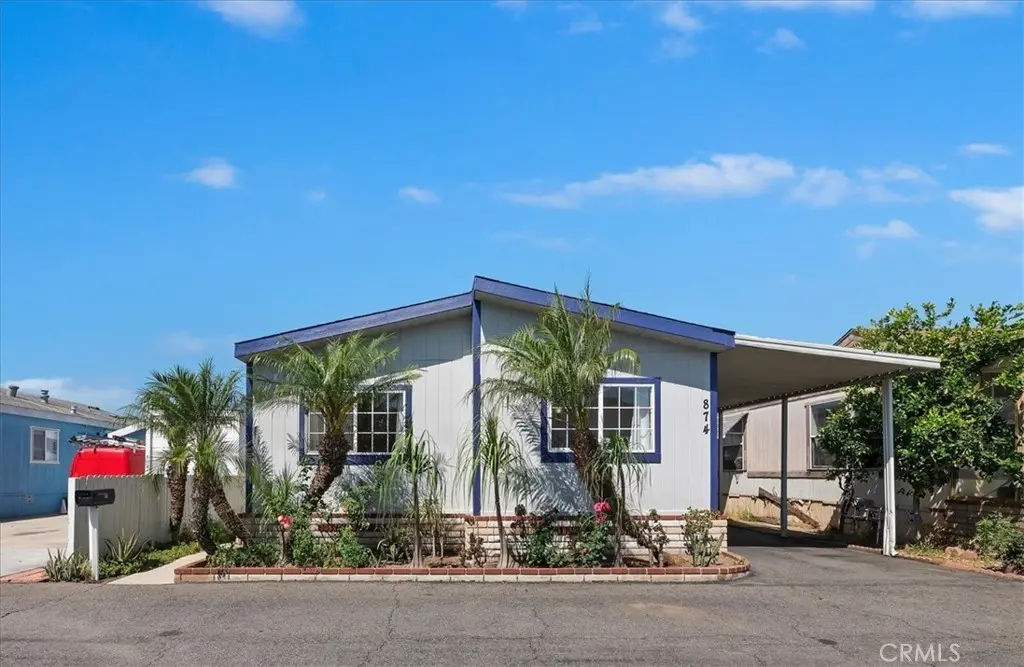
8681 Katella #874 · Stanton, CA
Flood risk 1/10 · Minimal
- FEMA flood zone
- X (shaded)
- Chance of flooding over 30 yrs
- 0.0%
- Est. flood insurance / yr
- $507 – $1,088
Fire risk 1/10 · Minimal
- Est. fire insurance / yr
- $659 – $1,223
Heat risk 5/10 · Moderate
- Hot days now (above 89°F)
- 7 days/yr
- Hot days in 30 yrs
- 23 days/yr
Wind risk 1/10 · Minimal
- Chance of severe wind over 30 yrs
- —
Air-quality risk 5/10 · Moderate
- Unhealthy air days now
- 7 days/yr
- Unhealthy air days in 30 yrs
- 8 days/yr
Risk factors via First Street. Map © Google.
Why this score? — see what drove the B grade
The composite is a weighted blend of 9 inputs, each scored 0–100. Each bar is that input's sub-score; the figure is the points it added to the 100-point composite (weight × sub-score).
- Cash flow +30.0/30.0
- ARV discount +11.4/15.0
- 1% rule +10.0/10.0
- DSCR +10.0/10.0
- Livability +3.2/5.0
- Rent growth +3.1/5.0
- Condition / age +2.5/5.0
- Schools +2.2/10.0
- Appreciation +0.0/10.0
$190,000
🖨 Deal sheet 📄 Offer letter ✓ Due diligence
Listing remarks MLS
Bank Owned Fixer In Park With All Amenities, Price Includes Cost To Move Unit To Park Or Lot Of Buyer's Choice. Submit All Offers.
Key facts
- New flooring
- New water heater
- New faucet fixtures
Tags
Property features AI
Finance
- Other: Park name: Katella Mobile Home Estates; Property listed as turnkey; Washer, dryer and refrigerator excluded
- Financial info: Land lease: $1,709 monthly (seller provided)
- HOA & community: Part of Katella Mobile Home Estates association; Community features include curbs and street lighting; Rent includes pool (land lease community)
Exterior
- Parking: Attached carport (2 spaces); Paved concrete driveway; Total 2 parking spaces
- Utilities: Public sewer; District/public water; Natural gas connected; Electricity connected; Sewer connected; Water connected; Telephone available in street; Cable available
- Home design: Single-story home; Entry at front door; Turnkey condition; Mobile home model IL6992 (12' x 90'); Raised foundation
- Construction: Mobile home construction; Raised foundation
- Exterior features: Community pool; Front yard; Back yard; Garden; Lot is level/flat; Close to clubhouse; One shed on property
Interior
- Kitchen: Open to family room; Gas cooktop; Gas range; Gas oven; Dishwasher
- Bedrooms: All bedrooms on main level; Primary suite
- Flooring: Vinyl flooring; Wood flooring
- Bathrooms: 2 full bathrooms; Soaking tub; Shower-in-tub; Bathtub; Low-flow toilet(s)
- Heating & cooling: Central heating (furnace); Central air conditioning
- Interior features: Ceiling fan(s); Open floor plan; Community spa
- Laundry & utility: Indoor laundry area
Neighborhood map
What this means for you Summary
Snapshot
- This is a 3-bed/2.0-bath manufactured listed at $190k.
Deal economics
- At list price, monthly cash flow is $1k ($13k/yr) — positive.
- The deal already cash-flows at list — no discount required.
- Meets the 1% rule at list price ($3k rent vs $190k).
- Recommended offer: $184k (3.0% below list) — sets the bar for market timing.
- Cap rate 13.1% vs local median 2.5% in Stanton — top-decile yield for the area; either an underpriced asset or a hidden risk that comps aren't pricing in. Stress-test before assuming the spread holds.
Location & tenants
- Location reads 63/100 on livability (#468 in CA) — a middle-class / working-renter tenant base. Strengths: commute A+; Watch: schools C-, amenities D, health & safety D.
- Magnolia Elementary (urban): math 25% / reading 25% proficiency, ranked #397 of 517 in CA (top 77%) — low school quality limits family demand, transient renter base, plan for 1-2y turnover; 74% free/reduced lunch — lower-income household profile, screen leases tightly.
- Market conditions: Rents rising (+2.3%/yr); 48 active listings in the ZIP; 40 comparable units currently listed for rent nearby; rentals leasing fast (median 3d on market — plan ~1-2 weeks tenant-placement turnaround); solid renter incomes; 6,974 units permitted in Orange County in 2024 (3,839 in 5+ unit buildings).
- This rent runs 43% of the median local income ($86k/yr) — at the standard rent-burdened threshold; future hikes will face affordability resistance.
Forward outlook
- Local home prices are declining (-3.0%/yr); year-one equity from $1k of loan paydown is wiped out by about $6k of value loss. Plan a longer hold.
- Orange County population projected at +14% by 2050 — modest demand growth; plan on rents tracking national, not racing it.
- At projected returns (-3.0% appreciation + 2.3% rent growth), your $53k cash investment doubles in ~6 years — after that, you're playing with house money.
Negotiation context
- It's been on market 48 days — a 3% lower offer ($184k) is reasonable based on typical stale-listing flexibility.
- 2 sale attempts since 28y ago; this cycle's ask has dropped $10k (5%) from the opening price — seller is motivated, your offer sets the floor, not the list.
- Current owner paid $48k; list at $190k implies a 292% gain — meaningful room to come down on a strong offer.
Risks & watch-outs
- Climate carrying-cost: extreme-heat days projected 7→23/yr by 2055 (HVAC capex compounding) — expect insurance premiums to compound above CPI over the hold.
Questions for the listing agent
- It's been on market 48 days. Have you received any prior offers? Is the seller open to a 3% concession, seller financing, or rate buy-down credit?
- Is there a deadline driving the sale (1031 exchange, divorce, estate, relocation)? That informs how much negotiation room exists.
- Crime grade is D in this area — have there been break-ins, vandalism, or insurance claims at this property in the last 3 years? What carrier currently insures it and at what premium?
- What's the average days-on-market for RENTAL listings here right now (not sales)? A rising rental-DOM trend means longer vacancies and softer asking-rent achievability than the comps imply.
- What's the recent tenant-quality profile in this submarket — average credit score on applications, eviction rate, late-payment / NSF rate, and stable-employment percentage? A property-management company in the area should have these aggregated.
- How much new for-sale + rental construction is in the pipeline within 1–3 miles? Heavy new supply typically softens prices + rents 12–24 months out; constrained supply supports both.
Investment metrics
- 1% rule
- 1.60% ✓
- Cap rate
- 13.14%
- Cash-on-cash
- 24.46%
- DSCR
- 2.09
- GRM
- 5.2
CMA / ARV
- ARV (on-the-fly)
- $207,870
- Comps found
- 6
Show comp detail 6 sales within ~0.75 mi
| Address | Dist | Beds/Ba | Sqft | Sold | Price | $/sf | Match |
|---|---|---|---|---|---|---|---|
| 8681 Katella Ave #897 | 0.00mi | 3/2.0 | 1,152 (+8%) | 2mo | $224,900 | $195 | 84 |
| 8681 Katella Ave #802 | 0.00mi | 3/2.0 | 1,120 (+5%) | 20mo | $235,000 | $210 | 75 |
| 10800 Dale Ave #217 | 0.18mi | 3/2.0 | 1,120 (+5%) | 19mo | $230,000 | $205 | 68 |
| 8681 Katella Ave #883 | 0.00mi | 3/2.0 | 1,200 (+13%) | 14mo | $195,000 | $163 | 67 |
| 11250 Beach Blvd #31 | 0.54mi | 2/2.0 (-1) | 1,088 (+2%) | 9mo | $125,000 | $115 | 59 |
| 11250 Beach Blvd #144 | 0.58mi | 3/2.0 | 1,144 (+7%) | 16mo | $200,000 | $175 | 48 |
Match score weights: distance 35% · size 25% · config 20% · recency 20%. Top-matched comps best support the ARV.
Projected returns pro-forma
-3.0% appreciation · 2.33% rent growth · sell at horizon
- IRR
- 17.0%
- Equity multiple
- 1.68×
- Total profit
- $36,294
- Equity at exit
- $28,330
- IRR
- 25.1%
- Equity multiple
- 3.11×
- Total profit
- $112,499
- Equity at exit
- $16,428
Cash invested: $53,200 (down + closing). Projections, not guarantees.
Landlord ↔ Tenant lean methodology
- Overall (STATE)
- 18 Strongly Tenant-Friendly
- State California
- 18 Strongly Tenant-Friendly · D+13
- County
- — inherits STATE
- City
- — inherits STATE
ZIP-level market 90680
- Rents YoY
- 2.3%
- Active inventory
- 48
- Price-to-rent
- 5.2×
Monthly cashflow live
- Estimated rent
- $3,035 high interval (Pro) →
- Mortgage (P&I)
- −$996
- Tax est. 1.5%
- −$238 /mo · $2,850/yr
- Insurance
- −$79
- HOA
- −$0
- Vacancy / Maint / Mgmt
- −$637
- Net cashflow
- $1,084
Break-even live
UW: 25.0% down · 7.5% · 30yr · 1.5% tax · 5.0% vac · 8.0% maint · 8.0% mgmt
Financing live
Cash to close
- Down payment
- $47,500
- Closing costs
- $5,700
- Reserves months
- —
- Total cash needed
- —
Loan-product check · same deal, 3 products live
Conventional
25% down · 7.5% · 30yr
- Down + closing
- —
- Monthly P&I
- —
- Monthly cashflow
- —
- DSCR
- —
- Eligible?
- —
Personal DTI + credit; lowest rate.
DSCR
20% down · 8.5% · 30yr
- Down + closing
- —
- Monthly P&I
- —
- Monthly cashflow
- —
- DSCR
- —
- Eligible?
- —
No personal income docs; deal must DSCR.
Hard money
10% down · 12.0% · 12mo
- Down + closing
- —
- Monthly P&I
- —
- Monthly cashflow
- —
- DSCR
- —
- Eligible?
- —
Short-term bridge; refi at stabilization.
Rent comps 40 comps
| Address | Beds | Baths | Sqft | Rent | $/sqft | DOM | Units | Dist |
|---|---|---|---|---|---|---|---|---|
| 11250 Dale St Garden Grove, CA | 1.0–2.0 | 1.0–2.0 | 848 | $2,710 | $3.20 | 2d | 9 | 0.30mi |
| 10743 Magnolia Ave #101 Anaheim, CA | 2.0 | 2.0 | 913 | $2,500 | $2.74 | 1d | 1 | 0.37mi |
| 9014 Stacie Ln #28 Anaheim, CA | 3.0 | 2.0 | 1347 | $3,095 | $2.30 | 1d | 1 | 0.41mi |
| 8853 Stardust Ln Anaheim, CA | 3.0 | 1.5 | 1126 | $3,875 | $3.44 | 3d | 1 | 0.48mi |
| 8882 W Cerritos Ave Anaheim, CA | 2.0 | 1.0 | 980 | $2,495 | $2.55 | 1d | 1 | 0.55mi |
| 11565 Wasco Rd Garden Grove, CA | 2.0 | 1.5 | 700 | $2,795 | $3.99 | 43d | 1 | 0.58mi |
| 8171 Orangewood Ave Stanton, CA | 2.0 | 2.0 | 800 | $2,800 | $3.50 | 17d | 1 | 0.66mi |
| 9081 W Cerritos Ave Unit 9125-1 Anaheim, CA | 2.0 | 1.0 | 850 | $2,425 | $2.85 | 1d | 1 | 0.71mi |
| 9081 W Cerritos Ave Unit 9155-10 Anaheim, CA | 2.0 | 1.0 | 850 | $2,325 | $2.74 | 1d | 1 | 0.71mi |
| 9081 Cerritos Ave Anaheim, CA | 1.0–2.0 | 1.0 | 687 | $2,425 | $3.53 | 1d | 7 | 0.71mi |
| 9081 W Cerritos Ave Unit 9161-6 Anaheim, CA | 2.0 | 1.0 | 850 | $2,150 | $2.53 | 6d | 1 | 0.71mi |
| 9313 Marchand Ave Garden Grove, CA | 3.0 | 3.0 | 1200 | $4,500 | $3.75 | 5d | 1 | 0.83mi |
| 1235 Sharon Cir Unit 1231 F2 Anaheim, CA | 2.0 | 2.0 | 910 | $2,495 | $2.74 | 15d | 1 | 0.88mi |
| 9561 Maureen Dr Unit 9551 Garden Grove, CA | 2.0 | 1.0 | 800 | $2,395 | $2.99 | 43d | 1 | 0.90mi |
| 11893 Macduff St Garden Grove, CA | 3.0 | 2.0 | 1200 | $3,100 | $2.58 | 24d | 1 | 0.92mi |
| 2648 W Ball Rd Anaheim, CA | 1.0–2.0 | 1.0–2.0 | 843 | $2,600 | $3.08 | 1d | 1 | 0.93mi |
| 7622 Katella Ave Stanton, CA | 2.0 | 1.0–2.0 | 691 | $2,183 | $3.16 | 3d | 20 | 0.94mi |
| 2704 W Ball Rd Anaheim, CA | 2.0 | 1.0 | 850 | $2,710 | $3.19 | 1d | 1 | 0.94mi |
| 2704 W Ball Rd Unit G-14 Anaheim, CA | 2.0 | 1.0 | 850 | $2,700 | $3.18 | 17d | 1 | 0.96mi |
| 7765 Beechwood Way Stanton, CA | 3.0 | 1.5 | 1232 | $3,750 | $3.04 | 1d | 1 | 0.97mi |
| 2828 W Ball Rd Anaheim, CA | 2.0 | 1.0–2.0 | 880 | $2,760 | $3.14 | 1d | 3 | 0.98mi |
| 7684 Ruthann Ave Stanton, CA | 3.0 | 2.0 | 1000 | $3,650 | $3.65 | 3d | 1 | 0.98mi |
| 2828 W Ball Rd Unit N-36 Anaheim, CA | 2.0 | 2.0 | 880 | $2,795 | $3.18 | 17d | 1 | 0.99mi |
| 2828 W Ball Rd Unit G-11 Anaheim, CA | 2.0 | 2.0 | 880 | $2,850 | $3.24 | 17d | 1 | 0.99mi |
| 2828 W Ball Rd Unit D-10 Anaheim, CA | 2.0 | 2.0 | 880 | $2,805 | $3.19 | 17d | 1 | 0.99mi |
| 9661 Maureen Dr Unit F Garden Grove, CA | 2.0 | 1.0 | 900 | $2,495 | $2.77 | 43d | 1 | 1.00mi |
| 2771 W Ball Rd Anaheim, CA | 2.0 | 1.5 | 900 | $2,350 | $2.61 | 1d | 1 | 1.00mi |
| 2880 W Ball Rd Anaheim, CA | 1.0–2.0 | 1.0 | 894 | $2,850 | $3.19 | 1d | 5 | 1.03mi |
| 8052 Fillmore Dr Apt 3 Stanton, CA | 2.0 | 1.5 | 1000 | $2,250 | $2.25 | 2d | 1 | 1.08mi |
| 7545 Katella Ave Stanton, CA | 1.0–2.0 | 1.0 | 900 | $3,053 | $3.39 | 1d | 7 | 1.11mi |
| 12101 Dale Ave #80 Stanton, CA | 3.0 | 2.0 | 1493 | $1,500 | $1.00 | 7d | 1 | 1.14mi |
| 8300 Chapman Ave Stanton, CA | 1.0–2.0 | 1.0 | 860 | $2,545 | $2.96 | 1d | 9 | 1.14mi |
| 10600 Western Ave Stanton, CA | 2.0 | 1.0–2.0 | 915 | $2,475 | $2.70 | 1d | 2 | 1.15mi |
| 10321 Courtright Rd Stanton, CA | 3.0 | 2.0 | 1202 | $3,700 | $3.08 | 22d | 1 | 1.21mi |
| 2449 W Ball Rd Anaheim, CA | 1.0–2.0 | 1.0–2.0 | 1000 | $2,855 | $2.85 | 12d | 4 | 1.24mi |
| 10361 Iona Way Stanton, CA | 3.0 | 1.5 | 1149 | $3,500 | $3.05 | 1d | 1 | 1.25mi |
| 10070 Gilbert St Anaheim, CA | 3.0 | 2.0 | 1250 | $3,095 | $2.48 | 1d | 1 | 1.29mi |
| 10572 Chamberlain Ave Anaheim, CA | 3.0 | 2.0 | 1000 | $3,500 | $3.50 | 10d | 1 | 1.30mi |
| 2551 W Rome Ave Anaheim, CA | 3.0 | 1.5 | 1130 | $3,850 | $3.41 | 6d | 1 | 1.32mi |
| 12312 Louise St Garden Grove, CA | 3.0 | 2.0 | 1300 | $3,500 | $2.69 | 24d | 1 | 1.33mi |
Listing history 17 events
-
2026-06-18days on market $190,000 Active 48 DOM
-
2026-06-17days on market $190,000 Active 47 DOM
-
2026-06-16days on market $190,000 Active 46 DOM
-
2026-06-15days on market $190,000 Active 45 DOM
-
2026-06-13days on market $190,000 Active 43 DOM
-
2026-06-13days on market $190,000 Active 42 DOM
-
2026-06-09days on market $190,000 Active 39 DOM
-
2026-06-08days on market $190,000 Active 38 DOM
-
2026-06-07days on market $190,000 Active 37 DOM
-
2026-06-04days on market $190,000 Active 34 DOM
-
2026-06-03days on market $190,000 Active 33 DOM
-
2026-06-02days on market $190,000 Active 32 DOM
-
2026-06-01days on market $190,000 Active 31 DOM
-
2026-05-31days on market $190,000 Active 30 DOM
-
2026-05-01$200,000 Active
-
1998-12-31soldstatus $48,500 130-char remark
Show marketing remark (130 chars)
Bank Owned Fixer In Park With All Amenities, Price Includes Cost To Move Unit To Park Or Lot Of Buyer's Choice. Submit All Offers.
-
1998-02-18$48,500 130-char remark
Show marketing remark (130 chars)
Bank Owned Fixer In Park With All Amenities, Price Includes Cost To Move Unit To Park Or Lot Of Buyer's Choice. Submit All Offers.
ⓘ Source: listings_history table (triggers on properties + properties_extension) + one-shot
backfill from property_details.listing_events for pre-trigger history.
Climate risk First Street
- Flood 1/10 Low FEMA zone X (shaded) · 0% chance over 30 yrs
- Wildfire 1/10 Low
- Heat 5/10 Major 7 d/yr ≥89°F today · 23 d/yr by 30 yrs out
- Wind 1/10 Low
- Air quality 5/10 Major 7 unhealthy d/yr today · 8 by 30 yrs out
Nearby sold comps map
Loading sold comps map…
Walkable amenities ~0.75 mi
Loading nearby amenities…
Taxation est. · year 1
- Rental income
- $36,417
- − Mortgage interest
- −$10,643
- − Property taxes
- −$2,850
- − Insurance
- −$950
- − Repairs & maintenance
- −$2,913
- − Management
- −$2,913
- − Depreciation
- −$5,527
- Taxable income
- $10,620
- Est. tax owed @ 24.0%
- −$2,549
- After-tax cash flow
- $10,464/yr
For passive investors: Depreciation is non-cash, so a rental often shows a tax loss while cash-flowing — sheltering income. Rental losses are passive: they offset passive income freely, and up to $25,000/yr can offset ordinary (W-2) income if you actively participate and your MAGI is under $100k (phasing out to $0 by $150k); unused losses carry forward. On sale, claimed depreciation is recaptured at up to 25%, and gains may owe capital-gains tax (a 1031 exchange can defer both). Figures are a year-1 estimate at your 24.0% rate — not tax advice; consult a CPA.
Schools (NCES district)
- District
- Magnolia Elementary
- NCES district ID
- 0623430
- Math proficiency
- 25% ▼ -21.00%
- Reading proficiency
- 25% ▼ -29.00%
- Median HH income
- $50,320
- Composite
- 22.09/100
- National rank
- #8181
- State rank
- #397 of 517 in CA
Livability — Stanton
- Score
- 63/100
- State rank
- #468
- US rank
- #15945
Category grades
Schools grade is shown separately in the Schools card above.
Census & demographics
- Census place
- Stanton, CA
- County
- Orange County · 3,096,323 people
- City population
- 31,991
- Metro
- Los Angeles-Long Beach-Anaheim, CA
- Population (ZIP)
- 31,991
- Household income
- $85,592
- Rent vs Own
- Severe rent burden
- 1745.0
Population outlook (Orange County) Hauer SSP2
- Today (2025)
- 3,477,456 people
- By 2030
- 3,613,117 · +3.9%
- By 2040
- 3,835,945 · +10.3%
- By 2050
- 3,968,736 · +14.1%
- By 2075
- 4,097,053 · +17.8%
- By 2100
- 3,903,633 · +12.3%
Race, ethnicity, and origin ACS 2023
- Neighborhood character
- Diverse neighborhood (Simpson 0.64)
- Race & ethnicity
- Hispanic / Latino 50% Asian 27% White 17% Two or more races 12% Black 2% Native American 1%
- Hispanic origin (detail)
- Mexican 42%
- Common ancestry
- Italian 1% Iranian 0%
- Foreign-born
- 42% · Canada, Vietnam, South Korea
- Languages at home
- 35% English-only · Spanish 39% Vietnamese 17% Tagalog/Filipino 2%
Political lean MEDSL · Orange
- 2024 margin
- Toss-up / Even · D 49.7% · R 47.1% · Other 3.2%
- 2008→2024 swing
- +5.2pp toward D · 2008: -2.6pp · 2024: 2.6pp
- All cycles
- 2024: D+2.6 2020: D+9.0 2016: D+7.7 2012: R+8.3 2008: R+2.6
Not yet ingested
- Civics
- —
Market trends
- HPI YoY
- ▼ -529.54%
- Current HPI
- 447.9557
- Rent YoY
- ▲ 2.33%
- Metro
- Los Angeles-Long Beach-Anaheim, CA
- State GDP YoY
- ▲ 3.21%
- F500 in state
- 116
Industry mix (Fortune 500 HQ in CA)
| Industry | F500 HQs | Revenue |
|---|---|---|
| Technology | 27 | $1,492B |
|
||
| Financial Services | 3 | $174B |
|
||
| Retail | 3 | $44B |
|
||
| Insurance | 3 | $26B |
|
||
| Media / Entertainment | 2 | $115B |
|
||
| Pharmaceuticals / Biotech | 2 | $62B |
|
||
Price history
+312.4% since first listed3 events — show timeline
- 2026-05-01 Listed $200,000 CRMLS
- 1998-12-31 Sold (MLS) $48,500 CRMLS
- 1998-02-18 Listed $48,500 CRMLS
Property tax history
-3.6%/yrLatest (2025): $230 · +2.3% YoY. Source: county tax records.
Cash-flow waterfall
monthlySold comps — $/sqft
last 12 mo · ≤1 miLoading sold comps…