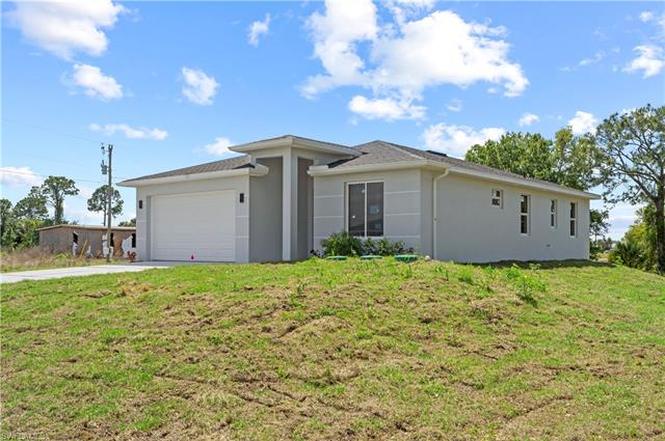
842 Naples Ave S · Lehigh Acres, FL
Flood risk 1/10 · Minimal
- FEMA flood zone
- X (unshaded)
- Chance of flooding over 30 yrs
- 0.0%
- Est. flood insurance / yr
- $507 – $1,088
Fire risk 3/10 · Minor
- Est. fire insurance / yr
- $947 – $1,759
Heat risk 10/10 · Severe
- Hot days now (above 109°F)
- 7 days/yr
- Hot days in 30 yrs
- 28 days/yr
Wind risk 10/10 · Severe
- Chance of severe wind over 30 yrs
- 99.0%
Air-quality risk 2/10 · Minimal
- Unhealthy air days now
- 1 days/yr
- Unhealthy air days in 30 yrs
- 2 days/yr
Risk factors via First Street. Map © Google.
Why this score? — see what drove the D- grade
The composite is a weighted blend of 9 inputs, each scored 0–100. Each bar is that input's sub-score; the figure is the points it added to the 100-point composite (weight × sub-score).
- Appreciation +10.0/10.0
- ARV discount +7.5/15.0
- Cash flow +6.0/30.0
- Schools +4.1/10.0
- Livability +3.0/5.0
- Condition / age +2.5/5.0
- 1% rule +1.3/10.0
- Rent growth +1.3/5.0
- DSCR +0.3/10.0
$320,000
🖨 Deal sheet (PDF) 📄 Offer letter ✓ Due diligence
Listing remarks MLS
Permits approved to start building your house now !!! (RES2024-05760) Single Family 3 bedroom, 2 full bathroom and laundry attached TOTAL AREA: 1,926 S. F. (LIVING AREA: 1,325 S. F. + GARAGE: 410 S. F. + FRONT PORCH: 41 S. F. + LANAI: 150 S. F. ) Beautiful lot on paved road with electricity pole. The lot is completely cleared of trees. It is located in a newly built area very close to supermarkets, schools, medical care, pharmacies, tax property collector and with easy access to SWFL International Airport, Fort Myers, the beaches, and shopping.
Key facts
- Quartz countertops
- Tamko roof shingles
- Gourmet kitchen
Tags
Property features AI
Finance
- Other: Zoning: RS-1; Lot size approx. 0.3240 acres; Lot dimensions (feet): Front 127, Right 104, Left 116, Back 89; Total area 14,113; Subdivision: Lehigh Acres (Section 24, Subdivision #09); Directions: GPS
- HOA & community: Non-gated community; No HOA amenities; No HOA maintenance
Exterior
- Parking: 2 assigned parking spaces; Driveway (paved); Attached 2-car garage
- Utilities: Well water; Septic sewer; Cable available
- Home design: Residential single-family home; 1 story (ranch); New construction (built 2025); Located in Lehigh Acres
- Construction: Concrete block construction; Shingle roof; Built in 2025; Floor plan: other
- Exterior features: Shingle roof; Windows — see remarks; Paved road access; Regular lot; West rear exposure; Canal: none; View — see remarks
Interior
- Kitchen: Dishwasher; Microwave; Refrigerator
- Bedrooms: 3 bedrooms
- Flooring: Tile
- Bathrooms: 2 full bathrooms; Master bathroom with combo tub and shower
- Heating & cooling: Central electric heat; Central electric air conditioning
- Interior features: High-speed internet available; Smoke detectors; Formal dining area; See remarks
- Laundry & utility: Auto garage door
Neighborhood map
What this means for you Summary
Snapshot
- This is a 3-bed/2.0-bath land listed at $320k.
Deal economics
- At list price, monthly cash flow is $-617 ($-7k/yr) — negative.
- To cash-flow at today's rent, offer at most $231k (27.9% below list).
- To meet the 1% rule (rent ≥ 1% of price), the offer needs to be $202k (36.9% below list).
- Recommended offer: $202k (36.9% below list) — sets the bar for 1% rule.
Location & tenants
- Location reads 59/100 on livability (#826 in FL) — a working-class tenant base; expect higher turnover. Strengths: cost of living A+, housing A+; Watch: crime C-, employment D+, amenities F.
- Lee (suburban): math 47% / reading 50% proficiency, ranked #42 of 73 in FL (top 58%) — families likely to look elsewhere, expect single-tenant / working-renter base with shorter leases.
- Zoned schools: Veterans Park Academy For The Arts (math 41% / reading 45%, grade F, #1,366 of 2,144 statewide, top 64%, 2,133 students, 36% FRL); Oak Hammock Middle School (math 43% / reading 41%, grade D-, #340 of 571 statewide, top 61%, 1,563 students, 56% FRL); Lehigh Senior High School (math 23% / reading 45%, grade F, #394 of 667 statewide, top 60%, 2,476 students, 57% FRL).
- Market conditions: Rents falling (-4.7%/yr); 2476 active listings in the ZIP; 26 comparable units currently listed for rent nearby; rentals at typical pace (median 18d on market — plan ~3-4 weeks tenant-placement turnaround); 15,411 units permitted in Lee County in 2024 (4,686 in 5+ unit buildings).
- This rent runs 34% of the median local income ($72k/yr) — at the standard rent-burdened threshold; future hikes will face affordability resistance.
Forward outlook
- In year one you build about $34k of equity ($2k loan paydown + $32k appreciation (10.0% local appreciation)).
- Lee County population projected at +44% by 2050 — long-run rental-demand tailwind backs the buy-and-hold thesis.
- By year 2, paydown + projected appreciation supports a ~$55k cash-out refi (75% LTV) — recoverable capital for the next deal without selling this one.
Negotiation context
- It's been on market 243 days — a 12% lower offer ($282k) is reasonable based on typical stale-listing flexibility.
- 2 sale attempts; this cycle's ask has dropped $35k (10%) from the opening price — seller is motivated, your offer sets the floor, not the list.
- Current owner paid $26k; list at $320k implies a 1131% gain — meaningful room to come down on a strong offer.
Risks & watch-outs
- Climate carrying-cost: severe wind risk, 99% chance of damaging wind over 30y; extreme-heat days projected 7→28/yr by 2055 (HVAC capex compounding) — expect insurance premiums to compound above CPI over the hold.
Questions for the listing agent
- What do current leases actually rent for vs. the listed asking? Can we see a recent rent roll and the last 12 months of T-12 income?
- It's been on market 243 days. Have you received any prior offers? Is the seller open to a 37% concession, seller financing, or rate buy-down credit?
- Why hasn't it sold? Are there any deal-killer items the seller is aware of (foundation, flood, title, zoning, code violations)?
- Is there a deadline driving the sale (1031 exchange, divorce, estate, relocation)? That informs how much negotiation room exists.
- Schools are D-rated, which usually means shorter tenancies and higher turnover. Who's the typical renter profile here, and what's been the actual vacancy rate?
- The area grade is low — what's the realistic commute time and amenity access for the typical tenant pool here? Any planned neighborhood developments (good or bad) we should know about?
- What's the average days-on-market for RENTAL listings here right now (not sales)? A rising rental-DOM trend means longer vacancies and softer asking-rent achievability than the comps imply.
- What's the recent tenant-quality profile in this submarket — average credit score on applications, eviction rate, late-payment / NSF rate, and stable-employment percentage? A property-management company in the area should have these aggregated.
- How much new for-sale + rental construction is in the pipeline within 1–3 miles? Heavy new supply typically softens prices + rents 12–24 months out; constrained supply supports both.
Investment metrics
- 1% rule
- 0.63% ✗
- Cap rate
- 3.98%
- Cash-on-cash
- -8.26%
- DSCR
- 0.63
- GRM
- 13.2
CMA / ARV
No comps found within radius.
Projected returns pro-forma
10.0% appreciation · 0.0% rent growth · sell at horizon
- IRR
- 17.7%
- Equity multiple
- 2.44×
- Total profit
- $129,106
- Equity at exit
- $288,281
- IRR
- 16.2%
- Equity multiple
- 5.47×
- Total profit
- $400,562
- Equity at exit
- $621,690
Cash invested: $89,600 (down + closing). Projections, not guarantees.
Landlord ↔ Tenant lean methodology
- Overall (STATE)
- 87 Strongly Landlord-Friendly
- State Florida
- 87 Strongly Landlord-Friendly · R+3
- County
- — inherits STATE
- City
- — inherits STATE
ZIP-level market 33974
- Home prices YoY
- 5.8%
- Rents YoY
- -4.7%
- Active inventory
- 2476
- Price-to-rent
- 13.2×
Monthly cashflow live
- Estimated rent
- $2,018 high interval (Pro) →
- Mortgage (P&I)
- −$1,678
- Tax est. 1.5%
- −$400 /mo · $4,800/yr
- Insurance
- −$133
- HOA
- −$0
- Vacancy / Maint / Mgmt
- −$424
- Net cashflow
- $-617
Break-even live
Sensitivity live
| Price | -10% $-396 | -5% $-506 | +0% $-617 | +5% $-727 | +10% $-838 |
|---|---|---|---|---|---|
| Rent | -10% $-776 | -5% $-697 | +0% $-617 | +5% $-537 | +10% $-457 |
| Rate | -1.0pp $-456 | -0.5pp $-535 | base $-617 | +0.5pp $-700 | +1.0pp $-784 |
UW: 25.0% down · 7.5% · 30yr · 1.5% tax · 5.0% vac · 8.0% maint · 8.0% mgmt
Financing live
Cash to close
- Down payment
- $80,000
- Closing costs
- $9,600
- Reserves months
- —
- Total cash needed
- —
Loan-product check · same deal, 3 products live
Conventional
25% down · 7.5% · 30yr
- Down + closing
- —
- Monthly P&I
- —
- Monthly cashflow
- —
- DSCR
- —
- Eligible?
- —
Personal DTI + credit; lowest rate.
DSCR
20% down · 8.5% · 30yr
- Down + closing
- —
- Monthly P&I
- —
- Monthly cashflow
- —
- DSCR
- —
- Eligible?
- —
No personal income docs; deal must DSCR.
Hard money
10% down · 12.0% · 12mo
- Down + closing
- —
- Monthly P&I
- —
- Monthly cashflow
- —
- DSCR
- —
- Eligible?
- —
Short-term bridge; refi at stabilization.
Rent comps 26 comps
| Address | Beds | Baths | Sqft | Rent | $/sqft | DOM | Units | Dist |
|---|---|---|---|---|---|---|---|---|
| 934 Marilyn Ave S Lehigh Acres, FL | 4.0 | 2.0 | 1577 | $2,000 | $1.27 | 13d | 1 | 0.45mi |
| 934 Marilyn Ave S Lehigh Acres, FL | 4.0 | 2.0 | 1577 | $2,000 | $1.27 | 3d | 1 | 0.45mi |
| 765 Aprile Ave S Lehigh Acres, FL | 4.0 | 2.0 | 1712 | $2,100 | $1.23 | 3d | 1 | 0.46mi |
| 763 Puccini Ave S Lehigh Acres, FL | 3.0 | 2.0 | 1055 | $1,699 | $1.61 | 4d | 1 | 0.77mi |
| 847 Genoa Ave Lehigh Acres, FL | 3.0 | 2.0 | 1600 | $2,000 | $1.25 | 5d | 1 | 0.78mi |
| 828 Genoa Ave S Lehigh Acres, FL | 4.0 | 2.5 | 1632 | $2,400 | $1.47 | 25d | 1 | 0.83mi |
| 1107 Enrique St E Lehigh Acres, FL | 3.0 | 2.0 | 1363 | $1,800 | $1.32 | 25d | 1 | 1.02mi |
| 1147 Antonio St E Lehigh Acres, FL | 3.0 | 2.0 | 1713 | $2,300 | $1.34 | 3d | 1 | 1.02mi |
| 1051 Marine Ave S Lehigh Acres, FL | 3.0 | 2.0 | 1057 | $1,800 | $1.70 | 25d | 1 | 1.13mi |
| 708 Genoa Ave S Lehigh Acres, FL | 3.0 | 2.0 | 1055 | $1,650 | $1.56 | 5d | 1 | 1.18mi |
| 637 Montclair Ave S Lehigh Acres, FL | 3.0 | 2.0 | 1497 | $1,660 | $1.11 | 25d | 1 | 1.21mi |
| 1150 Darling St E Lehigh Acres, FL | 3.0 | 2.0 | 1292 | $1,800 | $1.39 | 25d | 1 | 1.26mi |
| 1142 Dutchess St E Lehigh Acres, FL | 4.0 | 2.5 | 1632 | $2,400 | $1.47 | 25d | 1 | 1.33mi |
| 761 Kirkman Ave S Lehigh Acres, FL | 3.0 | 2.0 | 1188 | $1,900 | $1.60 | 25d | 1 | 1.35mi |
| 827 Eisenhower Blvd Lehigh Acres, FL | 3.0 | 2.5 | 1640 | $1,780 | $1.09 | 13d | 1 | 1.37mi |
| 819 Eisenhower Blvd Unit 819 Lehigh Acres, FL | 3.0 | 2.0 | 1390 | $1,650 | $1.19 | 25d | 1 | 1.38mi |
| 1248 Hillcrest St E Lehigh Acres, FL | 3.0 | 2.0 | 1055 | $1,650 | $1.56 | 4d | 1 | 1.39mi |
| 1129 Deauville St E Lehigh Acres, FL | 3.0 | 2.0 | 1698 | $2,100 | $1.24 | 25d | 1 | 1.42mi |
| 936 Eisenhower Blvd Lehigh Acres, FL | 3.0 | 2.0 | 1300 | $1,395 | $1.07 | 5d | 1 | 1.42mi |
| 1125 Deauville St E Lehigh Acres, FL | 3.0 | 2.0 | 1292 | $1,900 | $1.47 | 4d | 1 | 1.43mi |
| 915 Graystone Ave Lehigh Acres, FL | 3.0 | 2.0 | 1115 | $1,525 | $1.37 | 16d | 1 | 1.44mi |
| 1260 Milwaukee Blvd Unit 1262 Lehigh Acres, FL | 3.0 | 2.0 | 1084 | $1,750 | $1.61 | 25d | 1 | 1.44mi |
| 1256 Milwaukee Blvd Lehigh Acres, FL | 3.0 | 2.0 | 1084 | $1,800 | $1.66 | 25d | 1 | 1.44mi |
| 756 Holmes Ave Lehigh Acres, FL | 3.0 | 2.0 | 1100 | $1,450 | $1.32 | 12d | 1 | 1.45mi |
| 1028 Eubanks St Lehigh Acres, FL | 3.0 | 3.0 | 1200 | $1,950 | $1.62 | 17d | 1 | 1.45mi |
| 1121 Deauville St E Lehigh Acres, FL | 3.0 | 2.0 | 1698 | $2,100 | $1.24 | 25d | 1 | 1.45mi |
Listing history 18 events
-
2026-06-22days on market $320,000 Active 243 DOM
-
2026-06-17days on market $320,000 Active 239 DOM
-
2026-06-16days on market $320,000 Active 238 DOM
-
2026-06-16days on market $320,000 Active 237 DOM
-
2026-06-13days on market $320,000 Active 235 DOM
-
2026-06-09days on market $320,000 Active 231 DOM
-
2026-06-07days on market $320,000 Active 229 DOM
-
2026-06-02days on market $320,000 Active 224 DOM
-
2026-06-01days on market $320,000 Active 223 DOM
-
2026-06-01days on market $320,000 Active 222 DOM
-
2026-05-13price $320,000
-
2026-04-02price $350,000
-
2025-10-21$355,000 Active
-
2025-06-03soldstatus $26,000
-
2025-05-27soldstatus $26,000 Closed 556-char remark
Show marketing remark (556 chars)
Permits approved to start building your house now !!! (RES2024-05760) Single Family 3 bedroom, 2 full bathroom and laundry attached TOTAL AREA: 1,926 S. F. (LIVING AREA: 1,325 S. F. + GARAGE: 410 S. F. + FRONT PORCH: 41 S. F. + LANAI: 150 S. F. ) Beautiful lot on paved road with electricity pole. The lot is completely cleared of trees. It is located in a newly built area very close to supermarkets, schools, medical care, pharmacies, tax property collector and with easy access to SWFL International Airport, Fort Myers, the beaches, and shopping.
-
2025-03-13price $28,000 556-char remark
Show marketing remark (556 chars)
Permits approved to start building your house now !!! (RES2024-05760) Single Family 3 bedroom, 2 full bathroom and laundry attached TOTAL AREA: 1,926 S. F. (LIVING AREA: 1,325 S. F. + GARAGE: 410 S. F. + FRONT PORCH: 41 S. F. + LANAI: 150 S. F. ) Beautiful lot on paved road with electricity pole. The lot is completely cleared of trees. It is located in a newly built area very close to supermarkets, schools, medical care, pharmacies, tax property collector and with easy access to SWFL International Airport, Fort Myers, the beaches, and shopping.
-
2025-03-10$25,000 Active 556-char remark
Show marketing remark (556 chars)
Permits approved to start building your house now !!! (RES2024-05760) Single Family 3 bedroom, 2 full bathroom and laundry attached TOTAL AREA: 1,926 S. F. (LIVING AREA: 1,325 S. F. + GARAGE: 410 S. F. + FRONT PORCH: 41 S. F. + LANAI: 150 S. F. ) Beautiful lot on paved road with electricity pole. The lot is completely cleared of trees. It is located in a newly built area very close to supermarkets, schools, medical care, pharmacies, tax property collector and with easy access to SWFL International Airport, Fort Myers, the beaches, and shopping.
-
2024-03-04soldstatus $14,000
ⓘ Source: listings_history table (triggers on properties + properties_extension) + one-shot
backfill from property_details.listing_events for pre-trigger history.
Climate risk First Street
- Flood 1/10 Low FEMA zone X (unshaded) · 0% chance over 30 yrs
- Wildfire 3/10 Moderate
- Heat 10/10 Extreme 7 d/yr ≥109°F today · 28 d/yr by 30 yrs out
- Wind 10/10 Extreme 99% chance of damaging wind over 30 yrs
- Air quality 2/10 Low 1 unhealthy d/yr today · 2 by 30 yrs out
Nearby sold comps map
Loading sold comps map…
Walkable amenities ~0.75 mi
Loading nearby amenities…
Taxation est. · year 1
- Rental income
- $24,221
- − Mortgage interest
- −$17,925
- − Property taxes
- −$4,800
- − Insurance
- −$1,600
- − Repairs & maintenance
- −$1,938
- − Management
- −$1,938
- − Depreciation
- −$9,309
- Taxable loss
- −$13,288
- Est. tax savings @ 24.0%
- +$3,189
- After-tax cash flow
- $-4,213/yr
For passive investors: Depreciation is non-cash, so a rental often shows a tax loss while cash-flowing — sheltering income. Rental losses are passive: they offset passive income freely, and up to $25,000/yr can offset ordinary (W-2) income if you actively participate and your MAGI is under $100k (phasing out to $0 by $150k); unused losses carry forward. On sale, claimed depreciation is recaptured at up to 25%, and gains may owe capital-gains tax (a 1031 exchange can defer both). Figures are a year-1 estimate at your 24.0% rate — not tax advice; consult a CPA.
Schools (NCES district)
- District
- Lee
- NCES district ID
- 1201080
- Math proficiency
- 47% ▼ -11.00%
- Reading proficiency
- 50% ▼ -4.00%
- Median HH income
- $49,518
- Composite
- 41.49/100
- National rank
- #3458
- State rank
- #42 of 73 in FL
Livability — Lehigh Acres
- Score
- 59/100
- State rank
- #826
- US rank
- #20055
Category grades
Schools grade is shown separately in the Schools card above.
Census & demographics
- Census place
- Lehigh Acres, FL
- County
- Lee County · 788,662 people
- City population
- 130,638
- Metro
- Cape Coral-Fort Myers, FL
- Population (ZIP)
- 19,927
- Household income
- $72,192
- Rent vs Own
- Severe rent burden
- 434.0
Population outlook (Lee County) Hauer SSP2
- Today (2025)
- 871,946 people
- By 2030
- 955,468 · +9.6%
- By 2040
- 1,113,587 · +27.7%
- By 2050
- 1,256,891 · +44.1%
- By 2075
- 1,560,270 · +78.9%
- By 2100
- 1,726,848 · +98.0%
Race, ethnicity, and origin ACS 2023
- Neighborhood character
- Diverse neighborhood (Simpson 0.64)
- Race & ethnicity
- Hispanic / Latino 52% Two or more races 31% White 26% Black 18%
- Hispanic origin (detail)
- Mexican 12% Puerto Rican 7% Cuban 20% Dominican 4%
- Common ancestry
- Hispanic 7% Italian 1% Portuguese 1%
- Foreign-born
- 32% · Canada, Jamaica
- Languages at home
- 48% English-only · Spanish 43% French/Haitian/Cajun 7% Other Indo-European 1%
Political lean MEDSL · Lee
- 2024 margin
- Strong R (+28.4) · D 35.5% · R 63.9%
- 2008→2024 swing
- -18.0pp toward R · 2008: -10.4pp · 2024: -28.4pp
- All cycles
- 2024: R+28.4 2020: R+19.2 2016: R+20.4 2012: R+16.6 2008: R+10.4
Not yet ingested
- Civics
- —
Market trends
- HPI YoY
- ▲ 16.53%
- Current HPI
- 303.3399
- Rent YoY
- ▼ -4.68%
- Metro
- Cape Coral-Fort Myers, FL
- State GDP YoY
- ▲ 3.28%
- F500 in state
- 36
Industry mix (Fortune 500 HQ in FL)
| Industry | F500 HQs | Revenue |
|---|---|---|
| Industrial Technology | 2 | $29B |
|
||
| Insurance | 2 | $17B |
|
||
| Retail | 1 | $60B |
|
||
| Technology Distribution | 1 | $58B |
|
||
| Homebuilding | 1 | $35B |
|
||
| Technology Manufacturing | 1 | $35B |
|
||
Price history
+2185.7% since first listed8 events — show timeline
- 2026-05-13 Price Changed $320,000 NAPLESMLS
- 2026-04-02 Price Changed $350,000 NAPLESMLS
- 2025-10-21 Listed $355,000 NAPLESMLS
- 2025-06-03 Sold (Public Records) $26,000 Public Records
- 2025-05-27 Sold (MLS) $26,000 FORTMLS
- 2025-03-13 Price Changed $28,000 FORTMLS
- 2025-03-10 Listed $25,000 FORTMLS
- 2024-03-04 Sold (Public Records) $14,000 Public Records
Property tax history
+24.5%/yrLatest (2025): $509 · +33.1% YoY. Source: county tax records.
Cash-flow waterfall
monthlySold comps — $/sqft
last 12 mo · ≤1 miLoading sold comps…