 Multi-family
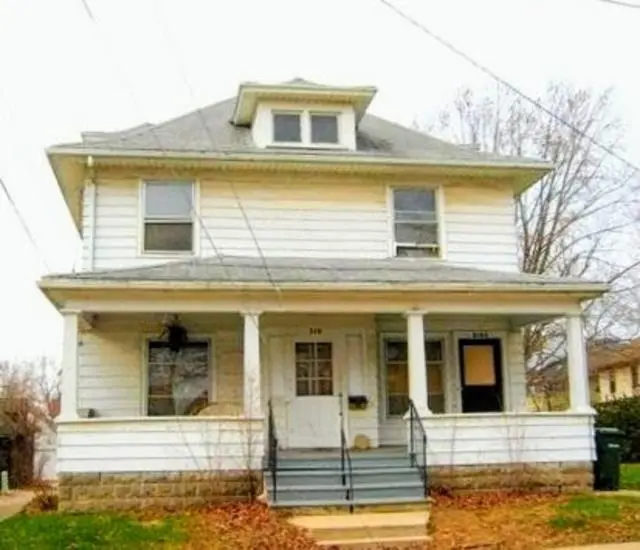
216 Allen St · Waterloo, IA
Flood risk 1/10 · Minimal
- FEMA flood zone
- X (unshaded)
- Chance of flooding over 30 yrs
- 0.0%
- Est. flood insurance / yr
- $473 – $860
Fire risk 1/10 · Minimal
- Est. fire insurance / yr
- $902 – $1,676
Heat risk 3/10 · Minor
- Hot days now (above 101°F)
- 7 days/yr
- Hot days in 30 yrs
- 16 days/yr
Wind risk 2/10 · Minimal
- Chance of severe wind over 30 yrs
- —
Air-quality risk 1/10 · Minimal
- Unhealthy air days now
- 0 days/yr
- Unhealthy air days in 30 yrs
- 0 days/yr
Risk factors via First Street. Map © Google.
Why this score? — see what drove the B grade
The composite is a weighted blend of 9 inputs, each scored 0–100. Each bar is that input's sub-score; the figure is the points it added to the 100-point composite (weight × sub-score).
- Cash flow +30.0/30.0
- 1% rule +10.0/10.0
- DSCR +10.0/10.0
- ARV discount +7.5/15.0
- Schools +4.4/10.0
- Livability +4.0/5.0
- Rent growth +3.5/5.0
- Condition / age +2.5/5.0
- Appreciation +0.0/10.0
$65,000
🖨 Deal sheet (PDF) 📄 Offer letter ✓ Due diligence
Multi-family units
County records classify this as Multi-Family (2-4 Unit). Listing-text estimate: 1 unit. estimate disagrees with records
Listing remarks MLS
Discover the versatile charm of this multifamily property located in the heart of Waterloo's historic Church Row district. Whether you're an investor or looking for a home with rental potential, 216 & 216 1/2 Allen Street offers two distinct living spaces with classic 1911 architecture. Property Highlights: 216 Allen St (Lower Unit): A spacious 1-bedroom, 1-bathroom unit featuring a welcoming front porch, elegant French doors, and warm wood flooring throughout. 216 1/2 Allen St (Upper Unit): A 2-bedroom, 1-bathroom apartment with beautifully redone hardwood floors and ample natural light. Convenience: Includes on-site laundry and dedicated off-street parking for residents. Prime Location Situated in a charming Cedar Valley neighborhood, this property is just minutes away from Waterloo's vibrant downtown and Museum District. Tenants will enjoy easy access to local favorites like George Wyth State Park and seasonal community events.
Key facts
- Elegant french doors
- Multifamily property
- Warm wood flooring
Tags
Neighborhood map
What this means for you Summary
Snapshot
- This is a 2-bed/2.5-bath multifamily listed at $65k.
Deal economics
- At list price, monthly cash flow is $652 ($8k/yr) — positive.
- The deal already cash-flows at list — no discount required.
- Meets the 1% rule at list price ($1k rent vs $65k).
- Recommended offer: $59k (9.0% below list) — sets the bar for market timing.
- Cap rate 18.3% vs local median 4.2% in Waterloo — top-decile yield for the area; either an underpriced asset or a hidden risk that comps aren't pricing in. Stress-test before assuming the spread holds.
Location & tenants
- Location reads 81/100 on livability (#74 in IA, #1,589 nationally) — a professional / high-income tenant draw. Strengths: commute A+, cost of living A+, housing A+; Watch: schools C-, crime F, employment D-.
- Waterloo Community School District (urban): math 50% / reading 54% proficiency, ranked #276 of 289 in IA (top 96%) — acceptable for families but not a draw, mixed tenant base, ~2y average lease.
- Market conditions: Rents rising (+3.8%/yr); 282 active listings in the ZIP; 28 comparable units currently listed for rent nearby; rentals lingering (median 44d on market — plan ~5-8 weeks vacancy on turnover, expect pricing pressure); 54% of comp listings sitting > 30 days — soft ceiling on asking rent; 287 units permitted in Black Hawk County in 2024 (67 in 5+ unit buildings).
Forward outlook
- Local home prices are declining (-3.0%/yr); year-one equity from $449 of loan paydown is wiped out by about $2k of value loss. Plan a longer hold.
- Black Hawk County population projected at +10% by 2050 — modest demand growth; plan on rents tracking national, not racing it.
- At projected returns (-3.0% appreciation + 3.8% rent growth), your $18k cash investment doubles in ~3 years — after that, you're playing with house money.
Negotiation context
- It's been on market 103 days — a 9% lower offer ($59k) is reasonable based on typical stale-listing flexibility.
- 2 sale attempts since 9y ago with the ask held roughly flat each time — persistent listings suggest the price (not the market) is what's stuck; bring a comps-based counter.
- Current owner paid $38k; list at $65k implies a 71% gain — meaningful room to come down on a strong offer.
Risks & watch-outs
- Watch-outs: built in 1911 — expect roof / HVAC / electrical / plumbing capex.
Questions for the listing agent
- It's been on market 103 days. Have you received any prior offers? Is the seller open to a 9% concession, seller financing, or rate buy-down credit?
- Built in 1911 — when were the roof, HVAC, electrical panel, plumbing, and water heater last replaced?
- Why hasn't it sold? Are there any deal-killer items the seller is aware of (foundation, flood, title, zoning, code violations)?
- Is there a deadline driving the sale (1031 exchange, divorce, estate, relocation)? That informs how much negotiation room exists.
- Crime grade is F in this area — have there been break-ins, vandalism, or insurance claims at this property in the last 3 years? What carrier currently insures it and at what premium?
- What's the average days-on-market for RENTAL listings here right now (not sales)? A rising rental-DOM trend means longer vacancies and softer asking-rent achievability than the comps imply.
- What's the recent tenant-quality profile in this submarket — average credit score on applications, eviction rate, late-payment / NSF rate, and stable-employment percentage? A property-management company in the area should have these aggregated.
- How much new apartment / multifamily construction is in the pipeline within 1–3 miles? Heavy new supply (>2% of stock underway) typically softens rents 12–24 months out; light construction supports rent growth.
Investment metrics
- 1% rule
- 2.18% ✓
- Cap rate
- 18.33%
- Cash-on-cash
- 42.98%
- DSCR
- 2.91
- GRM
- 3.8
CMA / ARV
- ARV (median comp)
- $134,855
- List price
- $65,000
- Delta
- -51.80%
- Verdict
- UNDERPRICED
- Comps
- 3 within 1.0 mi
Projected returns pro-forma
-3.0% appreciation · 3.8% rent growth · sell at horizon
- IRR
- 40.7%
- Equity multiple
- 2.77×
- Total profit
- $32,173
- Equity at exit
- $9,692
- IRR
- 47.4%
- Equity multiple
- 5.75×
- Total profit
- $86,415
- Equity at exit
- $5,620
Cash invested: $18,200 (down + closing). Projections, not guarantees.
Landlord ↔ Tenant lean methodology
- Overall (STATE)
- 83 Strongly Landlord-Friendly
- State Iowa
- 83 Strongly Landlord-Friendly · R+6
- County
- — inherits STATE
- City
- — inherits STATE
ZIP-level market 50701
- Rents YoY
- 3.8%
- Active inventory
- 282
- Price-to-rent
- 7.8×
Monthly cashflow live
- Estimated rent
- $1,418 high interval (Pro) →
- Mortgage (P&I)
- −$341
- Tax from tax record
- −$100 /mo · $1,204/yr
- Insurance
- −$27
- HOA
- −$0
- Vacancy / Maint / Mgmt
- −$298
- Net cashflow
- $652
Break-even live
Sensitivity live
| Price | -10% $689 | -5% $670 | +0% $652 | +5% $634 | +10% $615 |
|---|---|---|---|---|---|
| Rent | -10% $540 | -5% $596 | +0% $652 | +5% $708 | +10% $764 |
| Rate | -1.0pp $685 | -0.5pp $668 | base $652 | +0.5pp $635 | +1.0pp $618 |
2-unit breakdown (identical units grouped — click to expand)
| Units | Beds | Baths | Est. rent |
|---|---|---|---|
| 1× unit | 1 | 1 | $691 |
| 1× unit | 2 | 1 | $727 |
| Total (2 units) | $1,418 | ||
UW: 25.0% down · 7.5% · 30yr · 1.5% tax · 5.0% vac · 8.0% maint · 8.0% mgmt
Financing live
Cash to close
- Down payment
- $16,250
- Closing costs
- $1,950
- Reserves months
- —
- Total cash needed
- —
Loan-product check · same deal, 3 products live
Conventional
25% down · 7.5% · 30yr
- Down + closing
- —
- Monthly P&I
- —
- Monthly cashflow
- —
- DSCR
- —
- Eligible?
- —
Personal DTI + credit; lowest rate.
DSCR
20% down · 8.5% · 30yr
- Down + closing
- —
- Monthly P&I
- —
- Monthly cashflow
- —
- DSCR
- —
- Eligible?
- —
No personal income docs; deal must DSCR.
Hard money
10% down · 12.0% · 12mo
- Down + closing
- —
- Monthly P&I
- —
- Monthly cashflow
- —
- DSCR
- —
- Eligible?
- —
Short-term bridge; refi at stabilization.
Rent comps 28 comps
| Address | Beds | Baths | Sqft | Rent | $/sqft | DOM | Units | Dist |
|---|---|---|---|---|---|---|---|---|
| 820 W 2nd St Apt 2 Waterloo, IA | 2.0 | 1.5 | 1100 | $695 | $0.63 | 44d | 1 | 0.06mi |
| 418 Sunnyside Ave Waterloo, IA | 3.0 | 1.0 | 1200 | $675 | $0.56 | 44d | 1 | 0.10mi |
| 416 Sunnyside Ave Waterloo, IA | 3.0 | 1.0 | 1200 | $825 | $0.69 | 44d | 1 | 0.10mi |
| 313 Denver St Unit Downstairs Waterloo, IA | 2.0 | 1.5 | 950 | $695 | $0.73 | 21d | 1 | 0.28mi |
| W Mullan Ave Waterloo, IA | 2.0 | 1.0 | 918 | $710 | $0.77 | 44d | 2 | 0.33mi |
| 1427 W 2nd St Waterloo, IA | 3.0 | 1.0 | 1248 | $1,250 | $1.00 | 44d | 1 | 0.41mi |
| 702 Western Ave Waterloo, IA | 2.0 | 1.5 | 1500 | $1,100 | $0.73 | 21d | 1 | 0.43mi |
| 45 W Jefferson St Waterloo, IA | 1.0–2.0 | 1.0–2.0 | 1062 | $1,750 | $1.65 | 21d | 9 | 0.48mi |
| 1524 1/2 W 5th St Unit 1524 1/2 Waterloo, IA | 2.0 | 1.0 | 981 | $850 | $0.87 | 21d | 1 | 0.51mi |
| 302 Commercial St Waterloo, IA | 1.0 | 1.0 | 901 | $1,100 | $1.22 | 21d | 1 | 0.53mi |
| 223 W 4th St Ste 203 Waterloo, IA | 2.0 | 1.5 | 1466 | $1,250 | $0.85 | 44d | 1 | 0.58mi |
| 616 Kimball Ave Waterloo, IA | 3.0 | 1.0 | 1302 | $1,100 | $0.84 | 44d | 1 | 0.58mi |
| 905 Baltimore St Waterloo, IA | 3.0 | 1.5 | 1392 | $1,025 | $0.74 | 44d | 1 | 0.64mi |
| 1840 W 3rd St Waterloo, IA | 2.0 | 1.0 | 1770 | $700 | $0.40 | 45d | 1 | 0.64mi |
| 719 Marsh St Waterloo, IA | 3.0 | 1.0 | 1224 | $1,100 | $0.90 | 21d | 1 | 0.65mi |
| 136 Janney Ave Waterloo, IA | 2.0 | 2.0 | 901 | $1,325 | $1.47 | 44d | 1 | 0.85mi |
| 824 Sycamore St Unit 824-09 Waterloo, IA | 2.0 | 2.0 | 1054 | $1,250 | $1.19 | 44d | 1 | 0.92mi |
| 311 E 3rd St Waterloo, IA | 2.0 | 2.0 | 1154 | $1,500 | $1.30 | 21d | 1 | 0.94mi |
| 1112 Byron Ave Unit 1114 Waterloo, IA | 2.0 | 1.0 | 896 | $930 | $1.04 | 21d | 1 | 0.94mi |
| 924 Sycamore St #1 Waterloo, IA | 2.0 | 2.0 | 1054 | $1,250 | $1.19 | 44d | 1 | 0.95mi |
| 920-928 Sycamore St Unit 920-07 Waterloo, IA | 2.0 | 2.0 | 1054 | $1,250 | $1.19 | 44d | 1 | 0.98mi |
| 910 Mulberry St Apt 3 Waterloo, IA | 2.0 | 1.0 | 1064 | $695 | $0.65 | 21d | 1 | 1.10mi |
| 1107 Mulberry St Waterloo, IA | 3.0 | 1.0 | 1248 | $950 | $0.76 | 21d | 1 | 1.20mi |
| 2539 W 3rd St Waterloo, IA | 3.0 | 2.5 | 1200 | $1,695 | $1.41 | 21d | 1 | 1.23mi |
| 2215 Falls Ave Waterloo, IA | 3.0 | 1.0 | 1290 | $1,400 | $1.09 | 44d | 1 | 1.33mi |
| 214 Edwards St Waterloo, IA | 3.0 | 1.0 | 1150 | $825 | $0.72 | 21d | 1 | 1.39mi |
| 105 Bellaire Rd Waterloo, IA | 2.0 | 2.0 | 1088 | $1,100 | $1.01 | 21d | 1 | 1.46mi |
| 154 Acadia St Unit 2 Waterloo, IA | 2.0 | 1.0 | 995 | $1,200 | $1.21 | 44d | 1 | 1.48mi |
Listing history 10 events
-
2026-06-02days on market $65,000 Active 103 DOM
-
2026-06-01days on market $65,000 Active 102 DOM
-
2026-05-31days on market $65,000 Active 101 DOM
-
2026-05-30days on market $65,000 Active 100 DOM
-
2026-02-19$65,000 Active 950-char remark
Show marketing remark (950 chars)
Discover the versatile charm of this multifamily property located in the heart of Waterloo's historic Church Row district. Whether you're an investor or looking for a home with rental potential, 216 & 216 1/2 Allen Street offers two distinct living spaces with classic 1911 architecture. Property Highlights: 216 Allen St (Lower Unit): A spacious 1-bedroom, 1-bathroom unit featuring a welcoming front porch, elegant French doors, and warm wood flooring throughout. 216 1/2 Allen St (Upper Unit): A 2-bedroom, 1-bathroom apartment with beautifully redone hardwood floors and ample natural light. Convenience: Includes on-site laundry and dedicated off-street parking for residents. Prime Location Situated in a charming Cedar Valley neighborhood, this property is just minutes away from Waterloo's vibrant downtown and Museum District. Tenants will enjoy easy access to local favorites like George Wyth State Park and seasonal community events.
-
2023-11-24historical $595
-
2023-10-20price $595
-
2018-06-18soldstatus $38,000
-
2018-06-15soldstatus $38,000 103-char remark
Show marketing remark (103 chars)
Can be purchased with 216 Randolph. $86,000 for both. Rent is $1000 per month. Listing agent is seller.
-
2017-10-31$39,200 103-char remark
Show marketing remark (103 chars)
Can be purchased with 216 Randolph. $86,000 for both. Rent is $1000 per month. Listing agent is seller.
ⓘ Source: listings_history table (triggers on properties + properties_extension) + one-shot
backfill from property_details.listing_events for pre-trigger history.
Tax reassessment forecast IA · Partial reset (capped growth)
- Current annual tax
- $1,204 · $100/mo
- Projected year-2 tax
- $1,204 · $100/mo
- Expected delta
- $0/yr ($0/mo · 0.0%)
ⓘ Screening estimate from a state-policy table — verify with the county assessor before closing.
Climate risk First Street
- Flood 1/10 Low FEMA zone X (unshaded) · 0% chance over 30 yrs
- Wildfire 1/10 Low
- Heat 3/10 Moderate 7 d/yr ≥101°F today · 16 d/yr by 30 yrs out
- Wind 2/10 Low
- Air quality 1/10 Low 0 unhealthy d/yr today · 0 by 30 yrs out
Nearby sold comps map
Loading sold comps map…
Walkable amenities ~0.75 mi
Loading nearby amenities…
Taxation est. · year 1
- Rental income
- $17,016
- − Mortgage interest
- −$3,641
- − Property taxes
- −$1,204
- − Insurance
- −$325
- − Repairs & maintenance
- −$1,361
- − Management
- −$1,361
- − Depreciation
- −$1,891
- Taxable income
- $7,233
- Est. tax owed @ 24.0%
- −$1,736
- After-tax cash flow
- $6,087/yr
For passive investors: Depreciation is non-cash, so a rental often shows a tax loss while cash-flowing — sheltering income. Rental losses are passive: they offset passive income freely, and up to $25,000/yr can offset ordinary (W-2) income if you actively participate and your MAGI is under $100k (phasing out to $0 by $150k); unused losses carry forward. On sale, claimed depreciation is recaptured at up to 25%, and gains may owe capital-gains tax (a 1031 exchange can defer both). Figures are a year-1 estimate at your 24.0% rate — not tax advice; consult a CPA.
Schools (NCES district)
- District
- Waterloo Community School District
- NCES district ID
- 1930480
- Math proficiency
- 50% ▼ -4.00%
- Reading proficiency
- 54% ▲ 1.00%
- Median HH income
- $42,545
- Composite
- 43.72/100
- National rank
- #2950
- State rank
- #276 of 289 in IA
Livability — Waterloo
- Score
- 81/100
- State rank
- #74
- US rank
- #1589
Category grades
Schools grade is shown separately in the Schools card above.
Census & demographics
- Census place
- Waterloo, IA
- County
- Black Hawk County · 112,933 people
- City population
- 69,066
- Metro
- Waterloo-Cedar Falls, IA
- Population (ZIP)
- 30,232
- Household income
- $61,475
- Rent vs Own
- Severe rent burden
- 1377.0
Population outlook (Black Hawk County) Hauer SSP2
- Today (2025)
- 139,716 people
- By 2030
- 142,853 · +2.2%
- By 2040
- 147,843 · +5.8%
- By 2050
- 153,247 · +9.7%
- By 2075
- 167,977 · +20.2%
- By 2100
- 177,320 · +26.9%
Race, ethnicity, and origin ACS 2023
- Neighborhood character
- Predominantly White (78%)
- Race & ethnicity
- White 78% Black 11% Two or more races 5% Hispanic / Latino 3% Asian 3%
- Common ancestry
- Portuguese 3% Italian 3% American 2%
- Foreign-born
- 7% · Canada, South Korea, Vietnam
- Languages at home
- 92% English-only · Russian/Polish/Slavic 2% Spanish 2% French/Haitian/Cajun 2%
Political lean MEDSL · Black Hawk
- 2024 margin
- Toss-up / Even · D 50.0% · R 48.8% · Other 1.2%
- 2008→2024 swing
- -21.3pp toward R · 2008: 22.4pp · 2024: 1.2pp
- All cycles
- 2024: D+1.2 2020: D+9.0 2016: D+7.3 2012: D+20.0 2008: D+22.4
Not yet ingested
- Civics
- —
Market trends
- HPI YoY
- ▼ -107.19%
- Current HPI
- 162.8951
- Rent YoY
- ▲ 3.80%
- Metro
- Waterloo-Cedar Falls, IA
- State GDP YoY
- ▲ 2.48%
- F500 in state
- 4
Industry mix (Fortune 500 HQ in IA)
| Industry | F500 HQs | Revenue |
|---|---|---|
| Financial Services | 1 | $16B |
|
||
| Retail / Convenience | 1 | $15B |
|
||
Price history
+65.8% since first listed6 events — show timeline
- 2026-02-19 Listed $65,000 NEIRBR as distributed by MLS GRID
- 2023-11-24 Rental Removed $595 APPFOLIO
- 2023-10-20 Price Changed $595 APPFOLIO
- 2018-06-18 Sold (Public Records) $38,000 Public Records
- 2018-06-15 Sold (MLS) $38,000 NEIRBR as distributed by MLS GRID
- 2017-10-31 Listed $39,200 NEIRBR as distributed by MLS GRID
Property tax history
+2.9%/yrLatest (2025): $1,204 · +8.5% YoY. Source: county tax records.
Cash-flow waterfall
monthlySold comps — $/sqft
last 12 mo · ≤1 miLoading sold comps…