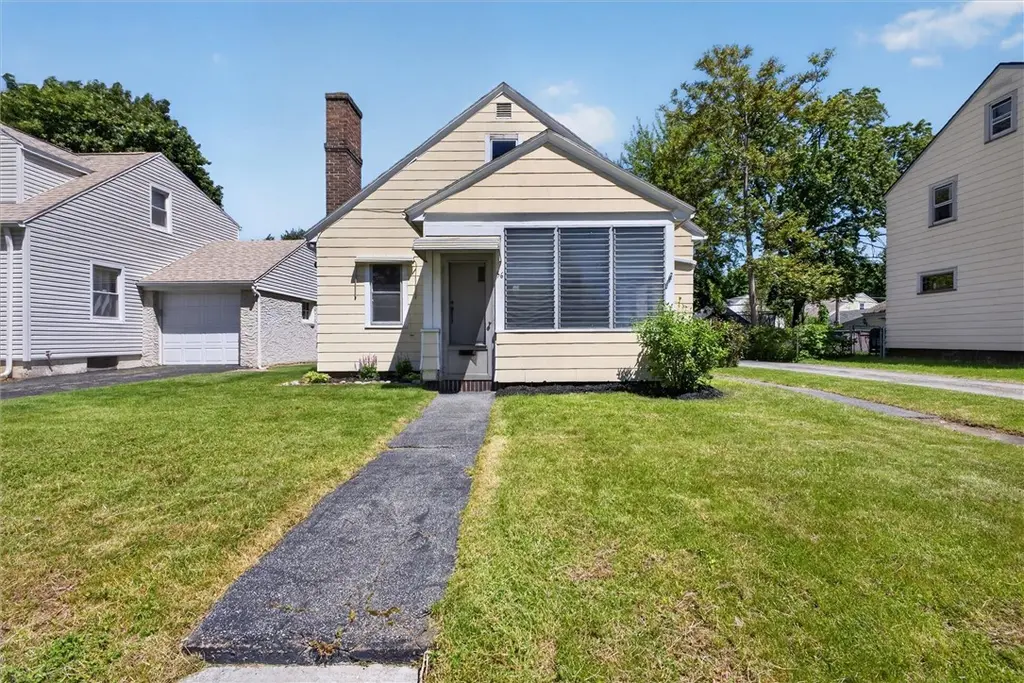
56 Langford Rd · Rochester, NY
Flood risk 1/10 · Minimal
- FEMA flood zone
- X (unshaded)
- Chance of flooding over 30 yrs
- 0.0%
- Est. flood insurance / yr
- $473 – $860
Fire risk 3/10 · Minor
- Est. fire insurance / yr
- $691 – $1,283
Heat risk 2/10 · Minimal
- Hot days now (above 96°F)
- 7 days/yr
- Hot days in 30 yrs
- 15 days/yr
Wind risk 1/10 · Minimal
- Chance of severe wind over 30 yrs
- —
Air-quality risk 2/10 · Minimal
- Unhealthy air days now
- 1 days/yr
- Unhealthy air days in 30 yrs
- 2 days/yr
Risk factors via First Street. Map © Google.
Why this score? — see what drove the C+ grade
The composite is a weighted blend of 9 inputs, each scored 0–100. Each bar is that input's sub-score; the figure is the points it added to the 100-point composite (weight × sub-score).
- Cash flow +24.8/30.0
- ARV discount +15.0/15.0
- DSCR +8.0/10.0
- 1% rule +5.9/10.0
- Livability +3.8/5.0
- Rent growth +2.5/5.0
- Condition / age +2.5/5.0
- Schools +1.9/10.0
- Appreciation +0.0/10.0
$149,900
🖨 Deal sheet 📄 Offer letter ✓ Due diligence
Listing remarks
Welcome to 56 Langford Rd, a charming 1,377 SF Cape Cod built in 1937 offering 2 bedrooms, 1.5 baths & an attached 2-car garage. Step inside to a freshly updated interior, professionally painted throughout in May ’26. The inviting living room features hardwood floors & a working wood-burning fireplace, creating a warm focal point as you enter. The formal dining room sits just off the main living space, offering an easy flow for everyday living or entertaining. Continue into the kitchen featuring LVP flooring (May ’26), gas stove, double sink, garbage disposal & refrigerator. The enclosed sunporch also offers new LVP flooring (May ’26), giving you a bright
Key facts
- Finished attic
- Enclosed sunporch
- Double wide driveway
Tags
Property features AI
Exterior
- Parking: Attached garage; 2 garage spaces; Driveway
- Utilities: High-speed internet available; Public water connected; Sewer connected
- Home design: Single-story; Resale property
- Construction: Composite siding; Asphalt roof; Block foundation; Built (existing)
- Exterior features: Blacktop driveway; Enclosed porch; Porch; Partial fencing; Fence
Interior
- Kitchen: Disposal; Gas oven; Gas range; Refrigerator
- Bedrooms: 2 bedrooms on the main level
- Flooring: Carpet; Hardwood; Luxury vinyl; Tile; Varies
- Bathrooms: 1 full bathroom; 1 half bathroom; 1 main-level bathroom
- Heating & cooling: Gas forced-air heating; Central air conditioning; Circuit breaker electrical service
- Interior features: Attic; Ceiling fan(s); Separate/formal dining room; Entrance foyer; Separate/formal living room; Storage; Bar; Natural woodwork
- Laundry & utility: Laundry in basement; Gas water heater
Neighborhood map
What this means for you Summary
Snapshot
- This is a 3-bed/1.5-bath single-family listed at $150k.
Deal economics
- At list price, monthly cash flow is $315 ($4k/yr) — positive.
- The deal already cash-flows at list — no discount required.
- Meets the 1% rule at list price ($2k rent vs $150k).
Location & tenants
- Location reads 76/100 on livability (#222 in NY, #3,482 nationally) — a middle-class / working-renter tenant base. Strengths: commute A+, cost of living A+, housing A+; Watch: schools D+, crime F, employment F.
- Rochester City School District (urban): math 21% / reading 26% proficiency, ranked #589 of 590 in NY (top 100%) — low school quality limits family demand, transient renter base, plan for 1-2y turnover; 82% free/reduced lunch — lower-income household profile, screen leases tightly.
- Market conditions: 74 active listings in the ZIP; 11 comparable units currently listed for rent nearby; rentals leasing fast (median 3d on market — plan ~1-2 weeks tenant-placement turnaround); 1,169 units permitted in Monroe County in 2024 (591 in 5+ unit buildings).
- This rent runs 38% of the median local income ($51k/yr) — at the standard rent-burdened threshold; future hikes will face affordability resistance.
Forward outlook
- Local home prices are declining (-3.0%/yr); year-one equity from $1k of loan paydown is wiped out by about $4k of value loss. Plan a longer hold.
- Monroe County population projected to shrink 6% by 2050 — rents likely to lag national; underwrite the cash flow, not the appreciation.
Negotiation context
- Only 8 days on market — expect competitive offers; lowballing is unlikely to land.
- Current owner paid $76k; list at $150k implies a 96% gain — meaningful room to come down on a strong offer.
Risks & watch-outs
- Watch-outs: built in 1937 — expect roof / HVAC / electrical / plumbing capex.
Questions for the listing agent
- Built in 1937 — when were the roof, HVAC, electrical panel, plumbing, and water heater last replaced?
- Is there a deadline driving the sale (1031 exchange, divorce, estate, relocation)? That informs how much negotiation room exists.
- Schools are D-rated, which usually means shorter tenancies and higher turnover. Who's the typical renter profile here, and what's been the actual vacancy rate?
- Crime grade is F in this area — have there been break-ins, vandalism, or insurance claims at this property in the last 3 years? What carrier currently insures it and at what premium?
- What's the average days-on-market for RENTAL listings here right now (not sales)? A rising rental-DOM trend means longer vacancies and softer asking-rent achievability than the comps imply.
- What's the recent tenant-quality profile in this submarket — average credit score on applications, eviction rate, late-payment / NSF rate, and stable-employment percentage? A property-management company in the area should have these aggregated.
- How much new for-sale + rental construction is in the pipeline within 1–3 miles? Heavy new supply typically softens prices + rents 12–24 months out; constrained supply supports both.
Investment metrics
- 1% rule
- 1.09% ✓
- Cap rate
- 8.82%
- Cash-on-cash
- 9.01%
- DSCR
- 1.40
- GRM
- 7.7
CMA / ARV
- ARV (on-the-fly)
- $185,895
- Comps found
- 12
Show comp detail 12 sales within ~0.75 mi
| Address | Dist | Beds/Ba | Sqft | Sold | Price | $/sf | Match |
|---|---|---|---|---|---|---|---|
| 75 Dorothy Ave | 0.20mi | 3/2.0 | 1,280 (-7%) | 6mo | $161,000 | $126 | 72 |
| 2351 Dewey Ave | 0.35mi | 3/1.0 | 1,292 (-6%) | 3mo | $165,000 | $128 | 69 |
| 19 Mac Arthur Rd | 0.42mi | 4/1.0 (+1) | 1,416 (+3%) | 2mo | $183,000 | $129 | 67 |
| 22 Mac Arthur Rd | 0.43mi | 4/2.0 (+1) | 1,332 (-3%) | 1mo | $242,000 | $182 | 66 |
| 2201 Dewey Ave | 0.15mi | 3/2.5 | 1,525 (+11%) | 6mo | $199,900 | $131 | 66 |
| 378 Bernice St | 0.21mi | 4/1.0 (+1) | 1,488 (+8%) | 5mo | $165,000 | $111 | 65 |
| 222 Oakwood Rd | 0.66mi | 2/1.0 (-1) | 1,332 (-3%) | 0mo | $180,000 | $135 | 56 |
| 27 Woodside Ln | 0.37mi | 3/2.0 | 1,578 (+15%) | 4mo | $216,500 | $137 | 53 |
| 118 Rand St | 0.62mi | 3/1.0 | 1,226 (-11%) | 6mo | $77,000 | $63 | 46 |
| 80 Everett St | 0.55mi | 3/1.0 | 1,172 (-15%) | 4mo | $190,000 | $162 | 44 |
| 62 Benwell Rd | 0.63mi | 2/1.5 (-1) | 1,200 (-13%) | 2mo | $210,000 | $175 | 43 |
| 226 Oakwood Rd | 0.67mi | 3/1.0 | 1,200 (-13%) | 6mo | $170,000 | $142 | 40 |
Match score weights: distance 35% · size 25% · config 20% · recency 20%. Top-matched comps best support the ARV.
Projected returns pro-forma
-3.0% appreciation · 3.0% rent growth · sell at horizon
- IRR
- -2.7%
- Equity multiple
- 0.90×
- Total profit
- $-4,223
- Equity at exit
- $22,351
- IRR
- 7.0%
- Equity multiple
- 1.53×
- Total profit
- $22,121
- Equity at exit
- $12,961
Cash invested: $41,972 (down + closing). Projections, not guarantees.
Landlord ↔ Tenant lean methodology
- Overall (STATE)
- 15 Strongly Tenant-Friendly
- State New York
- 15 Strongly Tenant-Friendly · D+10
- County
- — inherits STATE
- City
- — inherits STATE
ZIP-level market 14615
- Home prices YoY
- -11.7%
- Active inventory
- 74
- Price-to-rent
- 7.7×
Monthly cashflow live
- Estimated rent
- $1,629 high interval (Pro) →
- Mortgage (P&I)
- −$786
- Tax from tax record
- −$123 /mo · $1,477/yr
- Insurance
- −$62
- HOA
- −$0
- Vacancy / Maint / Mgmt
- −$342
- Net cashflow
- $315
Break-even live
UW: 25.0% down · 7.5% · 30yr · 1.5% tax · 5.0% vac · 8.0% maint · 8.0% mgmt
Financing live
Cash to close
- Down payment
- $37,475
- Closing costs
- $4,497
- Reserves months
- —
- Total cash needed
- —
Loan-product check · same deal, 3 products live
Conventional
25% down · 7.5% · 30yr
- Down + closing
- —
- Monthly P&I
- —
- Monthly cashflow
- —
- DSCR
- —
- Eligible?
- —
Personal DTI + credit; lowest rate.
DSCR
20% down · 8.5% · 30yr
- Down + closing
- —
- Monthly P&I
- —
- Monthly cashflow
- —
- DSCR
- —
- Eligible?
- —
No personal income docs; deal must DSCR.
Hard money
10% down · 12.0% · 12mo
- Down + closing
- —
- Monthly P&I
- —
- Monthly cashflow
- —
- DSCR
- —
- Eligible?
- —
Short-term bridge; refi at stabilization.
Rent comps 11 comps
| Address | Beds | Baths | Sqft | Rent | $/sqft | DOM | Units | Dist |
|---|---|---|---|---|---|---|---|---|
| 1902 Dewey Ave Unit 1896 Rochester, NY | 2.0 | 1.0 | 900 | $1,150 | $1.28 | 23d | 1 | 0.31mi |
| 60 Grand Teton St Greece, NY | 2.0–3.0 | 2.0 | 1833 | $2,673 | $1.46 | 2d | 3 | 0.72mi |
| 100 Andover St Rochester, NY | 2.0 | 1.0 | 750 | $1,795 | $2.39 | 2d | 63 | 0.74mi |
| 230 Pullman Ave Unit 1 Rochester, NY | 2.0 | 1.0 | 900 | $1,100 | $1.22 | 14d | 1 | 0.77mi |
| 116 Ridgeway Ave Rochester, NY | 3.0 | 2.0 | 1032 | $1,650 | $1.60 | 2d | 1 | 0.97mi |
| 248 Flower City Park Rochester, NY | 3.0 | 1.0 | 1350 | $1,800 | $1.33 | 3d | 1 | 1.05mi |
| 287 Electric Ave Rochester, NY | 3.0 | 1.5 | 1297 | $1,500 | $1.16 | 2d | 1 | 1.13mi |
| 45 Clay Ave Rochester, NY | 3.0 | 1.0 | 1000 | $1,700 | $1.70 | 14d | 1 | 1.18mi |
| 60 Cheltenham Rd Unit Down Rochester, NY | 2.0 | 1.0 | 1014 | $1,300 | $1.28 | 14d | 1 | 1.23mi |
| 83 Navarre Rd Rochester, NY | 3.0 | 2.0 | 1322 | $2,250 | $1.70 | 2d | 1 | 1.41mi |
| 1097 Dewey Ave Unit B Rochester, NY | 2.0 | 1.0 | 1008 | $1,150 | $1.14 | 14d | 1 | 1.45mi |
Listing history 8 events
-
2026-06-05statusdays on market $149,900 Pending 8 DOM
-
2026-06-03days on market $149,900 Active 7 DOM
-
2026-06-03days on market $149,900 Active 6 DOM
-
2026-06-01days on market $149,900 Active 5 DOM
-
2026-05-31days on market $149,900 Active 4 DOM
-
2026-05-27$149,900 Active
-
2007-07-26soldstatus $76,300
-
1997-11-24soldstatus $62,000
ⓘ Source: listings_history table (triggers on properties + properties_extension) + one-shot
backfill from property_details.listing_events for pre-trigger history.
Tax reassessment forecast NY · Partial reset (capped growth)
- Current annual tax
- $1,477 · $123/mo
- Projected year-2 tax
- $2,005 · $167/mo
- Expected delta
- +$528/yr (+$44/mo · 35.8%)
ⓘ Screening estimate from a state-policy table — verify with the county assessor before closing.
Climate risk First Street
- Flood 1/10 Low FEMA zone X (unshaded) · 0% chance over 30 yrs
- Wildfire 3/10 Moderate
- Heat 2/10 Low 7 d/yr ≥96°F today · 15 d/yr by 30 yrs out
- Wind 1/10 Low
- Air quality 2/10 Low 1 unhealthy d/yr today · 2 by 30 yrs out
Nearby sold comps map
Loading sold comps map…
Walkable amenities ~0.75 mi
Loading nearby amenities…
Taxation est. · year 1
- Rental income
- $19,548
- − Mortgage interest
- −$8,397
- − Property taxes
- −$1,477
- − Insurance
- −$750
- − Repairs & maintenance
- −$1,564
- − Management
- −$1,564
- − Depreciation
- −$4,361
- Taxable income
- $1,437
- Est. tax owed @ 24.0%
- −$345
- After-tax cash flow
- $3,439/yr
For passive investors: Depreciation is non-cash, so a rental often shows a tax loss while cash-flowing — sheltering income. Rental losses are passive: they offset passive income freely, and up to $25,000/yr can offset ordinary (W-2) income if you actively participate and your MAGI is under $100k (phasing out to $0 by $150k); unused losses carry forward. On sale, claimed depreciation is recaptured at up to 25%, and gains may owe capital-gains tax (a 1031 exchange can defer both). Figures are a year-1 estimate at your 24.0% rate — not tax advice; consult a CPA.
Schools (NCES district)
- District
- Rochester City School District
- NCES district ID
- 3624750
- Math proficiency
- 21% ▬ 0.00%
- Reading proficiency
- 26% ▲ 4.00%
- Median HH income
- $30,923
- Composite
- 18.98/100
- National rank
- #8850
- State rank
- #589 of 590 in NY
Livability — Rochester
- Score
- 76/100
- State rank
- #222
- US rank
- #3482
Category grades
Schools grade is shown separately in the Schools card above.
Census & demographics
- Census place
- Rochester, NY
- County
- Monroe County · 674,131 people
- City population
- 432,803
- Metro
- Rochester, NY
- Population (ZIP)
- 17,884
- Household income
- $51,262
- Rent vs Own
- Severe rent burden
- 1245.0
Population outlook (Monroe County) Hauer SSP2
- Today (2025)
- 759,460 people
- By 2030
- 757,154 · -0.3%
- By 2040
- 740,644 · -2.5%
- By 2050
- 714,443 · -5.9%
- By 2075
- 645,883 · -15.0%
- By 2100
- 547,084 · -28.0%
Race, ethnicity, and origin ACS 2023
- Neighborhood character
- Diverse neighborhood (Simpson 0.68)
- Race & ethnicity
- White 45% Black 27% Hispanic / Latino 20% Two or more races 9% Asian 3%
- Hispanic origin (detail)
- Puerto Rican 16% Cuban 2%
- Common ancestry
- Arab 3% Romanian 2% Subsaharan African 2%
- Foreign-born
- 10% · Canada, India, Vietnam
- Languages at home
- 81% English-only · Spanish 11% Arabic 2% Other Indo-European 2%
Political lean MEDSL · Monroe
- 2024 margin
- D (+19.1) · D 59.5% · R 40.5%
- 2008→2024 swing
- +1.4pp toward D · 2008: 17.7pp · 2024: 19.1pp
- All cycles
- 2024: D+19.1 2020: D+21.0 2016: D+14.1 2012: D+17.4 2008: D+17.7
Not yet ingested
- Civics
- —
Market trends
- HPI YoY
- ▼ -31.81%
- Current HPI
- 240.6896
- Rent YoY
- —
- Metro
- Rochester, NY
- State GDP YoY
- ▲ 2.60%
- F500 in state
- 92
Industry mix (Fortune 500 HQ in NY)
| Industry | F500 HQs | Revenue |
|---|---|---|
| Financial Services | 10 | $950B |
|
||
| Consumer Goods | 9 | $162B |
|
||
| Insurance | 4 | $225B |
|
||
| Telecommunications | 2 | $144B |
|
||
| Pharmaceuticals | 2 | $112B |
|
||
| Media / Entertainment | 2 | $69B |
|
||
Price history
+141.8% since first listed3 events — show timeline
- 2026-05-27 Listed $149,900 UNYREIS
- 2007-07-26 Sold (Public Records) $76,300 Public Records
- 1997-11-24 Sold (Public Records) $62,000 Public Records
Property tax history
+2.4%/yrLatest (2025): $1,477 · +0.0% YoY. Source: county tax records.
Cash-flow waterfall
monthlySold comps — $/sqft
last 12 mo · ≤1 miLoading sold comps…