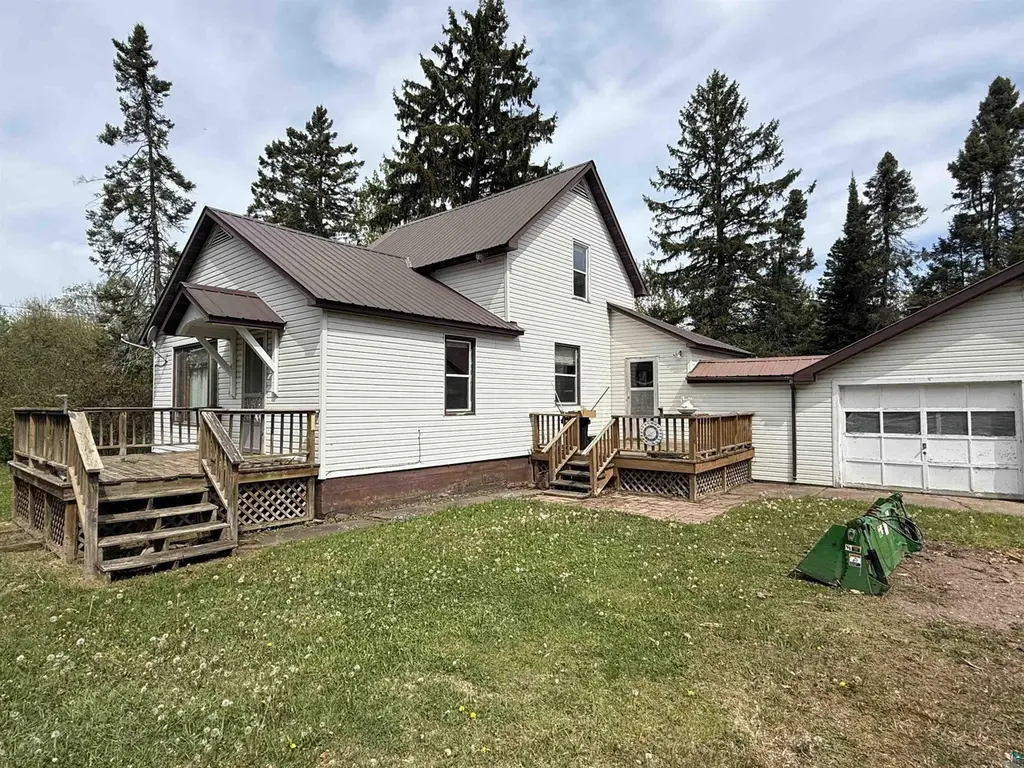
9170 School Rd · Port Wing, WI
Flood risk 1/10 · Minimal
- FEMA flood zone
- X (unshaded)
- Chance of flooding over 30 yrs
- 0.0%
- Est. flood insurance / yr
- $473 – $860
Fire risk 3/10 · Minor
- Est. fire insurance / yr
- $636 – $1,182
Heat risk 1/10 · Minimal
- Hot days now (above 95°F)
- 7 days/yr
- Hot days in 30 yrs
- 14 days/yr
Wind risk 1/10 · Minimal
- Chance of severe wind over 30 yrs
- —
Air-quality risk 1/10 · Minimal
- Unhealthy air days now
- 0 days/yr
- Unhealthy air days in 30 yrs
- 0 days/yr
Risk factors via First Street. Map © Google.
Why this score? — see what drove the D grade
The composite is a weighted blend of 9 inputs, each scored 0–100. Each bar is that input's sub-score; the figure is the points it added to the 100-point composite (weight × sub-score).
- Cash flow +10.7/30.0
- ARV discount +6.4/15.0
- Appreciation +5.9/10.0
- Schools +3.8/10.0
- Livability +3.3/5.0
- DSCR +3.1/10.0
- 1% rule +2.7/10.0
- Rent growth +2.5/5.0
- Condition / age +2.5/5.0
$139,000
🖨 Deal sheet 📄 Offer letter ✓ Due diligence
Listing remarks MLS
This 3 bedroom home with large kitchen and living areas, a main floor bedroom, basement, large garage and storage container on a large lot across the street from the school and just down the road for the marina and Lake Superior.
Key facts
- Large garage
- Large lot
- Large kitchen
Tags
Property features AI
Finance
- Financial info: Annual tax amount listed
Exterior
- Parking: Detached 2-car garage
- Utilities: Public water; Sewer and power details not provided
- Home design: Single family detached residence; Single-story
- Construction: Year built not provided; Construction materials not provided; Foundation details not provided
- Exterior features: Metal roof; Lot dimensions approximately 120 x 250; Lot about 0.74 acre; Residential zoning
Interior
- Kitchen: Range; Refrigerator; Dishwasher not listed
- Bedrooms: Master bedroom on main level
- Bathrooms: 1 full bathroom
- Heating & cooling: Central air conditioning; Forced air heating
- Interior features: Master bedroom on main level; Partial, unfinished basement
- Laundry & utility: Washer; Dryer
Neighborhood map
What this means for you Summary
Snapshot
- This is a 3-bed/1.0-bath single-family listed at $139k.
Deal economics
- At list price, monthly cash flow is $-66 ($-787/yr) — negative.
- To cash-flow at today's rent, offer at most $127k (8.3% below list).
- To meet the 1% rule (rent ≥ 1% of price), the offer needs to be $107k (23.2% below list).
- Recommended offer: $107k (23.2% below list) — sets the bar for 1% rule.
Location & tenants
- Location reads 66/100 on livability (#482 in WI) — a middle-class / working-renter tenant base. Strengths: cost of living A+, housing A; Watch: health & safety D, amenities F, commute F.
- South Shore School District (rural): math 35% / reading 50% proficiency, ranked #220 of 426 in WI (top 52%) — families likely to look elsewhere, expect single-tenant / working-renter base with shorter leases.
- Market conditions: 15 active listings in the ZIP; 106 units permitted in Bayfield County in 2024 (0 in 5+ unit buildings).
Forward outlook
- In year one you build about $4k of equity ($961 loan paydown + $3k appreciation (1.8% local appreciation)).
- Bayfield County population projected at -13% by 2050 — secular population decline; favor cash flow + early exit over multi-decade hold.
- At projected returns (1.8% appreciation + 3.0% rent growth), your $39k cash investment doubles in ~9 years — after that, you're playing with house money.
- By year 9, paydown + projected appreciation supports a ~$31k cash-out refi (75% LTV) — recoverable capital for the next deal without selling this one.
Negotiation context
- It's been on market 16 days — a 2% lower offer ($137k) is reasonable based on typical stale-listing flexibility.
- 2 sale attempts with the ask held roughly flat each time — persistent listings suggest the price (not the market) is what's stuck; bring a comps-based counter.
Risks & watch-outs
- Watch-outs: built in 1900 — expect roof / HVAC / electrical / plumbing capex.
Questions for the listing agent
- What do current leases actually rent for vs. the listed asking? Can we see a recent rent roll and the last 12 months of T-12 income?
- Built in 1900 — when were the roof, HVAC, electrical panel, plumbing, and water heater last replaced?
- Is there a deadline driving the sale (1031 exchange, divorce, estate, relocation)? That informs how much negotiation room exists.
- The area grade is low — what's the realistic commute time and amenity access for the typical tenant pool here? Any planned neighborhood developments (good or bad) we should know about?
- What's the average days-on-market for RENTAL listings here right now (not sales)? A rising rental-DOM trend means longer vacancies and softer asking-rent achievability than the comps imply.
- What's the recent tenant-quality profile in this submarket — average credit score on applications, eviction rate, late-payment / NSF rate, and stable-employment percentage? A property-management company in the area should have these aggregated.
- How much new for-sale + rental construction is in the pipeline within 1–3 miles? Heavy new supply typically softens prices + rents 12–24 months out; constrained supply supports both.
Investment metrics
- 1% rule
- 0.77% ✗
- Cap rate
- 5.73%
- Cash-on-cash
- -2.02%
- DSCR
- 0.91
- GRM
- 10.8
CMA / ARV
- ARV (on-the-fly)
- $135,720
- Comps found
- 1
Show comp detail 1 sale within ~0.75 mi
| Address | Dist | Beds/Ba | Sqft | Sold | Price | $/sf | Match |
|---|---|---|---|---|---|---|---|
| 83185 Washington Ave | 0.34mi | 2/1.0 (-1) | 1,200 (+3%) | 6mo | $140,000 | $117 | 68 |
Match score weights: distance 35% · size 25% · config 20% · recency 20%. Top-matched comps best support the ARV.
Projected returns pro-forma
1.84% appreciation · 3.0% rent growth · sell at horizon
- IRR
- 2.0%
- Equity multiple
- 1.11×
- Total profit
- $4,241
- Equity at exit
- $53,658
- IRR
- 6.1%
- Equity multiple
- 1.82×
- Total profit
- $31,797
- Equity at exit
- $76,381
Cash invested: $38,920 (down + closing). Projections, not guarantees.
Landlord ↔ Tenant lean methodology
- Overall (STATE)
- 73 Landlord-Friendly
- State Wisconsin
- 73 Landlord-Friendly · R+2
- County
- — inherits STATE
- City
- — inherits STATE
ZIP-level market 54865
- Home prices YoY
- 1.7%
- Active inventory
- 15
- Price-to-rent
- 10.8×
Monthly cashflow live
- Estimated rent
- $1,068 medium interval (Pro) →
- Mortgage (P&I)
- −$729
- Tax from tax record
- −$123 /mo · $1,471/yr
- Insurance
- −$58
- HOA
- −$0
- Vacancy / Maint / Mgmt
- −$224
- Net cashflow
- $-66
Break-even live
UW: 25.0% down · 7.5% · 30yr · 1.5% tax · 5.0% vac · 8.0% maint · 8.0% mgmt
Financing live
Cash to close
- Down payment
- $34,750
- Closing costs
- $4,170
- Reserves months
- —
- Total cash needed
- —
Loan-product check · same deal, 3 products live
Conventional
25% down · 7.5% · 30yr
- Down + closing
- —
- Monthly P&I
- —
- Monthly cashflow
- —
- DSCR
- —
- Eligible?
- —
Personal DTI + credit; lowest rate.
DSCR
20% down · 8.5% · 30yr
- Down + closing
- —
- Monthly P&I
- —
- Monthly cashflow
- —
- DSCR
- —
- Eligible?
- —
No personal income docs; deal must DSCR.
Hard money
10% down · 12.0% · 12mo
- Down + closing
- —
- Monthly P&I
- —
- Monthly cashflow
- —
- DSCR
- —
- Eligible?
- —
Short-term bridge; refi at stabilization.
Listing history 16 events
-
2026-06-18days on market $139,000 Active 16 DOM
-
2026-06-17days on market $139,000 Active 15 DOM
-
2026-06-16days on market $139,000 Active 14 DOM
-
2026-06-15days on market $139,000 Active 13 DOM
-
2026-06-15days on market $139,000 Active 12 DOM
-
2026-06-13days on market $139,000 Active 11 DOM
-
2026-06-12days on market $139,000 Active 10 DOM
-
2026-06-09days on market $139,000 Active 7 DOM
-
2026-06-08days on market $139,000 Active 6 DOM
-
2026-06-08days on market $139,000 Active 5 DOM
-
2026-06-05days on market $139,000 Active 3 DOM
-
2026-06-04days on market $139,000 Active 2 DOM
-
2026-06-02$139,000 Active 1 DOM
-
2026-06-02$139,000 Active 1 DOM
-
2026-05-31remarks 229-char remark
-
2026-05-31$139,000 Active 1 DOM
ⓘ Source: listings_history table (triggers on properties + properties_extension) + one-shot
backfill from property_details.listing_events for pre-trigger history.
Tax reassessment forecast WI · Partial reset (capped growth)
- Current annual tax
- $1,471 · $123/mo
- Projected year-2 tax
- $2,021 · $168/mo
- Expected delta
- +$550/yr (+$46/mo · 37.4%)
ⓘ Screening estimate from a state-policy table — verify with the county assessor before closing.
Climate risk First Street
- Flood 1/10 Low FEMA zone X (unshaded) · 0% chance over 30 yrs
- Wildfire 3/10 Moderate
- Heat 1/10 Low 7 d/yr ≥95°F today · 14 d/yr by 30 yrs out
- Wind 1/10 Low
- Air quality 1/10 Low 0 unhealthy d/yr today · 0 by 30 yrs out
Nearby sold comps map
Loading sold comps map…
Walkable amenities ~0.75 mi
Loading nearby amenities…
Taxation est. · year 1
- Rental income
- $12,818
- − Mortgage interest
- −$7,786
- − Property taxes
- −$1,471
- − Insurance
- −$695
- − Repairs & maintenance
- −$1,025
- − Management
- −$1,025
- − Depreciation
- −$4,044
- Taxable loss
- −$3,229
- Est. tax savings @ 24.0%
- +$775
- After-tax cash flow
- $-12/yr
For passive investors: Depreciation is non-cash, so a rental often shows a tax loss while cash-flowing — sheltering income. Rental losses are passive: they offset passive income freely, and up to $25,000/yr can offset ordinary (W-2) income if you actively participate and your MAGI is under $100k (phasing out to $0 by $150k); unused losses carry forward. On sale, claimed depreciation is recaptured at up to 25%, and gains may owe capital-gains tax (a 1031 exchange can defer both). Figures are a year-1 estimate at your 24.0% rate — not tax advice; consult a CPA.
Schools (NCES district)
- District
- South Shore School District
- NCES district ID
- 5512030
- Math proficiency
- 35% ▼ -10.00%
- Reading proficiency
- 50% ▬ 0.00%
- Median HH income
- $45,244
- Composite
- 38.41/100
- National rank
- #8513
- State rank
- #220 of 426 in WI
Livability — Port Wing
- Score
- 66/100
- State rank
- #482
- US rank
- #12227
Category grades
Schools grade is shown separately in the Schools card above.
Census & demographics
- Census place
- Port Wing, WI
- Population (ZIP)
- 492
Population outlook (Bayfield County) Hauer SSP2
- Today (2025)
- 14,698 people
- By 2030
- 14,481 · -1.5%
- By 2040
- 13,709 · -6.7%
- By 2050
- 12,777 · -13.1%
- By 2075
- 11,550 · -21.4%
- By 2100
- 9,908 · -32.6%
Race, ethnicity, and origin ACS 2023
- Neighborhood character
- Predominantly White (92%)
- Race & ethnicity
- White 92% Two or more races 6% Black 1% Hispanic / Latino 1% Native American 1%
- Common ancestry
- Portuguese 18% Italian 3% Romanian 3%
- Foreign-born
- 0% · Canada
- Languages at home
- 99% English-only · Spanish 1%
Political lean MEDSL · Bayfield
- 2024 margin
- D (+11.1) · D 54.5% · R 43.4% · Other 2.1%
- 2008→2024 swing
- -16.4pp toward R · 2008: 27.5pp · 2024: 11.1pp
- All cycles
- 2024: D+11.1 2020: D+14.1 2016: D+8.7 2012: D+24.9 2008: D+27.5
Not yet ingested
- Civics
- —
Market trends
- HPI YoY
- ▲ 1.84%
- Current HPI
- 108.9651
- Rent YoY
- —
- Metro
- —
- State GDP YoY
- ▲ 2.10%
- F500 in state
- 20
Industry mix (Fortune 500 HQ in WI)
| Industry | F500 HQs | Revenue |
|---|---|---|
| Industrial Machinery | 4 | $23B |
|
||
| Industrial Technology | 2 | $36B |
|
||
| Insurance | 1 | $36B |
|
||
| Professional Services | 1 | $19B |
|
||
| Utilities | 1 | $9B |
|
||
| Consumer Goods | 1 | $3B |
|
||
Price history
+0.0% since first listed2 events — show timeline
- 2026-05-30 Listed $139,000 LSAR
- 2026-05-30 Listed $139,000 SAAR
Property tax history
+5.7%/yrLatest (2024): $1,471 · +28.5% YoY. Source: county tax records.
Cash-flow waterfall
monthlySold comps — $/sqft
last 12 mo · ≤1 miLoading sold comps…