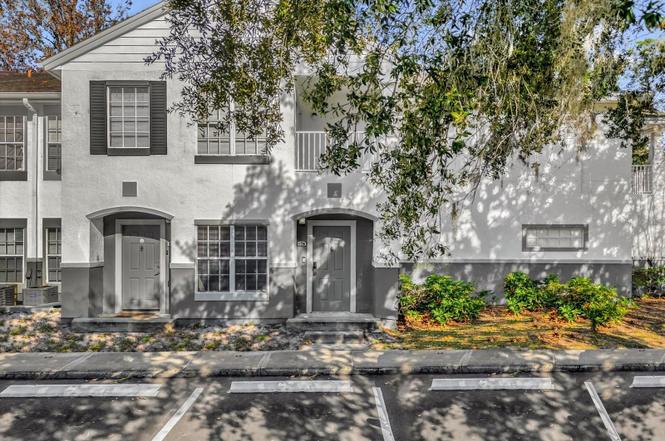
4316 S Kirkman Rd #1611 · Orlando, FL
Flood risk 1/10 · Minimal
- FEMA flood zone
- X (unshaded)
- Chance of flooding over 30 yrs
- 0.0%
- Est. flood insurance / yr
- $507 – $1,088
Fire risk 2/10 · Minimal
- Est. fire insurance / yr
- $947 – $1,759
Heat risk 9/10 · Severe
- Hot days now (above 108°F)
- 7 days/yr
- Hot days in 30 yrs
- 23 days/yr
Wind risk 9/10 · Severe
- Chance of severe wind over 30 yrs
- 99.0%
Air-quality risk 1/10 · Minimal
- Unhealthy air days now
- 0 days/yr
- Unhealthy air days in 30 yrs
- 0 days/yr
Risk factors via First Street. Map © Google.
Why this score? — see what drove the C- grade
The composite is a weighted blend of 9 inputs, each scored 0–100. Each bar is that input's sub-score; the figure is the points it added to the 100-point composite (weight × sub-score).
- Cash flow +16.6/30.0
- 1% rule +7.7/10.0
- ARV discount +7.5/15.0
- DSCR +5.1/10.0
- Livability +4.3/5.0
- Schools +4.1/10.0
- Rent growth +2.5/5.0
- Condition / age +2.5/5.0
- Appreciation +0.0/10.0
$130,000
🖨 Deal sheet 📄 Offer letter ✓ Due diligence
Listing remarks
Spacious first-floor one-bedroom condo for sale in the gated Sunset Lake community. This move-in-ready condo features an open floor plan with a bright living room, dining nook, and kitchen with indoor laundry. The primary bedroom offers a walk-in closet and convenient access to a separate guest bathroom. Assigned parking along with visitor parking and community mailboxes are located directly in front of the unit. Sunset Lake offers resort-style amenities including a community dock overlooking Turkey Lake, swimming pool, playground, clubhouse, and on-site fitness center. Conveniently located near shopping, dining and major roadways, this condo is ideal for homeowners or investors seeking low
Key facts
- Open floor plan
- Walk-in closet
- Swimming pool
Tags
Neighborhood map
What this means for you Summary
Snapshot
- This is a 1-bed/1.0-bath condo listed at $130k.
Deal economics
- At list price, monthly cash flow is $77 ($929/yr) — positive.
- The deal already cash-flows at list — no discount required.
- Meets the 1% rule at list price ($2k rent vs $130k).
- Recommended offer: $122k (6.0% below list) — sets the bar for market timing.
- Cap rate 7.0% vs local median 3.0% in Orlando — top-decile yield for the area; either an underpriced asset or a hidden risk that comps aren't pricing in. Stress-test before assuming the spread holds.
Location & tenants
- Location reads 86/100 on livability (#12 in FL, #360 nationally) — a professional / high-income tenant draw. Strengths: amenities A+, commute A+, housing A+.
- Orange (suburban): math 46% / reading 51% proficiency, ranked #43 of 73 in FL (top 59%) — families likely to look elsewhere, expect single-tenant / working-renter base with shorter leases.
- Zoned schools: Windy Ridge K-8 (math 68% / reading 68%, grade B+, #425 of 2,144 statewide, top 20%, 1,173 students, 41% FRL); Olympia High (math 24% / reading 52%, grade F, #328 of 667 statewide, top 50%, 2,969 students, 47% FRL).
- Market conditions: Rents flat; 238 active listings in the ZIP; 40 comparable units currently listed for rent nearby; rentals at typical pace (median 15d on market — plan ~3-4 weeks tenant-placement turnaround); 8,053 units permitted in Orange County in 2024 (3,133 in 5+ unit buildings).
- This rent runs 37% of the median local income ($54k/yr) — at the standard rent-burdened threshold; future hikes will face affordability resistance.
Forward outlook
- Local home prices are declining (-3.0%/yr); year-one equity from $899 of loan paydown is wiped out by about $4k of value loss. Plan a longer hold.
- Orange County population projected at +52% by 2050 — long-run rental-demand tailwind backs the buy-and-hold thesis.
Negotiation context
- It's been on market 89 days — a 6% lower offer ($122k) is reasonable based on typical stale-listing flexibility.
- 2 sale attempts; this cycle's ask has dropped $10k (7%) from the opening price — seller is motivated, your offer sets the floor, not the list.
Risks & watch-outs
- Watch-outs: HOA is 21% of rent.
- Climate carrying-cost: severe wind risk, 99% chance of damaging wind over 30y; extreme-heat days projected 7→23/yr by 2055 (HVAC capex compounding) — expect insurance premiums to compound above CPI over the hold.
Questions for the listing agent
- It's been on market 89 days. Have you received any prior offers? Is the seller open to a 6% concession, seller financing, or rate buy-down credit?
- What does the HOA fee cover, when was the last increase, and are there any pending special assessments or reserve-fund shortfalls?
- Any open or pending special assessments — roof, HVAC, plumbing, elevator, façade? What's the per-unit balance and payoff schedule, and is the seller paying it off at close or rolling it to the buyer?
- Why hasn't it sold? Are there any deal-killer items the seller is aware of (foundation, flood, title, zoning, code violations)?
- Is there a deadline driving the sale (1031 exchange, divorce, estate, relocation)? That informs how much negotiation room exists.
- Schools are B-rated — typically a magnet for longer-tenancy family renters. What's the average tenant stay here, and is there a school-zone premium baked into asking?
- What's the average days-on-market for RENTAL listings here right now (not sales)? A rising rental-DOM trend means longer vacancies and softer asking-rent achievability than the comps imply.
- What's the recent tenant-quality profile in this submarket — average credit score on applications, eviction rate, late-payment / NSF rate, and stable-employment percentage? A property-management company in the area should have these aggregated.
- How much new apartment / multifamily construction is in the pipeline within 1–3 miles? Heavy new supply (>2% of stock underway) typically softens rents 12–24 months out; light construction supports rent growth.
Investment metrics
- 1% rule
- 1.27% ✓
- Cap rate
- 7.01%
- Cash-on-cash
- 2.55%
- DSCR
- 1.11
- GRM
- 6.6
CMA / ARV
No comps found within radius.
Projected returns pro-forma
-3.0% appreciation · 0.15% rent growth · sell at horizon
- IRR
- -16.5%
- Equity multiple
- 0.44×
- Total profit
- $-20,504
- Equity at exit
- $19,383
- IRR
- -17.1%
- Equity multiple
- 0.22×
- Total profit
- $-28,392
- Equity at exit
- $11,240
Cash invested: $36,400 (down + closing). Projections, not guarantees.
Landlord ↔ Tenant lean methodology
- Overall (STATE)
- 87 Strongly Landlord-Friendly
- State Florida
- 87 Strongly Landlord-Friendly · R+3
- County
- — inherits STATE
- City
- — inherits STATE
ZIP-level market 32811
- Home prices YoY
- -33.8%
- Rents YoY
- 0.1%
- Active inventory
- 238
- Price-to-rent
- 6.6×
Monthly cashflow live
- Estimated rent
- $1,647 high interval (Pro) →
- Mortgage (P&I)
- −$682
- Tax from tax record
- −$141 /mo · $1,688/yr
- Insurance
- −$54
- HOA
- −$347
- Vacancy / Maint / Mgmt
- −$346
- Net cashflow
- $77
Break-even live
UW: 25.0% down · 7.5% · 30yr · 1.5% tax · 5.0% vac · 8.0% maint · 8.0% mgmt
Financing live
Cash to close
- Down payment
- $32,500
- Closing costs
- $3,900
- Reserves months
- —
- Total cash needed
- —
Loan-product check · same deal, 3 products live
Conventional
25% down · 7.5% · 30yr
- Down + closing
- —
- Monthly P&I
- —
- Monthly cashflow
- —
- DSCR
- —
- Eligible?
- —
Personal DTI + credit; lowest rate.
DSCR
20% down · 8.5% · 30yr
- Down + closing
- —
- Monthly P&I
- —
- Monthly cashflow
- —
- DSCR
- —
- Eligible?
- —
No personal income docs; deal must DSCR.
Hard money
10% down · 12.0% · 12mo
- Down + closing
- —
- Monthly P&I
- —
- Monthly cashflow
- —
- DSCR
- —
- Eligible?
- —
Short-term bridge; refi at stabilization.
Rent comps 40 comps
| Address | Beds | Baths | Sqft | Rent | $/sqft | DOM | Units | Dist |
|---|---|---|---|---|---|---|---|---|
| 4324 S Kirkman Rd Orlando, FL | 1.0 | 1.0 | 730 | $2,700 | $3.70 | 24d | 1 | 0.05mi |
| 4352 S Kirkman Rd Orlando, FL | 1.0–2.0 | 1.0–2.0 | 964 | $1,365 | $1.42 | 2d | 2 | 0.07mi |
| 4368 S Kirkman Rd Orlando, FL | 1.0 | 1.0 | 730 | $2,700 | $3.70 | 24d | 1 | 0.09mi |
| 4368 S Kirkman Rd Orlando, FL | 1.0–2.0 | 1.0–2.0 | 863 | $1,700 | $1.97 | 14d | 2 | 0.09mi |
| 4332 S Kirkman Rd #1003 Orlando, FL | 1.0 | 1.0 | 729 | $1,350 | $1.85 | 3d | 1 | 0.10mi |
| 6025 Oakshadow St Orlando, FL | 1.0–3.0 | 1.0–2.0 | 949 | $1,221 | $1.29 | 2d | 64 | 0.33mi |
| 4601 S Kirkman Rd Orlando, FL | 1.0 | 1.0 | 550 | $1,124 | $2.04 | 3d | 3 | 0.36mi |
| 4618 Middlebrook Rd Orlando, FL | 2.0 | 1.0–2.0 | 710 | $1,499 | $2.11 | 2d | 28 | 0.51mi |
| 6421 Conroy Rd Orlando, FL | 1.0–2.0 | 1.0–2.0 | 847 | $1,304 | $1.54 | 2d | 21 | 0.63mi |
| 5109 Eaglesmere Dr Unit 11A Orlando, FL | 1.0 | 1.0 | 591 | $1,350 | $2.28 | 15d | 1 | 0.75mi |
| 4860 Cypress Woods Dr Orlando, FL | 1.0–2.0 | 1.0–2.0 | 786 | $1,099 | $1.40 | 3d | 18 | 0.78mi |
| 4000 Middlebrook Rd Orlando, FL | 1.0–3.0 | 1.0–2.0 | 979 | $1,199 | $1.22 | 7d | 27 | 0.80mi |
| 5112 Conroy Rd #315 Orlando, FL | 1.0 | 1.0 | 711 | $1,250 | $1.76 | 11d | 1 | 0.87mi |
| 6435 Manhattan Village Ave #205 Orlando, FL | 1.0 | 1.0 | 680 | $1,340 | $1.97 | 4d | 1 | 0.87mi |
| 5120 Conroy Rd Orlando, FL | 1.0–2.0 | 1.0–2.0 | 849 | $1,250 | $1.47 | 15d | 1 | 0.93mi |
| 5578 Metrowest Blvd Orlando, FL | 1.0 | 1.0 | 774 | $1,272 | $1.64 | 24d | 2 | 0.95mi |
| 5578 Metrowest Blvd Unit 1-302 Orlando, FL | 1.0 | 1.0 | 709 | $1,300 | $1.83 | 4d | 1 | 0.95mi |
| 5578 Metrowest Blvd Unit 1-211 Orlando, FL | 1.0 | 1.0 | 709 | $1,275 | $1.80 | 14d | 1 | 0.95mi |
| 5164 Conroy Rd Orlando, FL | 1.0 | 1.0 | 711 | $1,275 | $1.79 | 24d | 1 | 0.95mi |
| 5124 Conroy Rd Orlando, FL | 1.0–2.0 | 1.0–2.0 | 849 | $1,350 | $1.59 | 15d | 2 | 0.97mi |
| 5152 Conroy Rd Unit 1316 Orlando, FL | 1.0 | 1.0 | 597 | $1,250 | $2.09 | 16d | 1 | 0.99mi |
| 5128 Conroy Rd Unit 713HOA Orlando, FL | 1.0 | 1.0 | 597 | $1,350 | $2.26 | 3d | 1 | 1.01mi |
| 5974 Windhover Dr Orlando, FL | 1.0–2.0 | 1.0–2.0 | 800 | $1,099 | $1.37 | 2d | 9 | 1.04mi |
| 4822 Cason Cove Dr Orlando, FL | 1.0–3.0 | 1.0–2.0 | 884 | $1,349 | $1.53 | 2d | 9 | 1.05mi |
| 5587 Millennia Park Dr Unit 215 Orlando, FL | 1.0 | 1.0 | 750 | $1,700 | $2.27 | 24d | 1 | 1.05mi |
| 5587 Millennia Park Dr Orlando, FL | 1.0 | 1.0 | 750 | $1,595 | $2.13 | 18d | 1 | 1.05mi |
| 5587 Millennia Park Dr Unit 110 Orlando, FL | 1.0 | 1.0 | 750 | $1,900 | $2.53 | 24d | 1 | 1.05mi |
| 5579 Millennia Park Dr Unit 517 Orlando, FL | 1.0 | 1.0 | 750 | $1,790 | $2.39 | 14d | 1 | 1.05mi |
| 5587 Millennia Park Dr Unit 519 Orlando, FL | 1.0 | 1.0 | 750 | $1,800 | $2.40 | 24d | 1 | 1.05mi |
| 5579 Millennia Park Dr #403 Orlando, FL | 1.0 | 1.0 | 750 | $1,600 | $2.13 | 24d | 1 | 1.05mi |
| 5587 Millennia Park Dr Unit 515 Orlando, FL | 1.0 | 1.0 | 750 | $1,500 | $2.00 | 24d | 1 | 1.05mi |
| 5467 Vineland Rd #6214 Orlando, FL | 1.0 | 1.0 | 645 | $1,350 | $2.09 | 22d | 1 | 1.06mi |
| 5455 Vineland Rd #3214 Orlando, FL | 1.0 | 1.0 | 645 | $1,375 | $2.13 | 7d | 1 | 1.08mi |
| 4771 Walden Cir Orlando, FL | 2.0 | 1.0 | 798 | $1,474 | $1.85 | 3d | 12 | 1.12mi |
| 5475 Vineland Rd #8311 Orlando, FL | 1.0 | 1.0 | 734 | $1,500 | $2.04 | 24d | 1 | 1.12mi |
| 5451 Vineland Rd #2111 Orlando, FL | 1.0 | 1.0 | 734 | $1,295 | $1.76 | 18d | 1 | 1.13mi |
| 5451 Vineland Rd #2111 Orlando, FL | 1.0 | 1.0 | 734 | $1,295 | $1.76 | 22d | 1 | 1.13mi |
| 2674 Robert Trent Jones Dr Orlando, FL | 1.0–2.0 | 1.0–2.0 | 844 | $1,330 | $1.58 | 4d | 3 | 1.17mi |
| 2674 Robert Trent Jones Dr Orlando, FL | 1.0 | 1.0 | 674 | $1,415 | $2.10 | 24d | 2 | 1.17mi |
| 5447 Vineland Rd Orlando, FL | 1.0–3.0 | 1.0–2.0 | 983 | $1,650 | $1.68 | 4d | 3 | 1.19mi |
HOA detail condo
- Monthly dues
- $347 · $4,164/yr
- Likely covers
- poolgymsecurityparking
- Assessments
- None detected in remarks — confirm with the listing agent.
Listing history 12 events
-
2026-06-07status $130,000 Pending 89 DOM
-
2026-06-04days on market $130,000 Active 89 DOM
-
2026-06-03days on market $130,000 Active 88 DOM
-
2026-06-02days on market $130,000 Active 87 DOM
-
2026-06-02days on market $130,000 Active 86 DOM
-
2026-05-31days on market $130,000 Active 85 DOM
-
2026-04-08status Pending
-
2026-03-11price $130,000
-
2026-01-31status Active
-
2026-01-06status Pending
-
2025-12-23$140,000 Active
-
2022-03-17soldstatus $145,000
ⓘ Source: listings_history table (triggers on properties + properties_extension) + one-shot
backfill from property_details.listing_events for pre-trigger history.
Tax reassessment forecast FL · Resets to sale price
- Current annual tax
- $1,688 · $141/mo
- Projected year-2 tax
- $1,688 · $141/mo
- Expected delta
- $0/yr ($0/mo · 0.0%)
ⓘ Screening estimate from a state-policy table — verify with the county assessor before closing.
Climate risk First Street
- Flood 1/10 Low FEMA zone X (unshaded) · 0% chance over 30 yrs
- Wildfire 2/10 Low
- Heat 9/10 Extreme 7 d/yr ≥108°F today · 23 d/yr by 30 yrs out
- Wind 9/10 Extreme 99% chance of damaging wind over 30 yrs
- Air quality 1/10 Low 0 unhealthy d/yr today · 0 by 30 yrs out
Nearby sold comps map
Loading sold comps map…
Walkable amenities ~0.75 mi
Loading nearby amenities…
Taxation est. · year 1
- Rental income
- $19,762
- − Mortgage interest
- −$7,282
- − Property taxes
- −$1,688
- − Insurance
- −$650
- − Repairs & maintenance
- −$1,581
- − Management
- −$1,581
- − HOA
- −$4,164
- − Depreciation
- −$3,782
- Taxable loss
- −$966
- Est. tax savings @ 24.0%
- +$232
- After-tax cash flow
- $1,161/yr
For passive investors: Depreciation is non-cash, so a rental often shows a tax loss while cash-flowing — sheltering income. Rental losses are passive: they offset passive income freely, and up to $25,000/yr can offset ordinary (W-2) income if you actively participate and your MAGI is under $100k (phasing out to $0 by $150k); unused losses carry forward. On sale, claimed depreciation is recaptured at up to 25%, and gains may owe capital-gains tax (a 1031 exchange can defer both). Figures are a year-1 estimate at your 24.0% rate — not tax advice; consult a CPA.
Schools (NCES district)
- District
- Orange
- NCES district ID
- 1201440
- Math proficiency
- 46% ▼ -9.00%
- Reading proficiency
- 51% ▼ -2.00%
- Median HH income
- $49,350
- Composite
- 41.47/100
- National rank
- #3461
- State rank
- #43 of 73 in FL
Livability — Orlando
- Score
- 86/100
- State rank
- #12
- US rank
- #360
Category grades
Schools grade is shown separately in the Schools card above.
Census & demographics
- Census place
- Orlando, FL
- County
- Orange County · 1,471,359 people
- City population
- 964,969
- Metro
- Orlando-Kissimmee-Sanford, FL
- Population (ZIP)
- 41,475
- Household income
- $54,082
- Rent vs Own
- Severe rent burden
- 2728.0
Population outlook (Orange County) Hauer SSP2
- Today (2025)
- 1,618,226 people
- By 2030
- 1,787,404 · +10.5%
- By 2040
- 2,125,621 · +31.4%
- By 2050
- 2,454,016 · +51.6%
- By 2075
- 3,173,711 · +96.1%
- By 2100
- 3,607,781 · +122.9%
Race, ethnicity, and origin ACS 2023
- Neighborhood character
- Diverse neighborhood (Simpson 0.66)
- Race & ethnicity
- Black 50% Hispanic / Latino 27% Two or more races 17% White 12% Asian 2%
- Hispanic origin (detail)
- Mexican 2% Puerto Rican 8% Dominican 2%
- Common ancestry
- Hispanic 7% Estonian 4% Russian 1%
- Foreign-born
- 31% · Canada, Jamaica, China
- Languages at home
- 62% English-only · Spanish 21% French/Haitian/Cajun 8% Other Indo-European 6%
Political lean MEDSL · Orange
- 2024 margin
- D (+13.6) · D 56.1% · R 42.5% · Other 1.3%
- 2008→2024 swing
- -5.0pp toward R · 2008: 18.6pp · 2024: 13.6pp
- All cycles
- 2024: D+13.6 2020: D+23.1 2016: D+24.6 2012: D+18.2 2008: D+18.6
Not yet ingested
- Civics
- —
Market trends
- HPI YoY
- ▼ -145.37%
- Current HPI
- 284.9191
- Rent YoY
- ▲ 0.15%
- Metro
- Orlando-Kissimmee-Sanford, FL
- State GDP YoY
- ▲ 3.28%
- F500 in state
- 36
Industry mix (Fortune 500 HQ in FL)
| Industry | F500 HQs | Revenue |
|---|---|---|
| Industrial Technology | 2 | $29B |
|
||
| Insurance | 2 | $17B |
|
||
| Retail | 1 | $60B |
|
||
| Technology Distribution | 1 | $58B |
|
||
| Homebuilding | 1 | $35B |
|
||
| Technology Manufacturing | 1 | $35B |
|
||
Price history
-10.3% since first listed6 events — show timeline
- 2026-04-08 Pending — Stellar MLS as Distributed by MLS Grid
- 2026-03-11 Price Changed $130,000 Stellar MLS as Distributed by MLS Grid
- 2026-01-31 Relisted — Stellar MLS as Distributed by MLS Grid
- 2026-01-06 Pending — Stellar MLS as Distributed by MLS Grid
- 2025-12-23 Listed $140,000 Stellar MLS as Distributed by MLS Grid
- 2022-03-17 Sold (Public Records) $145,000 Public Records
Property tax history
+7.9%/yrLatest (2025): $1,688 · +456.5% YoY. Source: county tax records.
Cash-flow waterfall
monthlySold comps — $/sqft
last 12 mo · ≤1 miLoading sold comps…