 Triplex
738 Natoma St · San Francisco, CA
Flood risk 1/10 · Minimal
- FEMA flood zone
- X (unshaded)
- Chance of flooding over 30 yrs
- 0.0%
- Est. flood insurance / yr
- $507 – $1,088
Fire risk 1/10 · Minimal
- Est. fire insurance / yr
- $659 – $1,223
Heat risk 3/10 · Minor
- Hot days now (above 79°F)
- 8 days/yr
- Hot days in 30 yrs
- 17 days/yr
Wind risk 1/10 · Minimal
- Chance of severe wind over 30 yrs
- —
Air-quality risk 8/10 · Major
- Unhealthy air days now
- 15 days/yr
- Unhealthy air days in 30 yrs
- 15 days/yr
Risk factors via First Street. Map © Google.
Why this score? — see what drove the B+ grade
The composite is a weighted blend of 9 inputs, each scored 0–100. Each bar is that input's sub-score; the figure is the points it added to the 100-point composite (weight × sub-score).
- Cash flow +28.7/30.0
- DSCR +10.0/10.0
- ARV discount +8.3/15.0
- 1% rule +8.0/10.0
- Appreciation +7.5/10.0
- Rent growth +5.0/5.0
- Schools +5.0/10.0
- Livability +3.8/5.0
- Condition / age +3.8/5.0
$1,300,000
🖨 Deal sheet 📄 Offer letter ✓ Due diligence
Multi-family units
County records classify this as Multi-Family (2-4 Unit). Listing-text estimate: 3 units. confirmed
Listing remarks MLS
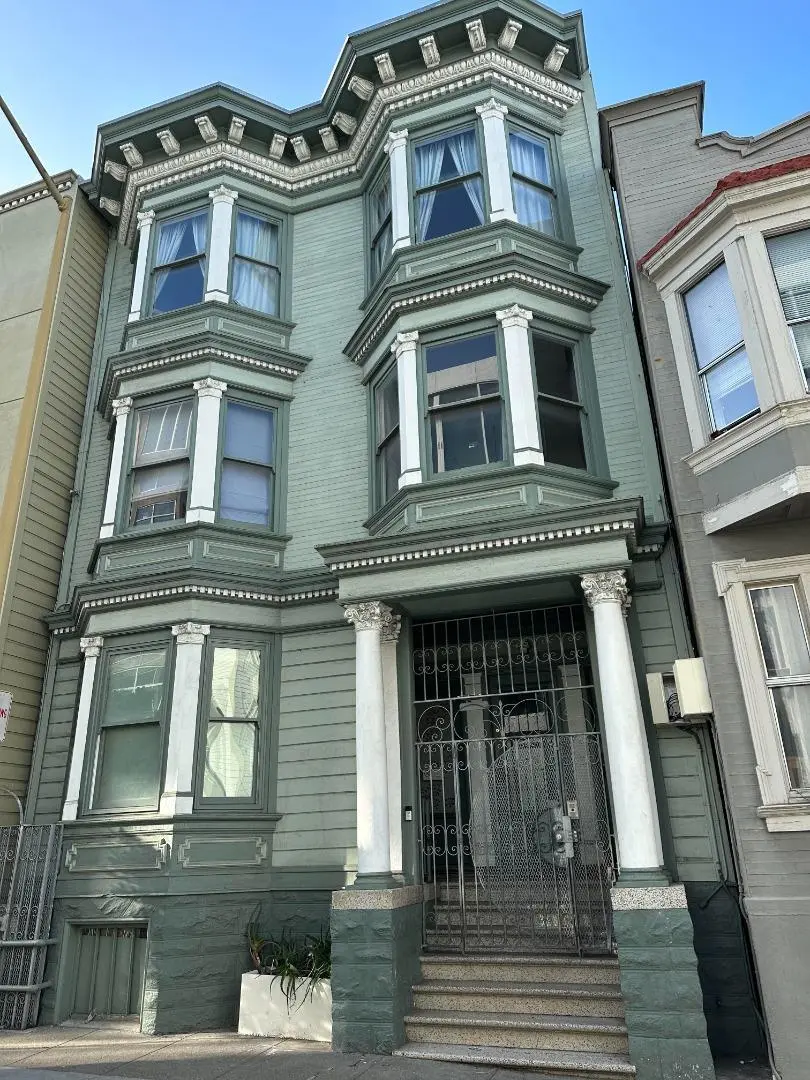
736 Natoma Street presents a rare opportunity to acquire a classic Victorian architecture triplex in the heart of South of Market (SoMa), one of San Francisco's most dynamic and evolving neighborhoods. Known for its proximity to major tech employers, transit hubs, and vibrant dining and nightlife, SoMa continues to attract a strong tenant base driven by convenience and urban lifestyle. Constructed in 1911, this well-maintained building features three spacious 2-bedroom, 1-bathroom units, each with similar, functional layouts. The property retains its original charm with period detailing throughout, including bay windows, decorative trim, formal dining rooms with built-ins, and traditional fireplaces features that continue to resonate with tenants seeking character alongside functionality. Recent capital improvements enhance the property's operational appeal, including new water heaters (2024), upgraded plumbing in select areas, a rebuilt lightwell with improved drainage, and updated kitchen and gas line improvements in select units. The property is separately metered for gas and electricity, allowing tenants to pay their own utilities and helping to minimize operating expenses.
Key facts
- Decorative trim
- Period detailing
- Bay windows
Tags
Property features AI
Finance
- Other: Living area reported as 4,120 (source: assessor)
- Financial info: Gross scheduled income: $59,853; Annual rental income: $59,853; Annual gross income: $57,459; Total expenses: $28,104; Gross rent multiplier: 21.72; Vacancy factor: 4%; Utility expenses: $4,620; Annual tax amount: $15,375
- HOA & community:
Exterior
- Parking: No garage; off-street parking available
- Security: Security features noted (see remarks)
- Utilities: Sewer connected; Individual electric meters; Individual gas meters; Water: other (see remarks)
- Home design: 3-story multifamily building; Single building on the lot
- Construction: Wood construction; Concrete perimeter and other foundation types; Built as a 3-unit building
- Exterior features: Roof noted as other (see remarks); Tenant pays electric and gas utilities
Interior
- Kitchen:
- Bedrooms: Three 2-bedroom units (one 2-bed unit per floor in the 3-story building)
- Flooring: Carpet; Hardwood; Other (see remarks)
- Bathrooms: Each unit has one full bathroom
- Heating & cooling: Wall furnace
- Interior features: Carpet and hardwood flooring with additional materials noted in remarks; Wall furnace heating
- Laundry & utility:
Neighborhood map
What this means for you Summary
Snapshot
- This is a 3 × 2-bed/1-bath units multifamily listed at $1.30M. Condition is rated good.
Deal economics
- At list price, monthly cash flow is $4k ($52k/yr) — positive. Per door: $1k/mo.
- The deal already cash-flows at list — no discount required.
- Meets the 1% rule at list price ($17k rent vs $1.30M).
- Recommended offer: $1.26M (3.0% below list) — sets the bar for market timing.
- Cap rate 10.3% vs local median 2.1% in San Francisco — top-decile yield for the area; either an underpriced asset or a hidden risk that comps aren't pricing in. Stress-test before assuming the spread holds.
Location & tenants
- Location reads 76/100 on livability (#90 in CA, #3,143 nationally) — a middle-class / working-renter tenant base. Strengths: amenities A+, commute A+, employment A+; Watch: crime F, cost of living F.
- San Francisco Unified (urban): math 50% / reading 56% proficiency, ranked #322 of 1,400 in CA (top 23%) — acceptable for families but not a draw, mixed tenant base, ~2y average lease.
- Market conditions: Rents rising fast (+15.5%/yr); 108 active listings in the ZIP; 1 comparable units currently listed for rent nearby; high-income renter base; 750 units permitted in San Francisco County in 2024 (688 in 5+ unit buildings).
- At $16,841/mo this rent would consume 174% of the median local household income ($116k/yr) (locally 2666% of renters already pay >50% of income on rent) — very limited rent-growth headroom before tenants either downsize or default.
Forward outlook
- In year one you build about $74k of equity ($9k loan paydown + $65k appreciation (5.0% local appreciation)).
- San Francisco County population projected at +39% by 2050 — long-run rental-demand tailwind backs the buy-and-hold thesis.
- At projected returns (5.0% appreciation + 8.0% rent growth), your $364k cash investment doubles in ~3 years — after that, you're playing with house money.
- By year 2, paydown + projected appreciation supports a ~$118k cash-out refi (75% LTV) — recoverable capital for the next deal without selling this one.
Negotiation context
- It's been on market 42 days — a 3% lower offer ($1.26M) is reasonable based on typical stale-listing flexibility.
- 4 sale attempts with the ask held roughly flat each time — persistent listings suggest the price (not the market) is what's stuck; bring a comps-based counter.
Risks & watch-outs
- Watch-outs: built in 1911 — expect roof / HVAC / electrical / plumbing capex.
Questions for the listing agent
- It's been on market 42 days. Have you received any prior offers? Is the seller open to a 3% concession, seller financing, or rate buy-down credit?
- Can we see the unit-by-unit rent roll, current vacancy, and any below-market leases? What's the average tenancy length?
- What capital expenditures (roof, boiler, parking lot, exteriors) have been made in the last 5 years, and what's planned in the next 2?
- Built in 1911 — when were the roof, HVAC, electrical panel, plumbing, and water heater last replaced?
- Is there a deadline driving the sale (1031 exchange, divorce, estate, relocation)? That informs how much negotiation room exists.
- Schools are B-rated — typically a magnet for longer-tenancy family renters. What's the average tenant stay here, and is there a school-zone premium baked into asking?
- Crime grade is F in this area — have there been break-ins, vandalism, or insurance claims at this property in the last 3 years? What carrier currently insures it and at what premium?
- What's the average days-on-market for RENTAL listings here right now (not sales)? A rising rental-DOM trend means longer vacancies and softer asking-rent achievability than the comps imply.
- What's the recent tenant-quality profile in this submarket — average credit score on applications, eviction rate, late-payment / NSF rate, and stable-employment percentage? A property-management company in the area should have these aggregated.
- How much new apartment / multifamily construction is in the pipeline within 1–3 miles? Heavy new supply (>2% of stock underway) typically softens rents 12–24 months out; light construction supports rent growth.
Investment metrics
- 1% rule
- 1.30% ✓
- Cap rate
- 10.28%
- Cash-on-cash
- 14.24%
- DSCR
- 1.63
- GRM
- 6.4
CMA / ARV
- ARV (median comp)
- $1,322,200
- List price
- $1,300,000
- Delta
- -1.68%
- Verdict
- FAIR
- Comps
- 20 within 1.0 mi
Show comp detail 2 sales within ~0.75 mi
| Address | Dist | Beds/Ba | Sqft | Sold | Price | $/sf | Match |
|---|---|---|---|---|---|---|---|
| 287-291 Page St | 0.71mi | 5/3.0 (-1) | 3,518 (-15%) | 0mo | $3,674,550 | $1,044 | 37 |
| 409-413 Tehama St | 0.55mi | 6/5.0 | 4,670 (+13%) | 12mo | $1,200,000 | $257 | 34 |
Match score weights: distance 35% · size 25% · config 20% · recency 20%. Top-matched comps best support the ARV.
Projected returns pro-forma
4.96% appreciation · 8.0% rent growth · sell at horizon
- IRR
- 28.2%
- Equity multiple
- 2.82×
- Total profit
- $661,271
- Equity at exit
- $733,733
- IRR
- 29.5%
- Equity multiple
- 6.43×
- Total profit
- $1,976,724
- Equity at exit
- $1,263,882
Cash invested: $364,000 (down + closing). Projections, not guarantees.
Landlord ↔ Tenant lean methodology
- Overall (CITY)
- 0 Strongly Tenant-Friendly
- State California
- 18 Strongly Tenant-Friendly · D+13
- County
- — inherits STATE
- City San Francisco
- 0 Strongly Tenant-Friendly · D+57
ZIP-level market 94103
- Home prices YoY
- 2.9%
- Rents YoY
- 15.5%
- Active inventory
- 108
- Price-to-rent
- 19.3×
Monthly cashflow live
- Estimated rent
- $16,841 high interval (Pro) →
- Mortgage (P&I)
- −$6,817
- Tax est. 1.5%
- −$1,625 /mo · $19,500/yr
- Insurance
- −$542
- HOA
- −$0
- Vacancy / Maint / Mgmt
- −$3,537
- Net cashflow
- $4,320
Break-even live
3-unit breakdown (identical units grouped — click to expand)
| Units | Beds | Baths | Est. rent |
|---|---|---|---|
| 3× units | 2 | 1 | $16,842 |
| #1 | 2 | 1 | $5,614 |
| #2 | 2 | 1 | $5,614 |
| #3 | 2 | 1 | $5,614 |
| Total (3 units) | $16,841 | ||
UW: 25.0% down · 7.5% · 30yr · 1.5% tax · 5.0% vac · 8.0% maint · 8.0% mgmt
Financing live
Cash to close
- Down payment
- $325,000
- Closing costs
- $39,000
- Reserves months
- —
- Total cash needed
- —
Loan-product check · same deal, 3 products live
Conventional
25% down · 7.5% · 30yr
- Down + closing
- —
- Monthly P&I
- —
- Monthly cashflow
- —
- DSCR
- —
- Eligible?
- —
Personal DTI + credit; lowest rate.
DSCR
20% down · 8.5% · 30yr
- Down + closing
- —
- Monthly P&I
- —
- Monthly cashflow
- —
- DSCR
- —
- Eligible?
- —
No personal income docs; deal must DSCR.
Hard money
10% down · 12.0% · 12mo
- Down + closing
- —
- Monthly P&I
- —
- Monthly cashflow
- —
- DSCR
- —
- Eligible?
- —
Short-term bridge; refi at stabilization.
Rent comps 1 comps
| Address | Beds | Baths | Sqft | Rent | $/sqft | DOM | Units | Dist |
|---|---|---|---|---|---|---|---|---|
| — San Francisco, CA | 5.0 | 4.5 | 3100 | $29,990 | $9.67 | 7d | 1 | 1.37mi |
Listing history 12 events
-
2026-06-18days on market $1,300,000 Active 42 DOM
-
2026-06-17days on market $1,300,000 Active 41 DOM
-
2026-06-16days on market $1,300,000 Active 40 DOM
-
2026-06-15days on market $1,300,000 Active 39 DOM
-
2026-06-13days on market $1,300,000 Active 37 DOM
-
2026-06-13days on market $1,300,000 Active 36 DOM
-
2026-06-09days on market $1,300,000 Active 33 DOM
-
2026-06-08days on market $1,300,000 Active 32 DOM
-
2026-06-07days on market $1,300,000 Active 31 DOM
-
2026-06-04days on market $1,300,000 Active 28 DOM
Show marketing remark (1196 chars)
736 Natoma Street presents a rare opportunity to acquire a classic Victorian architecture triplex in the heart of South of Market (SoMa), one of San Francisco's most dynamic and evolving neighborhoods. Known for its proximity to major tech employers, transit hubs, and vibrant dining and nightlife, SoMa continues to attract a strong tenant base driven by convenience and urban lifestyle. Constructed in 1911, this well-maintained building features three spacious 2-bedroom, 1-bathroom units, each with similar, functional layouts. The property retains its original charm with period detailing throughout, including bay windows, decorative trim, formal dining rooms with built-ins, and traditional fireplaces features that continue to resonate with tenants seeking character alongside functionality. Recent capital improvements enhance the property's operational appeal, including new water heaters (2024), upgraded plumbing in select areas, a rebuilt lightwell with improved drainage, and updated kitchen and gas line improvements in select units. The property is separately metered for gas and electricity, allowing tenants to pay their own utilities and helping to minimize operating expenses.
-
2026-05-01$1,300,000 Active 1196-char remark
Show marketing remark (1196 chars)
736 Natoma Street presents a rare opportunity to acquire a classic Victorian architecture triplex in the heart of South of Market (SoMa), one of San Francisco's most dynamic and evolving neighborhoods. Known for its proximity to major tech employers, transit hubs, and vibrant dining and nightlife, SoMa continues to attract a strong tenant base driven by convenience and urban lifestyle. Constructed in 1911, this well-maintained building features three spacious 2-bedroom, 1-bathroom units, each with similar, functional layouts. The property retains its original charm with period detailing throughout, including bay windows, decorative trim, formal dining rooms with built-ins, and traditional fireplaces features that continue to resonate with tenants seeking character alongside functionality. Recent capital improvements enhance the property's operational appeal, including new water heaters (2024), upgraded plumbing in select areas, a rebuilt lightwell with improved drainage, and updated kitchen and gas line improvements in select units. The property is separately metered for gas and electricity, allowing tenants to pay their own utilities and helping to minimize operating expenses.
ⓘ Source: listings_history table (triggers on properties + properties_extension) + one-shot
backfill from property_details.listing_events for pre-trigger history.
Climate risk First Street
- Flood 1/10 Low FEMA zone X (unshaded) · 0% chance over 30 yrs
- Wildfire 1/10 Low
- Heat 3/10 Moderate 8 d/yr ≥79°F today · 17 d/yr by 30 yrs out
- Wind 1/10 Low
- Air quality 8/10 Severe 15 unhealthy d/yr today · 15 by 30 yrs out
Nearby sold comps map
Loading sold comps map…
Walkable amenities ~0.75 mi
Loading nearby amenities…
Taxation est. · year 1
- Rental income
- $202,092
- − Mortgage interest
- −$72,820
- − Property taxes
- −$19,500
- − Insurance
- −$6,500
- − Repairs & maintenance
- −$16,167
- − Management
- −$16,167
- − Depreciation
- −$37,818
- Taxable income
- $33,119
- Est. tax owed @ 24.0%
- −$7,949
- After-tax cash flow
- $43,896/yr
For passive investors: Depreciation is non-cash, so a rental often shows a tax loss while cash-flowing — sheltering income. Rental losses are passive: they offset passive income freely, and up to $25,000/yr can offset ordinary (W-2) income if you actively participate and your MAGI is under $100k (phasing out to $0 by $150k); unused losses carry forward. On sale, claimed depreciation is recaptured at up to 25%, and gains may owe capital-gains tax (a 1031 exchange can defer both). Figures are a year-1 estimate at your 24.0% rate — not tax advice; consult a CPA.
Condition & rehab AI · 12 photos
This classic Victorian triplex in SoMa is well-maintained and ready for a new owner. Minor updates to the exterior and interior will further enhance its value.
Value-add opportunities
- Both Paint exterior trim — Enhances curb appeal and property value
- Both Clean gutters — Improves drainage and property value
- Both Replace old appliances — Modernizes the kitchen and improves functionality
- Both Update bathrooms — Modernizes the bathrooms and improves functionality
Renovation cost estimate screening
Value-add ROI direction
- Both Paint exterior trim — Enhances curb appeal and property value ↑
- Both Clean gutters — Improves drainage and property value ↑
- Both Replace old appliances — Modernizes the kitchen and improves functionality ↑
- Both Update bathrooms — Modernizes the bathrooms and improves functionality ↑
ⓘ Cost ranges are severity-bucket heuristics (US national rule-of-thumb). Get contractor quotes + a written scope before underwriting a rehab budget.
Schools (NCES district)
- District
- San Francisco Unified
- NCES district ID
- 0634410
- Math proficiency
- 50% ▬ 0.00%
- Reading proficiency
- 56% ▲ 1.00%
- Median HH income
- $81,249
- Composite
- 50.14/100
- National rank
- #4088
- State rank
- #322 of 1400 in CA
Livability — San Francisco
- Score
- 76/100
- State rank
- #90
- US rank
- #3143
Category grades
Schools grade is shown separately in the Schools card above.
Census & demographics
- Census place
- San Francisco, CA
- County
- San Francisco County · 827,552 people
- City population
- 827,552
- Metro
- San Francisco-Oakland-Berkeley, CA
- Population (ZIP)
- 34,964
- Household income
- $116,438
- Rent vs Own
- Severe rent burden
- 2666.0
Population outlook (San Francisco County) Hauer SSP2
- Today (2025)
- 1,030,936 people
- By 2030
- 1,110,409 · +7.7%
- By 2040
- 1,270,010 · +23.2%
- By 2050
- 1,435,001 · +39.2%
- By 2075
- 1,779,074 · +72.6%
- By 2100
- 1,966,767 · +90.8%
Race, ethnicity, and origin ACS 2023
- Neighborhood character
- Highly diverse neighborhood (Simpson 0.75)
- Race & ethnicity
- White 32% Asian 31% Hispanic / Latino 20% Two or more races 11% Black 10% Native American 2%
- Hispanic origin (detail)
- Mexican 11%
- Common ancestry
- Lithuanian 2% Slovak 2% Romanian 2%
- Foreign-born
- 36% · Canada, China, Vietnam
- Languages at home
- 56% English-only · Spanish 16% Chinese 9% Tagalog/Filipino 6%
Political lean MEDSL · San Francisco
- 2024 margin
- Solid D (+64.8) · D 80.3% · R 15.5% · Other 4.1%
- 2008→2024 swing
- -5.7pp toward R · 2008: 70.5pp · 2024: 64.8pp
- All cycles
- 2024: D+64.8 2020: D+72.5 2016: D+76.1 2012: D+70.2 2008: D+70.5
Not yet ingested
- Civics
- —
Market trends
- HPI YoY
- ▲ 4.96%
- Current HPI
- 175.4945
- Rent YoY
- ▲ 15.50%
- Metro
- San Francisco-Oakland-Berkeley, CA
- State GDP YoY
- ▲ 3.21%
- F500 in state
- 116
Industry mix (Fortune 500 HQ in CA)
| Industry | F500 HQs | Revenue |
|---|---|---|
| Technology | 27 | $1,492B |
|
||
| Financial Services | 3 | $174B |
|
||
| Retail | 3 | $44B |
|
||
| Insurance | 3 | $26B |
|
||
| Media / Entertainment | 2 | $115B |
|
||
| Pharmaceuticals / Biotech | 2 | $62B |
|
||
Price history
+0.0% since first listed6 events — show timeline
- 2026-06-04 Relisted — bridgeMLS, Bay East AOR, or Contra Costa AOR
- 2026-06-04 Relisted — MLSListings
- 2026-05-28 Listing Removed — bridgeMLS, Bay East AOR, or Contra Costa AOR
- 2026-05-28 Listing Removed — MLSListings
- 2026-05-01 Listed $1,300,000 MLSListings
- 2026-05-01 Listed $1,300,000 bridgeMLS, Bay East AOR, or Contra Costa AOR
Cash-flow waterfall
monthlySold comps — $/sqft
last 12 mo · ≤1 miLoading sold comps…