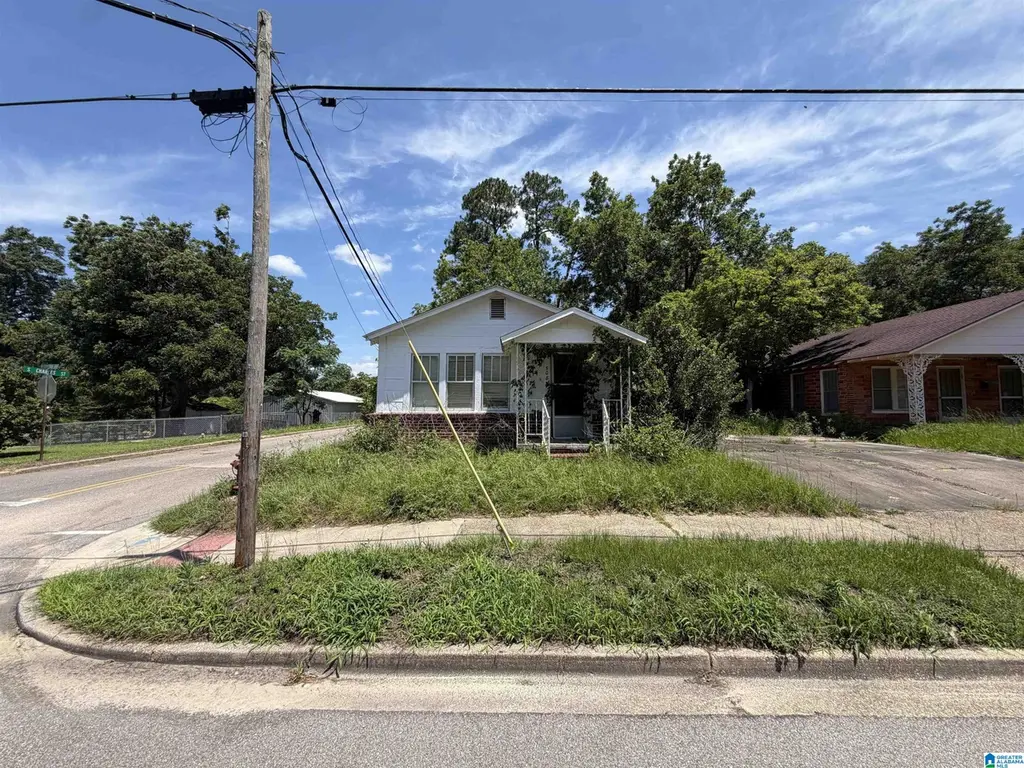
508 Covington Ave · Opp, AL
Flood risk 1/10 · Minimal
- FEMA flood zone
- X (unshaded)
- Chance of flooding over 30 yrs
- 0.0%
- Est. flood insurance / yr
- $507 – $1,088
Fire risk 3/10 · Minor
- Est. fire insurance / yr
- $916 – $1,700
Heat risk 8/10 · Major
- Hot days now (above 106°F)
- 7 days/yr
- Hot days in 30 yrs
- 19 days/yr
Wind risk 8/10 · Major
- Chance of severe wind over 30 yrs
- 99.0%
Air-quality risk 1/10 · Minimal
- Unhealthy air days now
- 0 days/yr
- Unhealthy air days in 30 yrs
- 0 days/yr
Risk factors via First Street. Map © Google.
Why this score? — see what drove the B- grade
The composite is a weighted blend of 9 inputs, each scored 0–100. Each bar is that input's sub-score; the figure is the points it added to the 100-point composite (weight × sub-score).
- Cash flow +30.0/30.0
- 1% rule +10.0/10.0
- DSCR +10.0/10.0
- ARV discount +7.5/15.0
- Livability +3.3/5.0
- Schools +3.1/10.0
- Rent growth +2.5/5.0
- Condition / age +2.5/5.0
- Appreciation +0.0/10.0
$39,000
🖨 Deal sheet 📄 Offer letter ✓ Due diligence
Listing remarks
Check out this investment opportunity!Disclaimer- This is a tax deed property. Cash offers only. No title insurance available.
Key facts
- 8,712 sq ft lot
- Built 1950
- Listed 12 days
Property features AI
Finance
- Other: Square footage reported per tax report
Exterior
- Parking: Driveway parking
- Security: No security features listed
- Utilities: Public water; Septic system; Internet service availability unknown
- Home design: Existing property; Single-story living areas (rooms listed at level 1)
- Construction: Siding (other) exterior; Crawl space foundation; Approximately 0.2 acres
- Exterior features: No waterfront; No pool; No patio; No garden/patio; No decks
Interior
- Kitchen: Laminate countertops
- Bedrooms: Three bedrooms on the main level
- Flooring: Vinyl flooring
- Bathrooms: One full bathroom on the main level
- Heating & cooling: No heat; No air conditioning
- Interior features: Ceilings noted as other (see remarks); No additional interior features listed
- Laundry & utility: No laundry or utility appliances listed
Neighborhood map
What this means for you Summary
Snapshot
- This is a 3-bed/1.0-bath single-family listed at $39k.
Deal economics
- At list price, monthly cash flow is $525 ($6k/yr) — positive.
- The deal already cash-flows at list — no discount required.
- Meets the 1% rule at list price ($1k rent vs $39k).
- Cap rate 22.4% vs local median 3.9% in Opp — top-decile yield for the area; either an underpriced asset or a hidden risk that comps aren't pricing in. Stress-test before assuming the spread holds.
Location & tenants
- Location reads 66/100 on livability (#107 in AL) — a middle-class / working-renter tenant base. Strengths: cost of living A+, health & safety A+, housing A; Watch: amenities F, commute F, employment F.
- Opp City (town): math 26% / reading 50% proficiency, ranked #37 of 129 in AL (top 29%) — families likely to look elsewhere, expect single-tenant / working-renter base with shorter leases.
- Zoned schools: Opp High School (math 22% / reading 17%, grade F, #169 of 305 statewide, top 59%, 393 students, 62% FRL).
- Zoned-school proficiency averages 20% at this address vs 38% district-wide (-18 pts) — the specific schools serving this property underperform the Opp City average; the district grade overstates school quality for this exact location.
- Market conditions: 64 active listings in the ZIP; 1 comparable units currently listed for rent nearby; 13 units permitted in Covington County in 2024 (0 in 5+ unit buildings).
Forward outlook
- Local home prices are declining (-3.0%/yr); year-one equity from $270 of loan paydown is wiped out by about $1k of value loss. Plan a longer hold.
- Covington County population projected to shrink 10% by 2050 — rents likely to lag national; underwrite the cash flow, not the appreciation.
- At projected returns (-3.0% appreciation + 3.0% rent growth), your $11k cash investment doubles in ~2 years — after that, you're playing with house money.
Negotiation context
- Only 13 days on market — expect competitive offers; lowballing is unlikely to land.
Risks & watch-outs
- Watch-outs: built in 1950 — expect roof / HVAC / electrical / plumbing capex.
- Climate carrying-cost: severe wind risk, 99% chance of damaging wind over 30y; extreme-heat days projected 7→19/yr by 2055 (HVAC capex compounding) — expect insurance premiums to compound above CPI over the hold.
Questions for the listing agent
- Built in 1950 — when were the roof, HVAC, electrical panel, plumbing, and water heater last replaced?
- Is there a deadline driving the sale (1031 exchange, divorce, estate, relocation)? That informs how much negotiation room exists.
- Schools are D-rated, which usually means shorter tenancies and higher turnover. Who's the typical renter profile here, and what's been the actual vacancy rate?
- What's the average days-on-market for RENTAL listings here right now (not sales)? A rising rental-DOM trend means longer vacancies and softer asking-rent achievability than the comps imply.
- What's the recent tenant-quality profile in this submarket — average credit score on applications, eviction rate, late-payment / NSF rate, and stable-employment percentage? A property-management company in the area should have these aggregated.
- How much new for-sale + rental construction is in the pipeline within 1–3 miles? Heavy new supply typically softens prices + rents 12–24 months out; constrained supply supports both.
Investment metrics
- 1% rule
- 2.56% ✓
- Cap rate
- 22.44%
- Cash-on-cash
- 57.66%
- DSCR
- 3.57
- GRM
- 3.2
CMA / ARV
- ARV (on-the-fly)
- $122,304
- Comps found
- 12
Show comp detail 12 sales within ~0.75 mi
| Address | Dist | Beds/Ba | Sqft | Sold | Price | $/sf | Match |
|---|---|---|---|---|---|---|---|
| 1003 Maude Ave | 0.38mi | 3/2.0 | 1,300 (-3%) | 6mo | $55,000 | $42 | 68 |
| 402 North Jackson St | 0.52mi | 3/1.0 | 1,350 (+0%) | 12mo | $135,000 | $100 | 65 |
| 606 Charlie St | 0.63mi | 3/1.0 | 1,375 (+2%) | 6mo | $68,000 | $49 | 62 |
| 709 10th St | 0.54mi | 3/2.0 | 1,276 (-5%) | 1mo | $77,000 | $60 | 62 |
| 504 Seventh St | 0.34mi | 3/2.0 | 1,484 (+10%) | 3mo | $85,000 | $57 | 61 |
| 809 10th St | 0.56mi | 3/1.0 | 1,421 (+6%) | 5mo | $130,000 | $91 | 60 |
| 504 Brown St | 0.58mi | 3/1.0 | 1,333 (-1%) | 15mo | $130,000 | $98 | 59 |
| 601 Virginia Ave | 0.35mi | 3/1.0 | 1,448 (+8%) | 14mo | $93,000 | $64 | 59 |
| 605 Opine Rd | 0.72mi | 3/2.0 | 1,334 (-1%) | 7mo | $220,000 | $165 | 55 |
| 102 South Jackson St | 0.34mi | 2/1.0 (-1) | 1,516 (+13%) | 10mo | $105,000 | $69 | 49 |
| 308 West St | 0.38mi | 3/2.0 | 1,512 (+12%) | 13mo | $145,000 | $96 | 46 |
| 239 West Gunter Ave | 0.71mi | 3/2.0 | 1,471 (+9%) | 13mo | $214,995 | $146 | 36 |
Match score weights: distance 35% · size 25% · config 20% · recency 20%. Top-matched comps best support the ARV.
Projected returns pro-forma
-3.0% appreciation · 3.0% rent growth · sell at horizon
- IRR
- 56.2%
- Equity multiple
- 3.48×
- Total profit
- $27,112
- Equity at exit
- $5,815
- IRR
- 61.2%
- Equity multiple
- 7.11×
- Total profit
- $66,691
- Equity at exit
- $3,372
Cash invested: $10,920 (down + closing). Projections, not guarantees.
Landlord ↔ Tenant lean methodology
- Overall (STATE)
- 90 Strongly Landlord-Friendly
- State Alabama
- 90 Strongly Landlord-Friendly · R+15
- County
- — inherits STATE
- City
- — inherits STATE
ZIP-level market 36467
- Home prices YoY
- -20.9%
- Active inventory
- 64
- Price-to-rent
- 3.2×
Monthly cashflow live
- Estimated rent
- $1,000 medium interval (Pro) →
- Mortgage (P&I)
- −$205
- Tax from tax record
- −$45 /mo · $534/yr
- Insurance
- −$16
- HOA
- −$0
- Vacancy / Maint / Mgmt
- −$210
- Net cashflow
- $525
Break-even live
UW: 25.0% down · 7.5% · 30yr · 1.5% tax · 5.0% vac · 8.0% maint · 8.0% mgmt
Financing live
Cash to close
- Down payment
- $9,750
- Closing costs
- $1,170
- Reserves months
- —
- Total cash needed
- —
Loan-product check · same deal, 3 products live
Conventional
25% down · 7.5% · 30yr
- Down + closing
- —
- Monthly P&I
- —
- Monthly cashflow
- —
- DSCR
- —
- Eligible?
- —
Personal DTI + credit; lowest rate.
DSCR
20% down · 8.5% · 30yr
- Down + closing
- —
- Monthly P&I
- —
- Monthly cashflow
- —
- DSCR
- —
- Eligible?
- —
No personal income docs; deal must DSCR.
Hard money
10% down · 12.0% · 12mo
- Down + closing
- —
- Monthly P&I
- —
- Monthly cashflow
- —
- DSCR
- —
- Eligible?
- —
Short-term bridge; refi at stabilization.
Rent comps 1 comps
| Address | Beds | Baths | Sqft | Rent | $/sqft | DOM | Units | Dist |
|---|---|---|---|---|---|---|---|---|
| 203 Paul St Opp, AL | 3.0 | 2.0 | 1428 | $1,000 | $0.70 | 43d | 1 | 0.32mi |
Listing history 11 events
-
2026-06-19days on market $39,000 Active 13 DOM
-
2026-06-18days on market $39,000 Active 12 DOM
-
2026-06-17days on market $39,000 Active 11 DOM
-
2026-06-16days on market $39,000 Active 10 DOM
-
2026-06-15days on market $39,000 Active 9 DOM
-
2026-06-14days on market $39,000 Active 7 DOM
-
2026-06-12days on market $39,000 Active 6 DOM
-
2026-06-09days on market $39,000 Active 3 DOM
-
2026-06-08days on market $39,000 Active 2 DOM
-
2026-06-07remarks 126-char remark
-
2026-06-07$39,000 Active 1 DOM
ⓘ Source: listings_history table (triggers on properties + properties_extension) + one-shot
backfill from property_details.listing_events for pre-trigger history.
Tax reassessment forecast AL · Resets to sale price
- Current annual tax
- $534 · $45/mo
- Projected year-2 tax
- $534 · $45/mo
- Expected delta
- $0/yr ($0/mo · 0.0%)
ⓘ Screening estimate from a state-policy table — verify with the county assessor before closing.
Climate risk First Street
- Flood 1/10 Low FEMA zone X (unshaded) · 0% chance over 30 yrs
- Wildfire 3/10 Moderate
- Heat 8/10 Severe 7 d/yr ≥106°F today · 19 d/yr by 30 yrs out
- Wind 8/10 Severe 99% chance of damaging wind over 30 yrs
- Air quality 1/10 Low 0 unhealthy d/yr today · 0 by 30 yrs out
Nearby sold comps map
Loading sold comps map…
Walkable amenities ~0.75 mi
Loading nearby amenities…
Taxation est. · year 1
- Rental income
- $12,000
- − Mortgage interest
- −$2,185
- − Property taxes
- −$534
- − Insurance
- −$195
- − Repairs & maintenance
- −$960
- − Management
- −$960
- − Depreciation
- −$1,135
- Taxable income
- $6,032
- Est. tax owed @ 24.0%
- −$1,448
- After-tax cash flow
- $4,849/yr
For passive investors: Depreciation is non-cash, so a rental often shows a tax loss while cash-flowing — sheltering income. Rental losses are passive: they offset passive income freely, and up to $25,000/yr can offset ordinary (W-2) income if you actively participate and your MAGI is under $100k (phasing out to $0 by $150k); unused losses carry forward. On sale, claimed depreciation is recaptured at up to 25%, and gains may owe capital-gains tax (a 1031 exchange can defer both). Figures are a year-1 estimate at your 24.0% rate — not tax advice; consult a CPA.
Schools (NCES district)
- District
- Opp City
- NCES district ID
- 0102610
- Math proficiency
- 26% ▼ -19.00%
- Reading proficiency
- 50% ▲ 5.00%
- Median HH income
- $32,756
- Composite
- 31.09/100
- National rank
- #6073
- State rank
- #37 of 129 in AL
Livability — Opp
- Score
- 66/100
- State rank
- #107
- US rank
- #11901
Category grades
Schools grade is shown separately in the Schools card above.
Census & demographics
- Census place
- Opp, AL
- City population
- 9,847
- Population (ZIP)
- 9,847
Population outlook (Covington County) Hauer SSP2
- Today (2025)
- 37,007 people
- By 2030
- 36,401 · -1.6%
- By 2040
- 34,983 · -5.5%
- By 2050
- 33,437 · -9.6%
- By 2075
- 29,753 · -19.6%
- By 2100
- 25,109 · -32.2%
Race, ethnicity, and origin ACS 2023
- Neighborhood character
- Predominantly White (84%)
- Race & ethnicity
- White 84% Black 12% Two or more races 4%
- Common ancestry
- Serbian 1% Italian 1% Slovak 1%
- Foreign-born
- 1% · South Korea
- Languages at home
- 99% English-only · Spanish 1%
Political lean MEDSL · Covington
- 2024 margin
- Solid R (+72.4) · D 13.6% · R 86.0%
- 2008→2024 swing
- -14.1pp toward R · 2008: -58.3pp · 2024: -72.4pp
- All cycles
- 2024: R+72.4 2020: R+68.1 2016: R+68.5 2012: R+58.3 2008: R+58.3
Not yet ingested
- Civics
- —
Market trends
- HPI YoY
- ▼ -39.82%
- Current HPI
- 151.1871
- Rent YoY
- —
- Metro
- —
- State GDP YoY
- ▲ 2.94%
- F500 in state
- 4
Industry mix (Fortune 500 HQ in AL)
| Industry | F500 HQs | Revenue |
|---|---|---|
| Financial Services | 1 | $8B |
|
||
| Healthcare | 1 | $5B |
|
||
Price history
1 event — show timeline
- 2026-06-06 Listed $39,000 Greater Alabama MLS
Property tax history
+9.3%/yrLatest (2025): $534 · +6.9% YoY. Source: county tax records.
Cash-flow waterfall
monthlySold comps — $/sqft
last 12 mo · ≤1 miLoading sold comps…