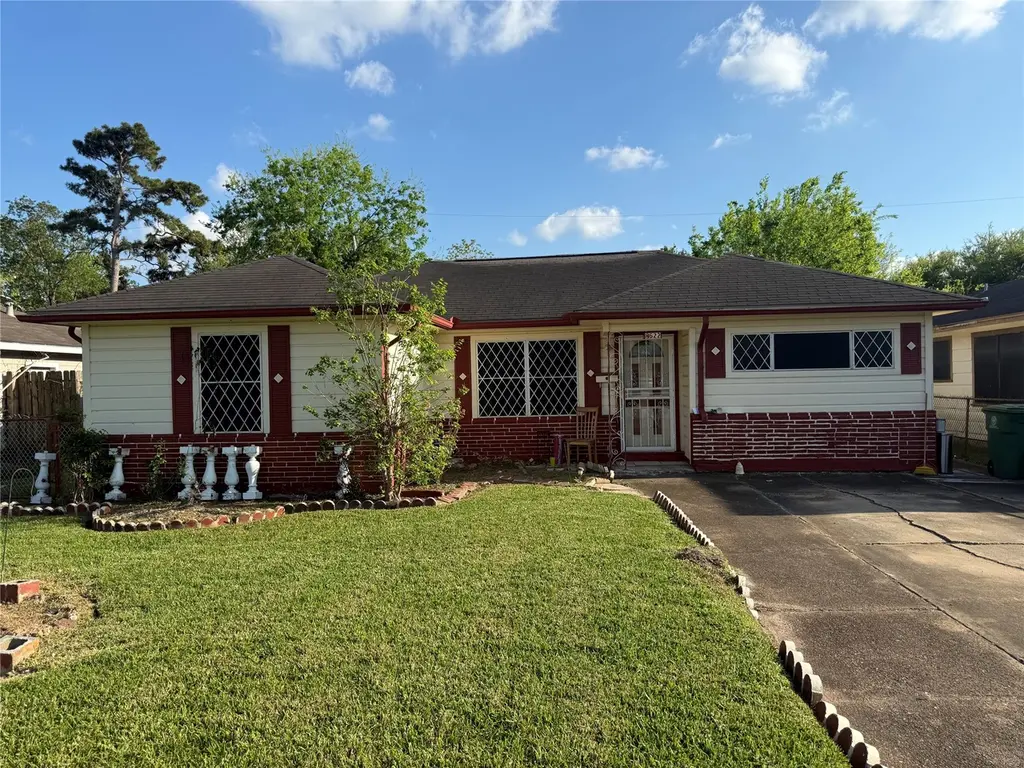
8622 Othello St · Houston, TX
Flood risk 6/10 · Moderate
- FEMA flood zone
- X (unshaded)
- Chance of flooding over 30 yrs
- 0.74%
- Est. flood insurance / yr
- $507 – $1,088
Fire risk 3/10 · Minor
- Est. fire insurance / yr
- $1,222 – $2,270
Heat risk 9/10 · Severe
- Hot days now (above 110°F)
- 7 days/yr
- Hot days in 30 yrs
- 24 days/yr
Wind risk 9/10 · Severe
- Chance of severe wind over 30 yrs
- 99.0%
Air-quality risk 3/10 · Minor
- Unhealthy air days now
- 2 days/yr
- Unhealthy air days in 30 yrs
- 3 days/yr
Risk factors via First Street. Map © Google.
Why this score? — see what drove the C grade
The composite is a weighted blend of 9 inputs, each scored 0–100. Each bar is that input's sub-score; the figure is the points it added to the 100-point composite (weight × sub-score).
- Cash flow +15.2/30.0
- ARV discount +14.4/15.0
- Appreciation +10.0/10.0
- DSCR +4.7/10.0
- 1% rule +4.1/10.0
- Livability +3.7/5.0
- Schools +2.7/10.0
- Rent growth +2.5/5.0
- Condition / age +2.5/5.0
$160,000
🖨 Deal sheet 📄 Offer letter ✓ Due diligence
Listing remarks MLS
Estate Sale. Sold AS-IS WHERE-IS. The sellers will not make any repairs. There is no seller's disclosure; the buyer is responsible for verifying everything. This cozy home has 3-4 bedrooms and 1 full bath. There are 2 living areas, one of which can be converted to a 4th bedroom. There is a central HVAC system, but it is not working. Great opportunity for investors or end buyers who want to add their touch. Easy access to both 610 & I-10, and just minutes from downtown.
Key facts
- Central hvac system
- 2 living areas
- 6,324 sq ft lot
Tags
Neighborhood map
What this means for you Summary
Snapshot
- This is a 3-bed/1.0-bath single-family listed at $160k.
Deal economics
- At list price, monthly cash flow is $57 ($685/yr) — positive.
- The deal already cash-flows at list — no discount required.
- To meet the 1% rule (rent ≥ 1% of price), the offer needs to be $145k (9.3% below list).
- Recommended offer: $145k (9.3% below list) — sets the bar for 1% rule.
- Cap rate 6.7% vs local median 3.2% in Houston — top-decile yield for the area; either an underpriced asset or a hidden risk that comps aren't pricing in. Stress-test before assuming the spread holds.
Location & tenants
- Location reads 74/100 on livability (#184 in TX, #4,771 nationally) — a middle-class / working-renter tenant base. Strengths: amenities A+, cost of living A+, housing A+; Watch: schools D, crime F.
- Houston ISD (urban): math 27% / reading 35% proficiency, ranked #593 of 826 in TX (top 72%) — families likely to look elsewhere, expect single-tenant / working-renter base with shorter leases; 71% free/reduced lunch — lower-income household profile, screen leases tightly.
- Market conditions: 153 active listings in the ZIP; 17 comparable units currently listed for rent nearby; rentals at typical pace (median 24d on market — plan ~3-4 weeks tenant-placement turnaround); 47% of comp listings sitting > 30 days — soft ceiling on asking rent; 29,883 units permitted in Harris County in 2024 (8,621 in 5+ unit buildings).
- This rent runs 36% of the median local income ($48k/yr) — at the standard rent-burdened threshold; future hikes will face affordability resistance.
Forward outlook
- In year one you build about $17k of equity ($1k loan paydown + $16k appreciation (10.0% local appreciation)).
- Harris County population projected at +47% by 2050 — long-run rental-demand tailwind backs the buy-and-hold thesis.
- At projected returns (10.0% appreciation + 3.0% rent growth), your $45k cash investment doubles in ~3 years — after that, you're playing with house money.
- By year 3, paydown + projected appreciation supports a ~$43k cash-out refi (75% LTV) — recoverable capital for the next deal without selling this one.
Negotiation context
- It's been on market 79 days — a 6% lower offer ($150k) is reasonable based on typical stale-listing flexibility.
Risks & watch-outs
- Watch-outs: built in 1956 — expect roof / HVAC / electrical / plumbing capex.
- Climate carrying-cost: major flood risk; severe wind risk, 99% chance of damaging wind over 30y; extreme-heat days projected 7→24/yr by 2055 (HVAC capex compounding) — expect insurance premiums to compound above CPI over the hold.
Questions for the listing agent
- It's been on market 79 days. Have you received any prior offers? Is the seller open to a 9% concession, seller financing, or rate buy-down credit?
- Built in 1956 — when were the roof, HVAC, electrical panel, plumbing, and water heater last replaced?
- Why hasn't it sold? Are there any deal-killer items the seller is aware of (foundation, flood, title, zoning, code violations)?
- Is there a deadline driving the sale (1031 exchange, divorce, estate, relocation)? That informs how much negotiation room exists.
- Schools are D-rated, which usually means shorter tenancies and higher turnover. Who's the typical renter profile here, and what's been the actual vacancy rate?
- Crime grade is F in this area — have there been break-ins, vandalism, or insurance claims at this property in the last 3 years? What carrier currently insures it and at what premium?
- What's the average days-on-market for RENTAL listings here right now (not sales)? A rising rental-DOM trend means longer vacancies and softer asking-rent achievability than the comps imply.
- What's the recent tenant-quality profile in this submarket — average credit score on applications, eviction rate, late-payment / NSF rate, and stable-employment percentage? A property-management company in the area should have these aggregated.
- How much new for-sale + rental construction is in the pipeline within 1–3 miles? Heavy new supply typically softens prices + rents 12–24 months out; constrained supply supports both.
Investment metrics
- 1% rule
- 0.91% ✗
- Cap rate
- 6.72%
- Cash-on-cash
- 1.53%
- DSCR
- 1.07
- GRM
- 9.2
CMA / ARV
- ARV (median comp)
- $188,986
- List price
- $160,000
- Delta
- -15.34%
- Verdict
- UNDERPRICED
- Comps
- 20 within 1.0 mi
Show comp detail 12 sales within ~0.75 mi
| Address | Dist | Beds/Ba | Sqft | Sold | Price | $/sf | Match |
|---|---|---|---|---|---|---|---|
| 8734 Josie St | 0.22mi | 3/1.0 | 1,150 (+2%) | 1mo | $159,000 | $138 | 86 |
| 1718 Normandale St | 0.15mi | 3/2.0 | 1,144 (+1%) | 9mo | $229,000 | $200 | 80 |
| 8606 Guinevere St | 0.07mi | 3/1.5 | 1,238 (+10%) | 2mo | $225,000 | $182 | 78 |
| 8711 Othello St | 0.13mi | 3/2.0 | 1,180 (+4%) | 8mo | $215,000 | $182 | 76 |
| 8427 Guinevere St | 0.33mi | 4/2.0 (+1) | 1,228 (+9%) | 1mo | $225,000 | $183 | 60 |
| 1531 Teanaway Ln | 0.35mi | 4/1.0 (+1) | 1,226 (+8%) | 12mo | $195,000 | $159 | 54 |
| 1427 Teanaway Ln | 0.42mi | 3/2.0 | 1,232 (+9%) | 11mo | $239,750 | $195 | 52 |
| 8446 Norvic St | 0.30mi | 4/2.0 (+1) | 1,289 (+14%) | 4mo | $164,580 | $128 | 50 |
| 1431 Teanaway Ln | 0.42mi | 2/1.0 (-1) | 1,000 (-12%) | 9mo | $115,000 | $115 | 48 |
| 8647 Berndale St | 0.39mi | 4/2.0 (+1) | 1,252 (+11%) | 11mo | $199,999 | $160 | 46 |
| 8766 Othello St | 0.28mi | 4/1.0 (+1) | 1,294 (+14%) | 20mo | $185,000 | $143 | 41 |
| 8707 Fannette St | 0.45mi | 4/2.0 (+1) | 1,300 (+15%) | 6mo | $199,999 | $154 | 40 |
Match score weights: distance 35% · size 25% · config 20% · recency 20%. Top-matched comps best support the ARV.
Projected returns pro-forma
10.0% appreciation · 3.0% rent growth · sell at horizon
- IRR
- 25.4%
- Equity multiple
- 3.03×
- Total profit
- $90,788
- Equity at exit
- $144,141
- IRR
- 22.4%
- Equity multiple
- 6.90×
- Total profit
- $264,521
- Equity at exit
- $310,845
Cash invested: $44,800 (down + closing). Projections, not guarantees.
Landlord ↔ Tenant lean methodology
- Overall (STATE)
- 87 Strongly Landlord-Friendly
- State Texas
- 87 Strongly Landlord-Friendly · R+5
- County
- — inherits STATE
- City
- — inherits STATE
ZIP-level market 77029
- Home prices YoY
- 7.2%
- Active inventory
- 153
- Price-to-rent
- 9.2×
Monthly cashflow live
- Estimated rent
- $1,451 high interval (Pro) →
- Mortgage (P&I)
- −$839
- Tax from tax record
- −$184 /mo · $2,206/yr
- Insurance
- −$67
- HOA
- −$0
- Vacancy / Maint / Mgmt
- −$305
- Net cashflow
- $57
Break-even live
UW: 25.0% down · 7.5% · 30yr · 1.5% tax · 5.0% vac · 8.0% maint · 8.0% mgmt
Financing live
Cash to close
- Down payment
- $40,000
- Closing costs
- $4,800
- Reserves months
- —
- Total cash needed
- —
Loan-product check · same deal, 3 products live
Conventional
25% down · 7.5% · 30yr
- Down + closing
- —
- Monthly P&I
- —
- Monthly cashflow
- —
- DSCR
- —
- Eligible?
- —
Personal DTI + credit; lowest rate.
DSCR
20% down · 8.5% · 30yr
- Down + closing
- —
- Monthly P&I
- —
- Monthly cashflow
- —
- DSCR
- —
- Eligible?
- —
No personal income docs; deal must DSCR.
Hard money
10% down · 12.0% · 12mo
- Down + closing
- —
- Monthly P&I
- —
- Monthly cashflow
- —
- DSCR
- —
- Eligible?
- —
Short-term bridge; refi at stabilization.
Rent comps 17 comps
| Address | Beds | Baths | Sqft | Rent | $/sqft | DOM | Units | Dist |
|---|---|---|---|---|---|---|---|---|
| 8534 Fillmore St Houston, TX | 3.0 | 1.0 | 965 | $1,600 | $1.66 | 43d | 1 | 0.17mi |
| 8726 Josie St Houston, TX | 3.0 | 1.0 | 950 | $1,000 | $1.05 | 43d | 1 | 0.22mi |
| 8735 Cowart St Houston, TX | 3.0 | 1.0 | 1136 | $1,000 | $0.88 | 43d | 1 | 0.35mi |
| 2203 Pearl St Houston, TX | 3.0 | 2.0 | 1298 | $1,570 | $1.21 | 13d | 1 | 0.76mi |
| 9709 Cargill St Houston, TX | 3.0 | 2.0 | 1184 | $2,300 | $1.94 | 43d | 1 | 0.92mi |
| 9710 Tuffly St Houston, TX | 3.0 | 2.0 | 1275 | $1,795 | $1.41 | 24d | 1 | 0.99mi |
| 9806 Fillmore St Houston, TX | 2.0 | 2.0 | 850 | $1,850 | $2.18 | 43d | 1 | 1.00mi |
| 9701 Market St Houston, TX | 1.0–2.0 | 1.0 | 798 | $1,309 | $1.64 | 7d | 1 | 1.07mi |
| 9713 Stedman St Unit b Houston, TX | 3.0 | 2.0 | 872 | $1,095 | $1.26 | 43d | 1 | 1.10mi |
| 9907 Lanewell St Unit a Houston, TX | 3.0 | 2.0 | 872 | $1,154 | $1.32 | 21d | 1 | 1.12mi |
| 9743 Veyblum St Unit B Houston, TX | 3.0 | 2.0 | 872 | $1,145 | $1.31 | 5d | 1 | 1.23mi |
| 9821 Turnbow St Unit C Houston, TX | 3.0 | 2.0 | 1140 | $1,720 | $1.51 | 43d | 1 | 1.25mi |
| 10202 Challenger 7 Dr Unit 424 Jacinto City, TX | 2.0 | 2.0 | 900 | $1,115 | $1.24 | 5d | 1 | 1.44mi |
| 10202 Challenger 7 Dr Unit 422 Jacinto City, TX | 2.0 | 2.0 | 900 | $1,115 | $1.24 | 7d | 1 | 1.44mi |
| 10202 Challenger 7 Dr Unit 10259 Jacinto City, TX | 2.0 | 2.0 | 900 | $1,107 | $1.23 | 2d | 1 | 1.44mi |
| 10202 Challenger 7 Dr Unit 2047 Jacinto City, TX | 2.0 | 2.0 | 900 | $1,150 | $1.28 | 10d | 1 | 1.44mi |
| 10208 Challenger 7 Dr Jacinto City, TX | 2.0 | 1.0 | 900 | $1,190 | $1.32 | 43d | 1 | 1.48mi |
Listing history 13 events
-
2026-06-18days on market $160,000 Active 79 DOM
-
2026-06-17days on market $160,000 Active 78 DOM
-
2026-06-16days on market $160,000 Active 77 DOM
-
2026-06-15days on market $160,000 Active 76 DOM
-
2026-06-13days on market $160,000 Active 74 DOM
-
2026-06-10days on market $160,000 Active 70 DOM
-
2026-06-08days on market $160,000 Active 69 DOM
-
2026-06-07days on market $160,000 Active 68 DOM
-
2026-06-04days on market $160,000 Active 65 DOM
-
2026-06-01days on market $160,000 Active 62 DOM
-
2026-05-31days on market $160,000 Active 61 DOM
-
2026-03-31$160,000 Active 477-char remark
Show marketing remark (477 chars)
Estate Sale. Sold AS-IS WHERE-IS. The sellers will not make any repairs. There is no seller's disclosure; the buyer is responsible for verifying everything. This cozy home has 3-4 bedrooms and 1 full bath. There are 2 living areas, one of which can be converted to a 4th bedroom. There is a central HVAC system, but it is not working. Great opportunity for investors or end buyers who want to add their touch. Easy access to both 610 & I-10, and just minutes from downtown.
-
1988-01-02soldstatus
ⓘ Source: listings_history table (triggers on properties + properties_extension) + one-shot
backfill from property_details.listing_events for pre-trigger history.
Tax reassessment forecast TX · Resets to sale price
- Current annual tax
- $2,206 · $184/mo
- Projected year-2 tax
- $2,928 · $244/mo
- Expected delta
- +$722/yr (+$60/mo · 32.7%)
ⓘ Screening estimate from a state-policy table — verify with the county assessor before closing.
Climate risk First Street
- Flood 6/10 Major FEMA zone X (unshaded) · 74% chance over 30 yrs
- Wildfire 3/10 Moderate
- Heat 9/10 Extreme 7 d/yr ≥110°F today · 24 d/yr by 30 yrs out
- Wind 9/10 Extreme 99% chance of damaging wind over 30 yrs
- Air quality 3/10 Moderate 2 unhealthy d/yr today · 3 by 30 yrs out
Nearby sold comps map
Loading sold comps map…
Walkable amenities ~0.75 mi
Loading nearby amenities…
Taxation est. · year 1
- Rental income
- $17,417
- − Mortgage interest
- −$8,962
- − Property taxes
- −$2,206
- − Insurance
- −$800
- − Repairs & maintenance
- −$1,393
- − Management
- −$1,393
- − Depreciation
- −$4,655
- Taxable loss
- −$1,992
- Est. tax savings @ 24.0%
- +$478
- After-tax cash flow
- $1,163/yr
For passive investors: Depreciation is non-cash, so a rental often shows a tax loss while cash-flowing — sheltering income. Rental losses are passive: they offset passive income freely, and up to $25,000/yr can offset ordinary (W-2) income if you actively participate and your MAGI is under $100k (phasing out to $0 by $150k); unused losses carry forward. On sale, claimed depreciation is recaptured at up to 25%, and gains may owe capital-gains tax (a 1031 exchange can defer both). Figures are a year-1 estimate at your 24.0% rate — not tax advice; consult a CPA.
Schools (NCES district)
- District
- Houston ISD
- NCES district ID
- 4823640
- Math proficiency
- 27% ▼ -18.00%
- Reading proficiency
- 35% ▼ -6.00%
- Median HH income
- $46,054
- Composite
- 26.63/100
- National rank
- #7173
- State rank
- #593 of 826 in TX
Livability — Houston
- Score
- 74/100
- State rank
- #184
- US rank
- #4771
Category grades
Schools grade is shown separately in the Schools card above.
Census & demographics
- Census place
- Houston, TX
- County
- Harris County · 4,702,590 people
- City population
- 3,226,434
- Metro
- Houston-The Woodlands-Sugar Land, TX
- Population (ZIP)
- 16,154
- Household income
- $48,279
- Rent vs Own
- Severe rent burden
- 457.0
Population outlook (Harris County) Hauer SSP2
- Today (2025)
- 5,571,493 people
- By 2030
- 6,089,821 · +9.3%
- By 2040
- 7,142,806 · +28.2%
- By 2050
- 8,185,864 · +46.9%
- By 2075
- 10,574,329 · +89.8%
- By 2100
- 12,109,958 · +117.4%
Race, ethnicity, and origin ACS 2023
- Neighborhood character
- Predominantly Hispanic (72%)
- Race & ethnicity
- Hispanic / Latino 72% Two or more races 32% Black 22% White 5%
- Hispanic origin (detail)
- Mexican 66%
- Foreign-born
- 31% · Canada
- Languages at home
- 39% English-only · Spanish 61%
Political lean MEDSL · Harris
- 2024 margin
- Lean D (+5.5) · D 52.0% · R 46.4% · Other 1.6%
- 2008→2024 swing
- +3.9pp toward D · 2008: 1.6pp · 2024: 5.5pp
- All cycles
- 2024: D+5.5 2020: D+13.3 2016: D+12.4 2012: D+0.1 2008: D+1.6
Not yet ingested
- Civics
- —
Market trends
- HPI YoY
- ▲ 18.53%
- Current HPI
- 276.1811
- Rent YoY
- —
- Metro
- Houston-The Woodlands-Sugar Land, TX
- State GDP YoY
- ▲ 3.95%
- F500 in state
- 110
Industry mix (Fortune 500 HQ in TX)
| Industry | F500 HQs | Revenue |
|---|---|---|
| Energy | 16 | $1,198B |
|
||
| Technology | 5 | $198B |
|
||
| Engineering / Construction | 4 | $72B |
|
||
| Energy Services | 3 | $60B |
|
||
| Utilities | 3 | $41B |
|
||
| Healthcare | 2 | $330B |
|
||
Price history
2 events — show timeline
- 2026-03-31 Listed $160,000 HARMLS
- 1988-01-02 Sold (Public Records) — Public Records
Property tax history
+2.1%/yrLatest (2025): $2,206 · +11.7% YoY. Source: county tax records.
Cash-flow waterfall
monthlySold comps — $/sqft
last 12 mo · ≤1 miLoading sold comps…