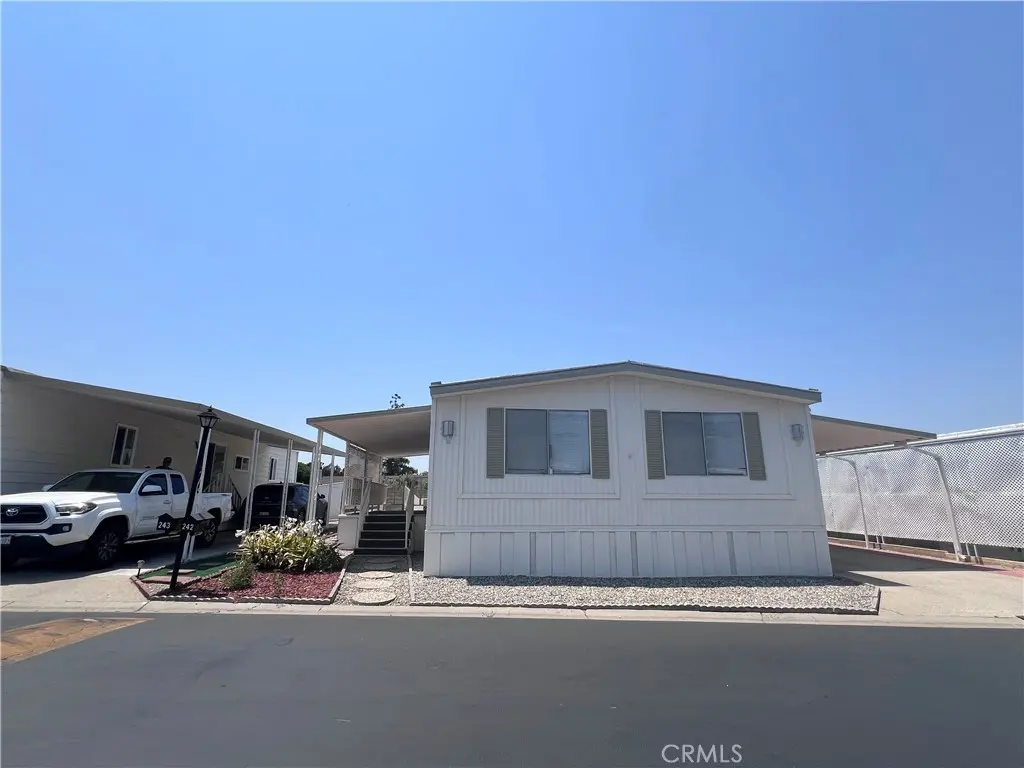
1441 Paso Real Ave #242 · Rowland Heights, CA
Flood risk 1/10 · Minimal
- FEMA flood zone
- X (unshaded)
- Chance of flooding over 30 yrs
- 0.0%
- Est. flood insurance / yr
- $507 – $1,088
Fire risk 1/10 · Minimal
- Est. fire insurance / yr
- $659 – $1,223
Heat risk 6/10 · Moderate
- Hot days now (above 99°F)
- 7 days/yr
- Hot days in 30 yrs
- 21 days/yr
Wind risk 1/10 · Minimal
- Chance of severe wind over 30 yrs
- —
Air-quality risk 7/10 · Major
- Unhealthy air days now
- 13 days/yr
- Unhealthy air days in 30 yrs
- 14 days/yr
Risk factors via First Street. Map © Google.
Why this score? — see what drove the B+ grade
The composite is a weighted blend of 9 inputs, each scored 0–100. Each bar is that input's sub-score; the figure is the points it added to the 100-point composite (weight × sub-score).
- Cash flow +30.0/30.0
- ARV discount +10.9/15.0
- 1% rule +10.0/10.0
- DSCR +10.0/10.0
- Rent growth +5.0/5.0
- Schools +4.5/10.0
- Livability +2.5/5.0
- Condition / age +2.5/5.0
- Appreciation +0.0/10.0
$159,000
🖨 Deal sheet 📄 Offer letter ✓ Due diligence
Key facts
- 3,500 sq ft lot
- Community pool
- Built 1973
Property features AI
Finance
- Other: Lot size reported as 0-1 unit/acre; Lot size source: not taped; Elevation units in feet; Manager approval required for sale
- HOA & community: Land lease for the space: $1,600 (land lease community)
Exterior
- Parking: Located in RHME park (park name listed)
- Utilities: Public sewer; District/public water
- Home design: Single-story property; Mobile home remains on site; Mobile dimensions approximately 24 ft by 48 ft
- Construction: Year built per assessor; Living area source: assessor's data
- Exterior features: Community pool; Street lighting
Interior
- Bathrooms: One full bathroom; One three-quarter bathroom
- Interior features: Entry on the 1st level
- Laundry & utility: Laundry inside the unit
Neighborhood map
What this means for you Summary
Snapshot
- This is a 2-bed/2.0-bath manufactured listed at $159k.
Deal economics
- At list price, monthly cash flow is $1k ($16k/yr) — positive.
- The deal already cash-flows at list — no discount required.
- Meets the 1% rule at list price ($3k rent vs $159k).
- Recommended offer: $154k (3.0% below list) — sets the bar for market timing.
- Cap rate 16.3% vs local median 2.7% in Rowland Heights — top-decile yield for the area; either an underpriced asset or a hidden risk that comps aren't pricing in. Stress-test before assuming the spread holds.
Location & tenants
- Location reads 50/100 on livability (#1,123 in CA) — a working-class tenant base; expect higher turnover. Strengths: employment A; Watch: crime C-, amenities F, commute F.
- Rowland Unified (suburban): math 40% / reading 62% proficiency, ranked #134 of 517 in CA (top 26%) — acceptable for families but not a draw, mixed tenant base, ~2y average lease.
- Zoned schools: Jellick Elementary (382 students, 82% FRL); Alvarado Intermediate (648 students, 73% FRL) — zoned schools average 77% FRL vs 56% district-wide (21 pts higher); higher-poverty schools than district average — tighter screening recommended.
- Market conditions: Rents rising fast (+10.3%/yr); 102 active listings in the ZIP; 20 comparable units currently listed for rent nearby; rentals at typical pace (median 18d on market — plan ~3-4 weeks tenant-placement turnaround); solid renter incomes; 19,697 units permitted in Los Angeles County in 2024 (9,426 in 5+ unit buildings).
- This rent runs 41% of the median local income ($83k/yr) — at the standard rent-burdened threshold; future hikes will face affordability resistance.
Forward outlook
- Local home prices are declining (-3.0%/yr); year-one equity from $1k of loan paydown is wiped out by about $5k of value loss. Plan a longer hold.
- Los Angeles County population projected at +9% by 2050 — modest demand growth; plan on rents tracking national, not racing it.
- At projected returns (-3.0% appreciation + 8.0% rent growth), your $45k cash investment doubles in ~4 years — after that, you're playing with house money.
Negotiation context
- It's been on market 47 days — a 3% lower offer ($154k) is reasonable based on typical stale-listing flexibility.
- 2 sale attempts since 15y ago with the ask held roughly flat each time — persistent listings suggest the price (not the market) is what's stuck; bring a comps-based counter.
- Current owner paid $39k; list at $159k implies a 308% gain — meaningful room to come down on a strong offer.
Risks & watch-outs
- Climate carrying-cost: extreme-heat days projected 7→21/yr by 2055 (HVAC capex compounding) — expect insurance premiums to compound above CPI over the hold.
Questions for the listing agent
- It's been on market 47 days. Have you received any prior offers? Is the seller open to a 3% concession, seller financing, or rate buy-down credit?
- Built in 1973 — when were the roof, HVAC, electrical panel, plumbing, and water heater last replaced?
- Is there a deadline driving the sale (1031 exchange, divorce, estate, relocation)? That informs how much negotiation room exists.
- What's the average days-on-market for RENTAL listings here right now (not sales)? A rising rental-DOM trend means longer vacancies and softer asking-rent achievability than the comps imply.
- What's the recent tenant-quality profile in this submarket — average credit score on applications, eviction rate, late-payment / NSF rate, and stable-employment percentage? A property-management company in the area should have these aggregated.
- How much new for-sale + rental construction is in the pipeline within 1–3 miles? Heavy new supply typically softens prices + rents 12–24 months out; constrained supply supports both.
Investment metrics
- 1% rule
- 1.80% ✓
- Cap rate
- 16.35%
- Cash-on-cash
- 35.90%
- DSCR
- 2.60
- GRM
- 4.6
CMA / ARV
- ARV (median comp)
- $171,795
- List price
- $159,000
- Delta
- -7.45%
- Verdict
- FAIR
- Comps
- 20 within 1.0 mi
Show comp detail 9 sales within ~0.75 mi
| Address | Dist | Beds/Ba | Sqft | Sold | Price | $/sf | Match |
|---|---|---|---|---|---|---|---|
| 1441 Paso Real Ave #198 | 0.00mi | 2/2.0 | 1,152 (0%) | 1mo | $85,000 | $74 | 99 |
| 1441 Paso Real Ave #123 | 0.00mi | 2/2.0 | 1,200 (+4%) | 11mo | $158,000 | $132 | 84 |
| 1441 S Paseo Real #202 | 0.10mi | 2/1.0 | 1,056 (-8%) | 12mo | $190,000 | $180 | 68 |
| 1441 Paso Real Ave #216 | 0.00mi | 3/2.0 (+1) | 1,290 (+12%) | 11mo | $200,000 | $155 | 66 |
| 1560 S Otterbein Ave #6 | 0.56mi | 3/2.0 (+1) | 1,152 (0%) | 18mo | $195,000 | $169 | 54 |
| 1560 S Otterbein Ave #98 | 0.56mi | 3/2.0 (+1) | 1,152 (0%) | 24mo | $170,000 | $148 | 49 |
| 1560 S Otterbein #138 Ave #138 | 0.56mi | 3/2.0 (+1) | 1,320 (+15%) | 10mo | $300,000 | $227 | 36 |
| 1560 S Otterbein Ave #126 | 0.56mi | 3/2.0 (+1) | 1,248 (+8%) | 23mo | $268,000 | $215 | 36 |
| 1560 Otterbein Ave #46 | 0.56mi | 3/2.0 (+1) | 1,254 (+9%) | 23mo | $160,000 | $128 | 35 |
Match score weights: distance 35% · size 25% · config 20% · recency 20%. Top-matched comps best support the ARV.
Projected returns pro-forma
-3.0% appreciation · 8.0% rent growth · sell at horizon
- IRR
- 36.8%
- Equity multiple
- 2.67×
- Total profit
- $74,173
- Equity at exit
- $23,707
- IRR
- 45.8%
- Equity multiple
- 6.45×
- Total profit
- $242,580
- Equity at exit
- $13,747
Cash invested: $44,520 (down + closing). Projections, not guarantees.
Landlord ↔ Tenant lean methodology
- Overall (STATE)
- 18 Strongly Tenant-Friendly
- State California
- 18 Strongly Tenant-Friendly · D+13
- County
- — inherits STATE
- City
- — inherits STATE
ZIP-level market 91748
- Rents YoY
- 10.3%
- Active inventory
- 102
- Price-to-rent
- 4.6×
Monthly cashflow live
- Estimated rent
- $2,868 high interval (Pro) →
- Mortgage (P&I)
- −$834
- Tax from tax record
- −$34 /mo · $404/yr
- Insurance
- −$66
- HOA
- −$0
- Vacancy / Maint / Mgmt
- −$602
- Net cashflow
- $1,332
Break-even live
UW: 25.0% down · 7.5% · 30yr · 1.5% tax · 5.0% vac · 8.0% maint · 8.0% mgmt
Financing live
Cash to close
- Down payment
- $39,750
- Closing costs
- $4,770
- Reserves months
- —
- Total cash needed
- —
Loan-product check · same deal, 3 products live
Conventional
25% down · 7.5% · 30yr
- Down + closing
- —
- Monthly P&I
- —
- Monthly cashflow
- —
- DSCR
- —
- Eligible?
- —
Personal DTI + credit; lowest rate.
DSCR
20% down · 8.5% · 30yr
- Down + closing
- —
- Monthly P&I
- —
- Monthly cashflow
- —
- DSCR
- —
- Eligible?
- —
No personal income docs; deal must DSCR.
Hard money
10% down · 12.0% · 12mo
- Down + closing
- —
- Monthly P&I
- —
- Monthly cashflow
- —
- DSCR
- —
- Eligible?
- —
Short-term bridge; refi at stabilization.
Rent comps 20 comps
| Address | Beds | Baths | Sqft | Rent | $/sqft | DOM | Units | Dist |
|---|---|---|---|---|---|---|---|---|
| 18600 Colima Rd Rowland Heights, CA | 1.0–2.0 | 1.0 | 657 | $2,335 | $3.55 | 1d | 17 | 0.29mi |
| 18567 Colima Rd Rowland Heights, CA | 1.0–2.0 | 1.0–2.0 | 845 | $2,400 | $2.84 | 3d | 26 | 0.29mi |
| 18617 Trot Ave Rowland Heights, CA | 3.0 | 2.0 | 1251 | $3,350 | $2.68 | 17d | 1 | 0.33mi |
| 1439 S Jellick Ave Unit B Rowland Heights, CA | 2.0 | 1.5 | 1049 | $2,300 | $2.19 | 4d | 1 | 0.42mi |
| 19050 Colima Rd Rowland Heights, CA | 1.0–2.0 | 1.0–2.0 | 833 | $2,595 | $3.12 | 22d | 2 | 0.45mi |
| 19231 Tranbarger St Rowland Heights, CA | 3.0 | 2.0 | 1170 | $3,200 | $2.74 | 43d | 1 | 0.62mi |
| 18573 Farjardo St Rowland Heights, CA | 3.0 | 2.0 | 1300 | $3,750 | $2.88 | 43d | 1 | 0.74mi |
| 18658 Mescalero St Rowland Heights, CA | 3.0 | 2.0 | 1352 | $3,800 | $2.81 | 22d | 1 | 0.78mi |
| 18247 Via Calma #3 Rowland Heights, CA | 2.0 | 1.0 | 836 | $1,995 | $2.39 | 7d | 1 | 0.80mi |
| 1940 Fullerton Rd Rowland Heights, CA | 1.0–2.0 | 1.0 | 775 | $2,265 | $2.92 | 43d | 1 | 0.82mi |
| 2240 Electra Ave Rowland Heights, CA | 3.0 | 2.0 | 1256 | $3,200 | $2.55 | 17d | 1 | 0.99mi |
| 2415 Los Padres Dr Rowland Heights, CA | 3.0 | 2.0 | 1120 | $3,300 | $2.95 | 17d | 1 | 1.00mi |
| 2601 E Valley Blvd West Covina, CA | 1.0–2.0 | 1.0–2.0 | 925 | $2,650 | $2.86 | 7d | 3 | 1.00mi |
| 2243 Otterbein Ave Rowland Heights, CA | 3.0 | 2.0 | 1286 | $3,600 | $2.80 | 43d | 1 | 1.01mi |
| 18626 Barroso St Rowland Heights, CA | 3.0 | 2.0 | 1446 | $3,890 | $2.69 | 3d | 1 | 1.04mi |
| 2817 E Valley Blvd West Covina, CA | 3.0 | 2.0 | 1050 | $3,100 | $2.95 | 43d | 1 | 1.08mi |
| 2847 Valley Blvd West Covina, CA | 1.0–2.0 | 1.0 | 879 | $3,040 | $3.46 | 2d | 7 | 1.09mi |
| Searls Dr Unit A Rowland Heights, CA | 2.0 | 1.0 | 750 | $2,600 | $3.47 | 43d | 1 | 1.09mi |
| 2143 Arcdale Ave Rowland Heights, CA | 3.0 | 2.0 | 1386 | $3,500 | $2.53 | 24d | 1 | 1.20mi |
| 17800 Colima Rd Rowland Heights, CA | 1.0–2.0 | 1.0–2.0 | 775 | $2,880 | $3.72 | 5d | 8 | 1.34mi |
Listing history 18 events
-
2026-06-18days on market $159,000 Active 47 DOM
-
2026-06-17days on market $159,000 Active 46 DOM
-
2026-06-16days on market $159,000 Active 45 DOM
-
2026-06-15days on market $159,000 Active 44 DOM
-
2026-06-13days on market $159,000 Active 42 DOM
-
2026-06-13days on market $159,000 Active 41 DOM
-
2026-06-09days on market $159,000 Active 38 DOM
-
2026-06-08days on market $159,000 Active 37 DOM
-
2026-06-07days on market $159,000 Active 36 DOM
-
2026-06-04days on market $159,000 Active 33 DOM
-
2026-06-03days on market $159,000 Active 32 DOM
-
2026-06-02days on market $159,000 Active 31 DOM
-
2026-06-01days on market $159,000 Active 30 DOM
-
2026-05-31days on market $159,000 Active 29 DOM
-
2026-05-02$159,000 Active
-
2011-03-25soldstatus $39,000 Closed
-
2011-03-18status Pending
-
2011-03-13$39,900 Active
ⓘ Source: listings_history table (triggers on properties + properties_extension) + one-shot
backfill from property_details.listing_events for pre-trigger history.
Tax reassessment forecast CA · Resets to sale price
- Current annual tax
- $404 · $34/mo
- Projected year-2 tax
- $1,208 · $101/mo
- Expected delta
- +$805/yr (+$67/mo · 199.3%)
ⓘ Screening estimate from a state-policy table — verify with the county assessor before closing.
Climate risk First Street
- Flood 1/10 Low FEMA zone X (unshaded) · 0% chance over 30 yrs
- Wildfire 1/10 Low
- Heat 6/10 Major 7 d/yr ≥99°F today · 21 d/yr by 30 yrs out
- Wind 1/10 Low
- Air quality 7/10 Severe 13 unhealthy d/yr today · 14 by 30 yrs out
Nearby sold comps map
Loading sold comps map…
Walkable amenities ~0.75 mi
Loading nearby amenities…
Taxation est. · year 1
- Rental income
- $34,416
- − Mortgage interest
- −$8,906
- − Property taxes
- −$404
- − Insurance
- −$795
- − Repairs & maintenance
- −$2,753
- − Management
- −$2,753
- − Depreciation
- −$4,625
- Taxable income
- $14,179
- Est. tax owed @ 24.0%
- −$3,403
- After-tax cash flow
- $12,582/yr
For passive investors: Depreciation is non-cash, so a rental often shows a tax loss while cash-flowing — sheltering income. Rental losses are passive: they offset passive income freely, and up to $25,000/yr can offset ordinary (W-2) income if you actively participate and your MAGI is under $100k (phasing out to $0 by $150k); unused losses carry forward. On sale, claimed depreciation is recaptured at up to 25%, and gains may owe capital-gains tax (a 1031 exchange can defer both). Figures are a year-1 estimate at your 24.0% rate — not tax advice; consult a CPA.
Schools (NCES district)
- District
- Rowland Unified
- NCES district ID
- 0633750
- Math proficiency
- 40% ▼ -1.00%
- Reading proficiency
- 62% ▲ 11.00%
- Median HH income
- $63,667
- Composite
- 44.83/100
- National rank
- #2733
- State rank
- #134 of 517 in CA
Livability — Rowland Heights
- Score
- 50/100
- State rank
- #1123
- US rank
- #25637
Category grades
Schools grade is shown separately in the Schools card above.
Census & demographics
- Census place
- Rowland Heights, CA
- County
- Los Angeles County · 9,444,647 people
- City population
- 42,463
- Metro
- Los Angeles-Long Beach-Anaheim, CA
- Population (ZIP)
- 42,463
- Household income
- $83,428
- Rent vs Own
- Severe rent burden
- 1440.0
Population outlook (Los Angeles County) Hauer SSP2
- Today (2025)
- 10,940,515 people
- By 2030
- 11,256,481 · +2.9%
- By 2040
- 11,729,929 · +7.2%
- By 2050
- 11,948,407 · +9.2%
- By 2075
- 11,818,114 · +8.0%
- By 2100
- 10,842,928 · -0.9%
Race, ethnicity, and origin ACS 2023
- Neighborhood character
- Majority Asian (59%)
- Race & ethnicity
- Asian 59% Hispanic / Latino 31% Two or more races 6% White 6% Black 1%
- Hispanic origin (detail)
- Mexican 25%
- Foreign-born
- 55% · China, Canada, South Korea
- Languages at home
- 25% English-only · Chinese 37% Spanish 22% Tagalog/Filipino 5%
Political lean MEDSL · Los Angeles
- 2024 margin
- Solid D (+32.9) · D 64.8% · R 31.9% · Other 3.3%
- 2008→2024 swing
- -7.4pp toward R · 2008: 40.4pp · 2024: 32.9pp
- All cycles
- 2024: D+32.9 2020: D+44.2 2016: D+48.0 2012: D+40.0 2008: D+40.4
Not yet ingested
- Civics
- —
Market trends
- HPI YoY
- ▼ -754.24%
- Current HPI
- 364.5923
- Rent YoY
- ▲ 10.27%
- Metro
- Los Angeles-Long Beach-Anaheim, CA
- State GDP YoY
- ▲ 3.21%
- F500 in state
- 116
Industry mix (Fortune 500 HQ in CA)
| Industry | F500 HQs | Revenue |
|---|---|---|
| Technology | 27 | $1,492B |
|
||
| Financial Services | 3 | $174B |
|
||
| Retail | 3 | $44B |
|
||
| Insurance | 3 | $26B |
|
||
| Media / Entertainment | 2 | $115B |
|
||
| Pharmaceuticals / Biotech | 2 | $62B |
|
||
Price history
+298.5% since first listed4 events — show timeline
- 2026-05-02 Listed $159,000 CRMLS
- 2011-03-25 Sold (MLS) $39,000 CRMLS
- 2011-03-18 Pending — CRMLS
- 2011-03-13 Listed $39,900 CRMLS
Property tax history
+5.8%/yrLatest (2025): $404 · +5.8% YoY. Source: county tax records.
Cash-flow waterfall
monthlySold comps — $/sqft
last 12 mo · ≤1 miLoading sold comps…