2590 N Arbutus Ct · Midland, MI
Flood risk 1/10 · Minimal
- FEMA flood zone
- X (unshaded)
- Chance of flooding over 30 yrs
- 0.0%
- Est. flood insurance / yr
- $473 – $860
Fire risk 1/10 · Minimal
- Est. fire insurance / yr
- $784 – $1,456
Heat risk 2/10 · Minimal
- Hot days now (above 98°F)
- 7 days/yr
- Hot days in 30 yrs
- 13 days/yr
Wind risk 1/10 · Minimal
- Chance of severe wind over 30 yrs
- —
Air-quality risk 2/10 · Minimal
- Unhealthy air days now
- 1 days/yr
- Unhealthy air days in 30 yrs
- 1 days/yr
Risk factors via First Street. Map © Google.
Why this score? — see what drove the D- grade
The composite is a weighted blend of 9 inputs, each scored 0–100. Each bar is that input's sub-score; the figure is the points it added to the 100-point composite (weight × sub-score).
- Cash flow +13.1/30.0
- ARV discount +5.3/15.0
- Schools +4.9/10.0
- Livability +4.2/5.0
- DSCR +3.9/10.0
- 1% rule +3.0/10.0
- Rent growth +2.7/5.0
- Condition / age +2.5/5.0
- Appreciation +0.0/10.0
$240,000
🖨 Deal sheet (PDF) 📄 Offer letter ✓ Due diligence
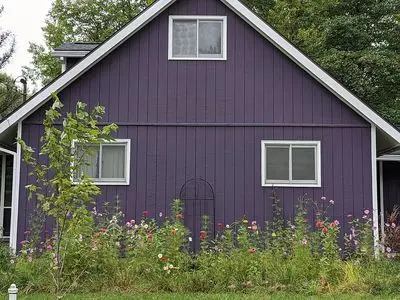
Listing remarks
Bungalow at the end of a court in a fantastic family friendly neighborhood. Recent updates include new flooring, drywall, paint (interior & amp; exterior) kitchen cabinets and counters and main level bathroom.
Key facts
- Built 1974
Neighborhood map
What this means for you Summary
Snapshot
- This is a 4-bed/2.0-bath single-family listed at $240k.
Deal economics
- At list price, monthly cash flow is $-9 ($-106/yr) — negative.
- To cash-flow at today's rent, offer at most $238k (0.6% below list).
- To meet the 1% rule (rent ≥ 1% of price), the offer needs to be $193k (19.7% below list).
- Recommended offer: $193k (19.7% below list) — sets the bar for 1% rule.
- Cap rate 6.2% vs local median 4.4% in Midland — top-decile yield for the area; either an underpriced asset or a hidden risk that comps aren't pricing in. Stress-test before assuming the spread holds.
Location & tenants
- Location reads 85/100 on livability (#28 in MI, #578 nationally) — a professional / high-income tenant draw. Strengths: crime A+, cost of living A+, housing A+; Watch: commute F.
- Midland Public Schools (urban): math 49% / reading 64% proficiency, ranked #62 of 540 in MI (top 12%) — acceptable for families but not a draw, mixed tenant base, ~2y average lease.
- Market conditions: Rents flat; 97 active listings in the ZIP; solid renter incomes; 320 units permitted in Midland County in 2024 (204 in 5+ unit buildings).
Forward outlook
- Local home prices are declining (-3.0%/yr); year-one equity from $2k of loan paydown is wiped out by about $7k of value loss. Plan a longer hold.
- Midland County population projected to shrink 9% by 2050 — rents likely to lag national; underwrite the cash flow, not the appreciation.
Negotiation context
- Only 0 days on market — expect competitive offers; lowballing is unlikely to land.
- Current owner paid $135k; list at $240k implies a 78% gain — meaningful room to come down on a strong offer.
Questions for the listing agent
- What do current leases actually rent for vs. the listed asking? Can we see a recent rent roll and the last 12 months of T-12 income?
- Built in 1974 — when were the roof, HVAC, electrical panel, plumbing, and water heater last replaced?
- Is there a deadline driving the sale (1031 exchange, divorce, estate, relocation)? That informs how much negotiation room exists.
- Schools are A-rated — typically a magnet for longer-tenancy family renters. What's the average tenant stay here, and is there a school-zone premium baked into asking?
- The area grade is low — what's the realistic commute time and amenity access for the typical tenant pool here? Any planned neighborhood developments (good or bad) we should know about?
- What's the average days-on-market for RENTAL listings here right now (not sales)? A rising rental-DOM trend means longer vacancies and softer asking-rent achievability than the comps imply.
- What's the recent tenant-quality profile in this submarket — average credit score on applications, eviction rate, late-payment / NSF rate, and stable-employment percentage? A property-management company in the area should have these aggregated.
- How much new for-sale + rental construction is in the pipeline within 1–3 miles? Heavy new supply typically softens prices + rents 12–24 months out; constrained supply supports both.
Investment metrics
- 1% rule
- 0.80% ✗
- Cap rate
- 6.25%
- Cash-on-cash
- -0.16%
- DSCR
- 0.99
- GRM
- 10.4
CMA / ARV
- ARV (on-the-fly)
- $228,920
- Comps found
- 1
Show comp detail 1 sale within ~0.75 mi
| Address | Dist | Beds/Ba | Sqft | Sold | Price | $/sf | Match |
|---|---|---|---|---|---|---|---|
| 3540 E Imrich Rd | 0.69mi | 3/2.0 (-1) | 1,210 (+2%) | 12mo | $235,000 | $194 | 49 |
Match score weights: distance 35% · size 25% · config 20% · recency 20%. Top-matched comps best support the ARV.
Projected returns pro-forma
-3.0% appreciation · 0.6% rent growth · sell at horizon
- IRR
- -19.1%
- Equity multiple
- 0.34×
- Total profit
- $-44,046
- Equity at exit
- $35,785
- IRR
- -17.1%
- Equity multiple
- 0.15×
- Total profit
- $-57,051
- Equity at exit
- $20,751
Cash invested: $67,200 (down + closing). Projections, not guarantees.
Landlord ↔ Tenant lean methodology
- Overall (STATE)
- 62 Landlord-Friendly
- State Michigan
- 62 Landlord-Friendly · EVEN
- County
- — inherits STATE
- City
- — inherits STATE
ZIP-level market 48642
- Home prices YoY
- -31.4%
- Rents YoY
- 0.6%
- Active inventory
- 97
- Price-to-rent
- 10.4×
Monthly cashflow live
- Estimated rent
- $1,927 medium interval (Pro) →
- Mortgage (P&I)
- −$1,259
- Tax from tax record
- −$173 /mo · $2,073/yr
- Insurance
- −$100
- HOA
- −$0
- Vacancy / Maint / Mgmt
- −$405
- Net cashflow
- $-9
Break-even live
Sensitivity live
| Price | -10% $127 | -5% $59 | +0% $-9 | +5% $-77 | +10% $-145 |
|---|---|---|---|---|---|
| Rent | -10% $-161 | -5% $-85 | +0% $-9 | +5% $67 | +10% $143 |
| Rate | -1.0pp $112 | -0.5pp $52 | base $-9 | +0.5pp $-71 | +1.0pp $-134 |
UW: 25.0% down · 7.5% · 30yr · 1.5% tax · 5.0% vac · 8.0% maint · 8.0% mgmt
Financing live
Cash to close
- Down payment
- $60,000
- Closing costs
- $7,200
- Reserves months
- —
- Total cash needed
- —
Loan-product check · same deal, 3 products live
Conventional
25% down · 7.5% · 30yr
- Down + closing
- —
- Monthly P&I
- —
- Monthly cashflow
- —
- DSCR
- —
- Eligible?
- —
Personal DTI + credit; lowest rate.
DSCR
20% down · 8.5% · 30yr
- Down + closing
- —
- Monthly P&I
- —
- Monthly cashflow
- —
- DSCR
- —
- Eligible?
- —
No personal income docs; deal must DSCR.
Hard money
10% down · 12.0% · 12mo
- Down + closing
- —
- Monthly P&I
- —
- Monthly cashflow
- —
- DSCR
- —
- Eligible?
- —
Short-term bridge; refi at stabilization.
Listing history 2 events
-
2026-06-10remarks 209-char remark
-
2026-06-10$240,000 Under Contract
ⓘ Source: listings_history table (triggers on properties + properties_extension) + one-shot
backfill from property_details.listing_events for pre-trigger history.
Tax reassessment forecast MI · Partial reset (capped growth)
- Current annual tax
- $2,073 · $173/mo
- Projected year-2 tax
- $2,885 · $240/mo
- Expected delta
- +$811/yr (+$68/mo · 39.1%)
ⓘ Screening estimate from a state-policy table — verify with the county assessor before closing.
Climate risk First Street
- Flood 1/10 Low FEMA zone X (unshaded) · 0% chance over 30 yrs
- Wildfire 1/10 Low
- Heat 2/10 Low 7 d/yr ≥98°F today · 13 d/yr by 30 yrs out
- Wind 1/10 Low
- Air quality 2/10 Low 1 unhealthy d/yr today · 1 by 30 yrs out
Nearby sold comps map
Loading sold comps map…
Walkable amenities ~0.75 mi
Loading nearby amenities…
Taxation est. · year 1
- Rental income
- $23,127
- − Mortgage interest
- −$13,444
- − Property taxes
- −$2,073
- − Insurance
- −$1,200
- − Repairs & maintenance
- −$1,850
- − Management
- −$1,850
- − Depreciation
- −$6,982
- Taxable loss
- −$4,272
- Est. tax savings @ 24.0%
- +$1,025
- After-tax cash flow
- $920/yr
For passive investors: Depreciation is non-cash, so a rental often shows a tax loss while cash-flowing — sheltering income. Rental losses are passive: they offset passive income freely, and up to $25,000/yr can offset ordinary (W-2) income if you actively participate and your MAGI is under $100k (phasing out to $0 by $150k); unused losses carry forward. On sale, claimed depreciation is recaptured at up to 25%, and gains may owe capital-gains tax (a 1031 exchange can defer both). Figures are a year-1 estimate at your 24.0% rate — not tax advice; consult a CPA.
Schools (NCES district)
- District
- Midland Public Schools
- NCES district ID
- 2623820
- Math proficiency
- 49% ▼ -6.00%
- Reading proficiency
- 64% ▼ -3.00%
- Median HH income
- $55,844
- Composite
- 48.67/100
- National rank
- #2105
- State rank
- #62 of 540 in MI
Livability — Midland
- Score
- 85/100
- State rank
- #28
- US rank
- #578
Category grades
Schools grade is shown separately in the Schools card above.
Census & demographics
- County
- Midland County · 66,531 people
- City population
- 66,531
- Metro
- Midland, MI
- Population (ZIP)
- 34,039
- Household income
- $77,847
- Rent vs Own
- Severe rent burden
- 935.0
Population outlook (Midland County) Hauer SSP2
- Today (2025)
- 83,968 people
- By 2030
- 83,368 · -0.7%
- By 2040
- 80,713 · -3.9%
- By 2050
- 76,698 · -8.7%
- By 2075
- 67,617 · -19.5%
- By 2100
- 57,529 · -31.5%
Race, ethnicity, and origin ACS 2023
- Neighborhood character
- Predominantly White (88%)
- Race & ethnicity
- White 88% Hispanic / Latino 4% Asian 4% Two or more races 3% Black 2%
- Common ancestry
- Romanian 8% Lithuanian 5% Italian 3%
- Foreign-born
- 5% · Canada, China, Vietnam
- Languages at home
- 95% English-only · Other Indo-European 1% Spanish 1% Chinese 1%
Political lean MEDSL · Midland
- 2024 margin
- R (+15.2) · D 41.6% · R 56.8% · Other 1.6%
- 2008→2024 swing
- -11.6pp toward R · 2008: -3.6pp · 2024: -15.2pp
- All cycles
- 2024: R+15.2 2020: R+14.6 2016: R+19.4 2012: R+15.5 2008: R+3.6
Not yet ingested
- Civics
- —
Market trends
- HPI YoY
- ▼ -87.89%
- Current HPI
- 192.0812
- Rent YoY
- ▲ 0.60%
- Metro
- Midland, MI
- State GDP YoY
- ▲ 1.37%
- F500 in state
- 28
Industry mix (Fortune 500 HQ in MI)
| Industry | F500 HQs | Revenue |
|---|---|---|
| Automotive Parts | 3 | $48B |
|
||
| Automotive | 2 | $372B |
|
||
| Chemicals | 1 | $45B |
|
||
| Automotive Retail | 1 | $29B |
|
||
| Healthcare / Medical Devices | 1 | $23B |
|
||
| Automotive Technology | 1 | $20B |
|
||
Price history
+189.2% since first listed5 events — show timeline
- 2026-06-10 Listed $240,000 FSBO.com
- 2017-08-18 Sold (Public Records) $135,000 Public Records
- 2004-03-05 Sold (Public Records) $135,100 Public Records
- 1999-04-29 Sold (Public Records) $117,500 Public Records
- 1991-05-01 Sold (Public Records) $83,000 Public Records
Property tax history
+1.0%/yrLatest (2024): $2,073 · +6.4% YoY. Source: county tax records.
Cash-flow waterfall
monthlySold comps — $/sqft
last 12 mo · ≤1 miLoading sold comps…