304 S 5th Ave · Windsor, IL
Flood risk 1/10 · Minimal
- FEMA flood zone
- X (unshaded)
- Chance of flooding over 30 yrs
- 0.0%
- Est. flood insurance / yr
- $473 – $860
Fire risk 1/10 · Minimal
- Est. fire insurance / yr
- $804 – $1,492
Heat risk 3/10 · Minor
- Hot days now (above 104°F)
- 7 days/yr
- Hot days in 30 yrs
- 17 days/yr
Wind risk 2/10 · Minimal
- Chance of severe wind over 30 yrs
- —
Air-quality risk 3/10 · Minor
- Unhealthy air days now
- 2 days/yr
- Unhealthy air days in 30 yrs
- 3 days/yr
Risk factors via First Street. Map © Google.
Why this score? — see what drove the C+ grade
The composite is a weighted blend of 9 inputs, each scored 0–100. Each bar is that input's sub-score; the figure is the points it added to the 100-point composite (weight × sub-score).
- Cash flow +18.5/30.0
- ARV discount +15.0/15.0
- Appreciation +6.9/10.0
- DSCR +5.8/10.0
- 1% rule +5.1/10.0
- Livability +3.1/5.0
- Schools +2.7/10.0
- Rent growth +2.5/5.0
- Condition / age +2.5/5.0
$115,000
🖨 Deal sheet 📄 Offer letter ✓ Due diligence
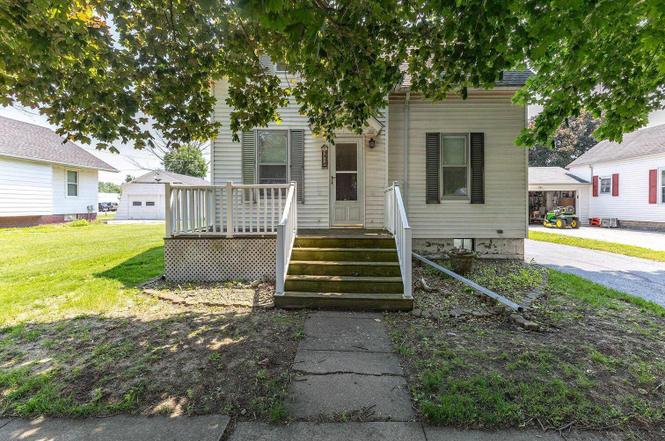
Listing remarks
Nice solid 3-bedroom 2-bath home in the heart of New Windsor. This home has plenty of space for entertaining. Great solid wood cabinets in the kitchen with a nice breakfast bar that looks into the dining room. The family room has a nice gas fireplace for cozy nights. Convenient first-floor laundry. Large 2 car garage with 9ft tall door and log heater. This is a great space for projects.
Key facts
- Solid wood cabinets
- Large garage
- Gas fireplace
Tags
Neighborhood map
What this means for you Summary
Snapshot
- This is a 3-bed/2.0-bath single-family listed at $115k.
Deal economics
- At list price, monthly cash flow is $109 ($1k/yr) — positive.
- The deal already cash-flows at list — no discount required.
- Meets the 1% rule at list price ($1k rent vs $115k).
Location & tenants
- Location reads 62/100 on livability (#847 in IL) — a middle-class / working-renter tenant base. Strengths: cost of living A+, housing A+, crime A; Watch: schools F, amenities F, commute F.
- Sherrard CUSD 200 (rural): math 29% / reading 30% proficiency, ranked #240 of 620 in IL (top 39%) — low school quality limits family demand, transient renter base, plan for 1-2y turnover.
- Market conditions: 7 active listings in the ZIP; 15 units permitted in Mercer County in 2024 (0 in 5+ unit buildings).
Forward outlook
- In year one you build about $5k of equity ($795 loan paydown + $4k appreciation (3.8% local appreciation)).
- Mercer County population projected at -25% by 2050 — secular population decline; favor cash flow + early exit over multi-decade hold.
- At projected returns (3.8% appreciation + 3.0% rent growth), your $32k cash investment doubles in ~5 years — after that, you're playing with house money.
- By year 7, paydown + projected appreciation supports a ~$33k cash-out refi (75% LTV) — recoverable capital for the next deal without selling this one.
Negotiation context
- Only 7 days on market — expect competitive offers; lowballing is unlikely to land.
Risks & watch-outs
- Watch-outs: built in 1936 — expect roof / HVAC / electrical / plumbing capex.
Questions for the listing agent
- Built in 1936 — when were the roof, HVAC, electrical panel, plumbing, and water heater last replaced?
- Is there a deadline driving the sale (1031 exchange, divorce, estate, relocation)? That informs how much negotiation room exists.
- Schools are F-rated, which usually means shorter tenancies and higher turnover. Who's the typical renter profile here, and what's been the actual vacancy rate?
- What's the average days-on-market for RENTAL listings here right now (not sales)? A rising rental-DOM trend means longer vacancies and softer asking-rent achievability than the comps imply.
- What's the recent tenant-quality profile in this submarket — average credit score on applications, eviction rate, late-payment / NSF rate, and stable-employment percentage? A property-management company in the area should have these aggregated.
- How much new for-sale + rental construction is in the pipeline within 1–3 miles? Heavy new supply typically softens prices + rents 12–24 months out; constrained supply supports both.
Investment metrics
- 1% rule
- 1.01% ✓
- Cap rate
- 7.43%
- Cash-on-cash
- 4.05%
- DSCR
- 1.18
- GRM
- 8.3
CMA / ARV
- ARV (on-the-fly)
- $191,268
- Comps found
- 5
Show comp detail 5 sales within ~0.75 mi
| Address | Dist | Beds/Ba | Sqft | Sold | Price | $/sf | Match |
|---|---|---|---|---|---|---|---|
| 304 S 5th Ave | 0.00mi | 3/2.0 | 1,386 (0%) | 5mo | $110,000 | $79 | 96 |
| 101 N 6th Ave | 0.16mi | 3/1.5 | 1,242 (-10%) | 1mo | $180,000 | $145 | 72 |
| 704 Washington St | 0.30mi | 3/1.0 | 1,289 (-7%) | 10mo | $135,000 | $105 | 61 |
| 305 S 11th Ave | 0.41mi | 3/2.0 | 1,248 (-10%) | 17mo | $172,000 | $138 | 50 |
| 500 N 7th Ave | 0.42mi | 4/3.0 (+1) | 1,568 (+13%) | 3mo | $260,000 | $166 | 47 |
Match score weights: distance 35% · size 25% · config 20% · recency 20%. Top-matched comps best support the ARV.
Projected returns pro-forma
3.81% appreciation · 3.0% rent growth · sell at horizon
- IRR
- 13.4%
- Equity multiple
- 1.80×
- Total profit
- $25,791
- Equity at exit
- $57,023
- IRR
- 14.8%
- Equity multiple
- 3.37×
- Total profit
- $76,203
- Equity at exit
- $92,256
Cash invested: $32,200 (down + closing). Projections, not guarantees.
Landlord ↔ Tenant lean methodology
- Overall (STATE)
- 43 Moderately Tenant-Leaning
- State Illinois
- 43 Moderately Tenant-Leaning · D+7
- County
- — inherits STATE
- City
- — inherits STATE
ZIP-level market 61465
- Home prices YoY
- 3.6%
- Active inventory
- 7
- Price-to-rent
- 8.3×
Monthly cashflow live
- Estimated rent
- $1,159 medium interval (Pro) →
- Mortgage (P&I)
- −$603
- Tax from tax record
- −$156 /mo · $1,873/yr
- Insurance
- −$48
- HOA
- −$0
- Vacancy / Maint / Mgmt
- −$243
- Net cashflow
- $109
Break-even live
UW: 25.0% down · 7.5% · 30yr · 1.5% tax · 5.0% vac · 8.0% maint · 8.0% mgmt
Financing live
Cash to close
- Down payment
- $28,750
- Closing costs
- $3,450
- Reserves months
- —
- Total cash needed
- —
Loan-product check · same deal, 3 products live
Conventional
25% down · 7.5% · 30yr
- Down + closing
- —
- Monthly P&I
- —
- Monthly cashflow
- —
- DSCR
- —
- Eligible?
- —
Personal DTI + credit; lowest rate.
DSCR
20% down · 8.5% · 30yr
- Down + closing
- —
- Monthly P&I
- —
- Monthly cashflow
- —
- DSCR
- —
- Eligible?
- —
No personal income docs; deal must DSCR.
Hard money
10% down · 12.0% · 12mo
- Down + closing
- —
- Monthly P&I
- —
- Monthly cashflow
- —
- DSCR
- —
- Eligible?
- —
Short-term bridge; refi at stabilization.
Listing history 17 events
-
2026-05-24status Pending
-
2026-05-24status Pending
-
2026-05-23status Pending
-
2026-01-30soldstatus $110,000 Closed
-
2026-01-30soldstatus $110,000 Closed
-
2026-01-30soldstatus $110,000 Closed
-
2026-01-30soldstatus $110,000 Closed
-
2026-01-16status Pending
-
2026-01-14historical
-
2026-01-08status Pending
-
2026-01-06historical
-
2026-01-05historical
-
2025-12-31status Pending
-
2025-12-31status Active
-
2025-12-24historical
-
2025-08-14price
-
2025-06-13Active
ⓘ Source: listings_history table (triggers on properties + properties_extension) + one-shot
backfill from property_details.listing_events for pre-trigger history.
Tax reassessment forecast IL · Partial reset (capped growth)
- Current annual tax
- $1,873 · $156/mo
- Projected year-2 tax
- $2,242 · $187/mo
- Expected delta
- +$369/yr (+$31/mo · 19.7%)
ⓘ Screening estimate from a state-policy table — verify with the county assessor before closing.
Climate risk First Street
- Flood 1/10 Low FEMA zone X (unshaded) · 0% chance over 30 yrs
- Wildfire 1/10 Low
- Heat 3/10 Moderate 7 d/yr ≥104°F today · 17 d/yr by 30 yrs out
- Wind 2/10 Low
- Air quality 3/10 Moderate 2 unhealthy d/yr today · 3 by 30 yrs out
Nearby sold comps map
Loading sold comps map…
Walkable amenities ~0.75 mi
Loading nearby amenities…
Taxation est. · year 1
- Rental income
- $13,910
- − Mortgage interest
- −$6,442
- − Property taxes
- −$1,873
- − Insurance
- −$575
- − Repairs & maintenance
- −$1,113
- − Management
- −$1,113
- − Depreciation
- −$3,345
- Taxable loss
- −$551
- Est. tax savings @ 24.0%
- +$132
- After-tax cash flow
- $1,436/yr
For passive investors: Depreciation is non-cash, so a rental often shows a tax loss while cash-flowing — sheltering income. Rental losses are passive: they offset passive income freely, and up to $25,000/yr can offset ordinary (W-2) income if you actively participate and your MAGI is under $100k (phasing out to $0 by $150k); unused losses carry forward. On sale, claimed depreciation is recaptured at up to 25%, and gains may owe capital-gains tax (a 1031 exchange can defer both). Figures are a year-1 estimate at your 24.0% rate — not tax advice; consult a CPA.
Schools (NCES district)
- District
- Sherrard CUSD 200
- NCES district ID
- 1736180
- Math proficiency
- 29% ▼ -9.00%
- Reading proficiency
- 30% ▼ -16.00%
- Median HH income
- $60,194
- Composite
- 26.77/100
- National rank
- #7129
- State rank
- #240 of 620 in IL
Livability — Windsor
- Score
- 62/100
- State rank
- #847
- US rank
- #16662
Category grades
Schools grade is shown separately in the Schools card above.
Census & demographics
- Census place
- Windsor, IL
- Population (ZIP)
- 1,251
Population outlook (Mercer County) Hauer SSP2
- Today (2025)
- 14,595 people
- By 2030
- 13,846 · -5.1%
- By 2040
- 12,335 · -15.5%
- By 2050
- 10,893 · -25.4%
- By 2075
- 8,238 · -43.6%
- By 2100
- 6,111 · -58.1%
Race, ethnicity, and origin ACS 2023
- Neighborhood character
- Predominantly White (89%)
- Race & ethnicity
- White 89% Two or more races 8% Hispanic / Latino 4%
- Common ancestry
- English 5% Serbian 1% Portuguese 1%
- Foreign-born
- 0%
- Languages at home
- 98% English-only · Other Asian/Pacific 2%
Political lean MEDSL · Mercer
- 2024 margin
- Strong R (+27.1) · D 35.4% · R 62.5% · Other 2.2%
- 2008→2024 swing
- -39.0pp toward R · 2008: 11.9pp · 2024: -27.1pp
- All cycles
- 2024: R+27.1 2020: R+24.0 2016: R+20.7 2012: D+7.4 2008: D+11.9
Not yet ingested
- Civics
- —
Market trends
- HPI YoY
- ▲ 3.81%
- Current HPI
- 108.3507
- Rent YoY
- —
- Metro
- —
- State GDP YoY
- ▲ 1.59%
- F500 in state
- 60
Industry mix (Fortune 500 HQ in IL)
| Industry | F500 HQs | Revenue |
|---|---|---|
| Insurance | 4 | $201B |
|
||
| Consumer Goods | 4 | $87B |
|
||
| Industrial Machinery | 3 | $64B |
|
||
| Healthcare | 2 | $55B |
|
||
| Retail / Pharmacy | 1 | $148B |
|
||
| Agriculture / Food | 1 | $86B |
|
||
Price history
+0.0% since first listed17 events — show timeline
- 2026-05-24 Pending — MRED as Distributed by MLS Grid
- 2026-05-24 Pending — MRED as Distributed by MLS Grid
- 2026-05-23 Pending — MRED as Distributed by MLS Grid
- 2026-01-30 Sold (MLS) $110,000 MRED as Distributed by MLS Grid
- 2026-01-30 Sold (MLS) $110,000 MRED as Distributed by MLS Grid
- 2026-01-30 Sold (MLS) $110,000 MRED as Distributed by MLS Grid
- 2026-01-30 Sold (MLS) $110,000 MRED as Distributed by MLS Grid
- 2026-01-16 Pending — MRED as Distributed by MLS Grid
- 2026-01-14 Listing Removed — MRED as Distributed by MLS Grid
- 2026-01-08 Pending — MRED as Distributed by MLS Grid
- 2026-01-06 Listing Removed — RMLSA as Distributed by MLS Grid
- 2026-01-05 Listing Removed — MRED as Distributed by MLS Grid
- 2025-12-31 Pending — MRED as Distributed by MLS Grid
- 2025-12-31 Relisted — MRED as Distributed by MLS Grid
- 2025-12-24 Listing Removed — MRED as Distributed by MLS Grid
- 2025-08-14 Price Changed — RMLSA as Distributed by MLS Grid
- 2025-06-13 Listed — RMLSA as Distributed by MLS Grid
Property tax history
+6.8%/yrLatest (2024): $1,873 · +116.7% YoY. Source: county tax records.
Cash-flow waterfall
monthlySold comps — $/sqft
last 12 mo · ≤1 miLoading sold comps…