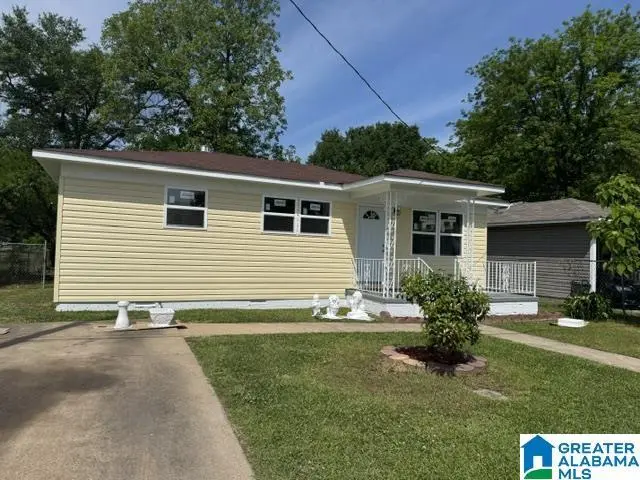
602 N 6th Ave · Bessemer, AL
Flood risk 1/10 · Minimal
- FEMA flood zone
- X (unshaded)
- Chance of flooding over 30 yrs
- 0.0%
- Est. flood insurance / yr
- $507 – $1,088
Fire risk 3/10 · Minor
- Est. fire insurance / yr
- $916 – $1,700
Heat risk 7/10 · Major
- Hot days now (above 108°F)
- 7 days/yr
- Hot days in 30 yrs
- 20 days/yr
Wind risk 6/10 · Moderate
- Chance of severe wind over 30 yrs
- 35.0%
Air-quality risk 3/10 · Minor
- Unhealthy air days now
- 2 days/yr
- Unhealthy air days in 30 yrs
- 5 days/yr
Risk factors via First Street. Map © Google.
Why this score? — see what drove the C- grade
The composite is a weighted blend of 9 inputs, each scored 0–100. Each bar is that input's sub-score; the figure is the points it added to the 100-point composite (weight × sub-score).
- Cash flow +22.9/30.0
- ARV discount +7.5/15.0
- DSCR +7.3/10.0
- 1% rule +5.3/10.0
- Livability +3.0/5.0
- Condition / age +2.5/5.0
- Rent growth +1.7/5.0
- Schools +0.8/10.0
- Appreciation +0.0/10.0
$98,900
🖨 Deal sheet 📄 Offer letter ✓ Due diligence
Listing remarks
Newly renovated and move-in ready! This beautiful home at 602 6th Avenue N in Bessemer is just 5 minutes from downtown, with a grocery store conveniently located right across the street. Enjoy modern updates, comfort, and an unbeatable location all in one! REALTOR IS ALSO THE OWNER!
Key facts
- Move in ready
- Unbeatable location
- Newly renovated
Tags
Property features AI
Finance
- Other: Lot size approximately 0.17 acres; Located in the Jonesboro subdivision
Exterior
- Parking: Driveway parking
- Security: No security features listed
- Utilities: Public water; Connected sewer; Electric water heater; Internet service available
- Home design: Single-family existing construction; Vinyl siding; Crawl space foundation
- Construction: Vinyl siding construction
- Exterior features: Fenced yard; Storage building; Porch; Garden area
Interior
- Kitchen: Tile countertops in the kitchen; Electric oven; Electric stove
- Bedrooms: Three bedrooms on the main level
- Flooring: Hardwood laminate; Tile flooring
- Bathrooms: One full bathroom with a separate shower
- Heating & cooling: Central heating; Central cooling
- Interior features: Smooth ceilings; No additional interior features listed
- Laundry & utility: Main-level laundry room; Washer hookup; Electric dryer hookup
Neighborhood map
What this means for you Summary
Snapshot
- This is a 2-bed/1.0-bath single-family listed at $99k.
Deal economics
- At list price, monthly cash flow is $173 ($2k/yr) — positive.
- The deal already cash-flows at list — no discount required.
- Meets the 1% rule at list price ($1k rent vs $99k).
- Cap rate 8.4% vs local median 5.9% in Bessemer — top-decile yield for the area; either an underpriced asset or a hidden risk that comps aren't pricing in. Stress-test before assuming the spread holds.
Location & tenants
- Location reads 59/100 on livability (#331 in AL) — a working-class tenant base; expect higher turnover. Strengths: commute A+, cost of living A+, housing A; Watch: crime F, amenities F, employment F.
- Bessemer City (suburban): math 3% / reading 19% proficiency, ranked #120 of 129 in AL (top 93%) — low school quality limits family demand, transient renter base, plan for 1-2y turnover; 87% free/reduced lunch — lower-income household profile, screen leases tightly.
- Zoned schools: Jonesboro Elementary School (math 3% / reading 15%, grade F, #593 of 627 statewide, top 95%, 525 students, 78% FRL); Bessemer City High School (math 2% / reading 8%, grade F, #276 of 305 statewide, top 95%, 850 students, 61% FRL) — zoned schools average 70% FRL vs 87% district-wide (17 pts lower); this property's tenant base skews higher-income than the district average.
- Market conditions: Rents falling (-3.1%/yr); 115 active listings in the ZIP; 23 comparable units currently listed for rent nearby; rentals at typical pace (median 16d on market — plan ~3-4 weeks tenant-placement turnaround); lower-income renter base — watch delinquency; 2,114 units permitted in Jefferson County in 2024 (556 in 5+ unit buildings).
- This rent runs 35% of the median local income ($35k/yr) — at the standard rent-burdened threshold; future hikes will face affordability resistance.
Forward outlook
- Local home prices are declining (-3.0%/yr); year-one equity from $684 of loan paydown is wiped out by about $3k of value loss. Plan a longer hold.
- Jefferson County population projected to shrink 4% by 2050 — rents likely to lag national; underwrite the cash flow, not the appreciation.
Negotiation context
- Only 7 days on market — expect competitive offers; lowballing is unlikely to land.
Risks & watch-outs
- Watch-outs: built in 1955 — expect roof / HVAC / electrical / plumbing capex.
- Climate carrying-cost: major wind risk, 35% chance of damaging wind over 30y; extreme-heat days projected 7→20/yr by 2055 (HVAC capex compounding) — expect insurance premiums to compound above CPI over the hold.
Questions for the listing agent
- Built in 1955 — when were the roof, HVAC, electrical panel, plumbing, and water heater last replaced?
- Is there a deadline driving the sale (1031 exchange, divorce, estate, relocation)? That informs how much negotiation room exists.
- Schools are D-rated, which usually means shorter tenancies and higher turnover. Who's the typical renter profile here, and what's been the actual vacancy rate?
- Crime grade is F in this area — have there been break-ins, vandalism, or insurance claims at this property in the last 3 years? What carrier currently insures it and at what premium?
- What's the average days-on-market for RENTAL listings here right now (not sales)? A rising rental-DOM trend means longer vacancies and softer asking-rent achievability than the comps imply.
- What's the recent tenant-quality profile in this submarket — average credit score on applications, eviction rate, late-payment / NSF rate, and stable-employment percentage? A property-management company in the area should have these aggregated.
- How much new for-sale + rental construction is in the pipeline within 1–3 miles? Heavy new supply typically softens prices + rents 12–24 months out; constrained supply supports both.
Investment metrics
- 1% rule
- 1.03% ✓
- Cap rate
- 8.39%
- Cash-on-cash
- 7.50%
- DSCR
- 1.33
- GRM
- 8.1
CMA / ARV
- ARV (on-the-fly)
- $59,904
- Comps found
- 9
Show comp detail 9 sales within ~0.75 mi
| Address | Dist | Beds/Ba | Sqft | Sold | Price | $/sf | Match |
|---|---|---|---|---|---|---|---|
| 600 6th Ave N | 0.01mi | 3/1.0 (+1) | 1,040 (+11%) | 7mo | $65,000 | $63 | 70 |
| 413 Ash Ave | 0.58mi | 3/1.0 (+1) | 936 (0%) | 1mo | $60,000 | $64 | 67 |
| 531 W Lake Dr | 0.29mi | 3/1.0 (+1) | 1,014 (+8%) | 3mo | $61,500 | $61 | 65 |
| 505 W Lake Dr | 0.27mi | 3/1.0 (+1) | 980 (+5%) | 22mo | $92,000 | $94 | 56 |
| 28 Martin St | 0.61mi | 2/1.0 | 952 (+2%) | 17mo | $24,000 | $25 | 55 |
| 1024 9th St N | 0.54mi | 3/1.0 (+1) | 980 (+5%) | 9mo | $134,000 | $137 | 54 |
| 402 Black Ave | 0.53mi | 2/1.0 | 952 (+2%) | 23mo | $67,900 | $71 | 53 |
| 300 Norwood Ave | 0.68mi | 3/1.0 (+1) | 966 (+3%) | 10mo | $124,000 | $128 | 50 |
| 600 Mcadory Ave | 0.46mi | 3/2.0 (+1) | 1,014 (+8%) | 16mo | $55,000 | $54 | 42 |
Match score weights: distance 35% · size 25% · config 20% · recency 20%. Top-matched comps best support the ARV.
Projected returns pro-forma
-3.0% appreciation · 0.0% rent growth · sell at horizon
- IRR
- -8.1%
- Equity multiple
- 0.71×
- Total profit
- $-8,011
- Equity at exit
- $14,746
- IRR
- -2.7%
- Equity multiple
- 0.84×
- Total profit
- $-4,419
- Equity at exit
- $8,551
Cash invested: $27,692 (down + closing). Projections, not guarantees.
Landlord ↔ Tenant lean methodology
- Overall (STATE)
- 90 Strongly Landlord-Friendly
- State Alabama
- 90 Strongly Landlord-Friendly · R+15
- County
- — inherits STATE
- City
- — inherits STATE
ZIP-level market 35020
- Home prices YoY
- -24.2%
- Rents YoY
- -3.1%
- Active inventory
- 115
- Price-to-rent
- 8.1×
Monthly cashflow live
- Estimated rent
- $1,023 high interval (Pro) →
- Mortgage (P&I)
- −$519
- Tax from tax record
- −$75 /mo · $899/yr
- Insurance
- −$41
- HOA
- −$0
- Vacancy / Maint / Mgmt
- −$215
- Net cashflow
- $173
Break-even live
UW: 25.0% down · 7.5% · 30yr · 1.5% tax · 5.0% vac · 8.0% maint · 8.0% mgmt
Financing live
Cash to close
- Down payment
- $24,725
- Closing costs
- $2,967
- Reserves months
- —
- Total cash needed
- —
Loan-product check · same deal, 3 products live
Conventional
25% down · 7.5% · 30yr
- Down + closing
- —
- Monthly P&I
- —
- Monthly cashflow
- —
- DSCR
- —
- Eligible?
- —
Personal DTI + credit; lowest rate.
DSCR
20% down · 8.5% · 30yr
- Down + closing
- —
- Monthly P&I
- —
- Monthly cashflow
- —
- DSCR
- —
- Eligible?
- —
No personal income docs; deal must DSCR.
Hard money
10% down · 12.0% · 12mo
- Down + closing
- —
- Monthly P&I
- —
- Monthly cashflow
- —
- DSCR
- —
- Eligible?
- —
Short-term bridge; refi at stabilization.
Rent comps 23 comps
| Address | Beds | Baths | Sqft | Rent | $/sqft | DOM | Units | Dist |
|---|---|---|---|---|---|---|---|---|
| 806 4th Ave N Bessemer, AL | 3.0 | 1.0 | 1092 | $1,050 | $0.96 | 23d | 1 | 0.17mi |
| 830 5th Ave N Bessemer, AL | 3.0 | 1.0 | 1072 | $1,000 | $0.93 | 43d | 1 | 0.23mi |
| 531 W Lake Dr Bessemer, AL | 3.0 | 1.0 | 1014 | $1,200 | $1.18 | 3d | 1 | 0.30mi |
| 510 W Lake Dr Bessemer, AL | 3.0 | 1.0 | 950 | $1,025 | $1.08 | 16d | 1 | 0.31mi |
| 512 W Lake Dr Bessemer, AL | 3.0 | 1.0 | 944 | $1,125 | $1.19 | 11d | 1 | 0.31mi |
| 410 W Lake Dr Bessemer, AL | 2.0 | 1.0 | 780 | $875 | $1.12 | 10d | 1 | 0.32mi |
| 208 9th Ct S Bessemer, AL | 2.0 | 1.0 | 784 | $650 | $0.83 | 23d | 1 | 0.57mi |
| 622 Jefferson Ave Unit 622 Bessemer, AL | 2.0 | 1.0 | 800 | $850 | $1.06 | 3d | 1 | 0.63mi |
| 622 Jefferson Ave Bessemer, AL | 2.0 | 1.0 | 800 | $850 | $1.06 | 21d | 1 | 0.63mi |
| 1015 11th St N Bessemer, AL | 2.0 | 1.0 | 876 | $975 | $1.11 | 11d | 1 | 0.64mi |
| 300 Norwood Ave Bessemer, AL | 3.0 | 1.0 | 966 | $1,000 | $1.04 | 23d | 1 | 0.67mi |
| 300 Norwood Ave Bessemer, AL | 3.0 | 1.0 | 966 | $900 | $0.93 | 11d | 1 | 0.67mi |
| 931 Dartmouth Ave Bessemer, AL | 3.0 | 1.0 | 984 | $925 | $0.94 | 43d | 1 | 0.80mi |
| 817 15th St N Bessemer, AL | 3.0 | 2.0 | 1116 | $1,125 | $1.01 | 3d | 1 | 0.86mi |
| 808 Fairfax Ave Bessemer, AL | 3.0 | 1.0 | 1042 | $1,050 | $1.01 | 23d | 1 | 0.90mi |
| 810 Fairfax Ave Bessemer, AL | 3.0 | 1.0 | 1042 | $1,050 | $1.01 | 23d | 1 | 0.90mi |
| 719 16th St N Bessemer, AL | 3.0 | 1.5 | 1085 | $1,075 | $0.99 | 23d | 1 | 0.92mi |
| 306 W Lake Cir SW Bessemer, AL | 1.0–3.0 | 1.0–2.0 | 1004 | $1,089 | $1.08 | 1d | 1 | 1.02mi |
| 1622 Fairfax Ave Bessemer, AL | 2.0 | 2.0 | 1104 | $995 | $0.90 | 2d | 1 | 1.30mi |
| 420 19th St S Bessemer, AL | 2.0 | 1.0 | 910 | $850 | $0.93 | 43d | 1 | 1.38mi |
| 1830 Exeter Ave Bessemer, AL | 2.0 | 1.0 | 913 | $850 | $0.93 | 43d | 1 | 1.39mi |
| 1600 Holbrook Ave Bessemer, AL | 3.0 | 1.0 | 885 | $999 | $1.13 | 2d | 1 | 1.39mi |
| 2123 Arlington Ave Bessemer, AL | 3.0 | 1.0 | 616 | $950 | $1.54 | 16d | 1 | 1.48mi |
Listing history 3 events
-
2026-04-29status Pending
-
2026-04-22$98,900 Active
-
2025-12-16price $53,500
ⓘ Source: listings_history table (triggers on properties + properties_extension) + one-shot
backfill from property_details.listing_events for pre-trigger history.
Tax reassessment forecast AL · Resets to sale price
- Current annual tax
- $899 · $75/mo
- Projected year-2 tax
- $899 · $75/mo
- Expected delta
- $0/yr ($0/mo · 0.0%)
ⓘ Screening estimate from a state-policy table — verify with the county assessor before closing.
Climate risk First Street
- Flood 1/10 Low FEMA zone X (unshaded) · 0% chance over 30 yrs
- Wildfire 3/10 Moderate
- Heat 7/10 Severe 7 d/yr ≥108°F today · 20 d/yr by 30 yrs out
- Wind 6/10 Major 35% chance of damaging wind over 30 yrs
- Air quality 3/10 Moderate 2 unhealthy d/yr today · 5 by 30 yrs out
Nearby sold comps map
Loading sold comps map…
Walkable amenities ~0.75 mi
Loading nearby amenities…
Taxation est. · year 1
- Rental income
- $12,271
- − Mortgage interest
- −$5,540
- − Property taxes
- −$899
- − Insurance
- −$494
- − Repairs & maintenance
- −$982
- − Management
- −$982
- − Depreciation
- −$2,877
- Taxable income
- $498
- Est. tax owed @ 24.0%
- −$119
- After-tax cash flow
- $1,958/yr
For passive investors: Depreciation is non-cash, so a rental often shows a tax loss while cash-flowing — sheltering income. Rental losses are passive: they offset passive income freely, and up to $25,000/yr can offset ordinary (W-2) income if you actively participate and your MAGI is under $100k (phasing out to $0 by $150k); unused losses carry forward. On sale, claimed depreciation is recaptured at up to 25%, and gains may owe capital-gains tax (a 1031 exchange can defer both). Figures are a year-1 estimate at your 24.0% rate — not tax advice; consult a CPA.
Schools (NCES district)
- District
- Bessemer City
- NCES district ID
- 0100330
- Math proficiency
- 3% ▼ -18.00%
- Reading proficiency
- 19% ▼ -3.00%
- Median HH income
- $29,721
- Composite
- 8.45/100
- National rank
- #9905
- State rank
- #120 of 129 in AL
Livability — Bessemer
- Score
- 59/100
- State rank
- #331
- US rank
- #20078
Category grades
Schools grade is shown separately in the Schools card above.
Census & demographics
- Census place
- Bessemer, AL
- County
- Jefferson County · 527,445 people
- City population
- 48,018
- Metro
- Birmingham-Hoover, AL
- Population (ZIP)
- 24,892
- Household income
- $35,362
- Rent vs Own
- Severe rent burden
- 1001.0
Population outlook (Jefferson County) Hauer SSP2
- Today (2025)
- 669,185 people
- By 2030
- 669,694 · +0.1%
- By 2040
- 661,388 · -1.2%
- By 2050
- 643,086 · -3.9%
- By 2075
- 577,267 · -13.7%
- By 2100
- 474,758 · -29.1%
Race, ethnicity, and origin ACS 2023
- Neighborhood character
- Predominantly Black (74%)
- Race & ethnicity
- Black 74% Hispanic / Latino 13% White 11% Two or more races 6%
- Hispanic origin (detail)
- Mexican 10%
- Foreign-born
- 5% · Canada
- Languages at home
- 89% English-only · Spanish 11%
Political lean MEDSL · Jefferson
- 2024 margin
- D (+10.4) · D 54.6% · R 44.2% · Other 1.2%
- 2008→2024 swing
- +5.4pp toward D · 2008: 5.1pp · 2024: 10.4pp
- All cycles
- 2024: D+10.4 2020: D+13.2 2016: D+7.2 2012: D+6.0 2008: D+5.1
Not yet ingested
- Civics
- —
Market trends
- HPI YoY
- ▼ -57.54%
- Current HPI
- 179.7702
- Rent YoY
- ▼ -3.12%
- Metro
- Birmingham-Hoover, AL
- State GDP YoY
- ▲ 2.94%
- F500 in state
- 4
Industry mix (Fortune 500 HQ in AL)
| Industry | F500 HQs | Revenue |
|---|---|---|
| Financial Services | 1 | $8B |
|
||
| Healthcare | 1 | $5B |
|
||
Price history
+84.9% since first listed3 events — show timeline
- 2026-04-29 Pending — Greater Alabama MLS
- 2026-04-22 Listed $98,900 Greater Alabama MLS
- 2025-12-16 Price Changed $53,500 Greater Alabama MLS
Cash-flow waterfall
monthlySold comps — $/sqft
last 12 mo · ≤1 miLoading sold comps…