374 SW De Gouvea Ter · Port St. Lucie, FL
Flood risk 1/10 · Minimal
- FEMA flood zone
- X (unshaded)
- Chance of flooding over 30 yrs
- 0.0%
- Est. flood insurance / yr
- $507 – $1,088
Fire risk 1/10 · Minimal
- Est. fire insurance / yr
- $947 – $1,759
Heat risk 10/10 · Severe
- Hot days now (above 106°F)
- 7 days/yr
- Hot days in 30 yrs
- 25 days/yr
Wind risk 10/10 · Severe
- Chance of severe wind over 30 yrs
- 99.0%
Air-quality risk 1/10 · Minimal
- Unhealthy air days now
- 0 days/yr
- Unhealthy air days in 30 yrs
- 0 days/yr
Risk factors via First Street. Map © Google.
Why this score? — see what drove the C grade
The composite is a weighted blend of 9 inputs, each scored 0–100. Each bar is that input's sub-score; the figure is the points it added to the 100-point composite (weight × sub-score).
- Cash flow +20.6/30.0
- ARV discount +12.8/15.0
- DSCR +6.6/10.0
- 1% rule +4.4/10.0
- Schools +3.7/10.0
- Rent growth +3.6/5.0
- Livability +2.5/5.0
- Condition / age +2.5/5.0
- Appreciation +0.0/10.0
$279,900
🖨 Deal sheet 📄 Offer letter ✓ Due diligence
Listing remarks
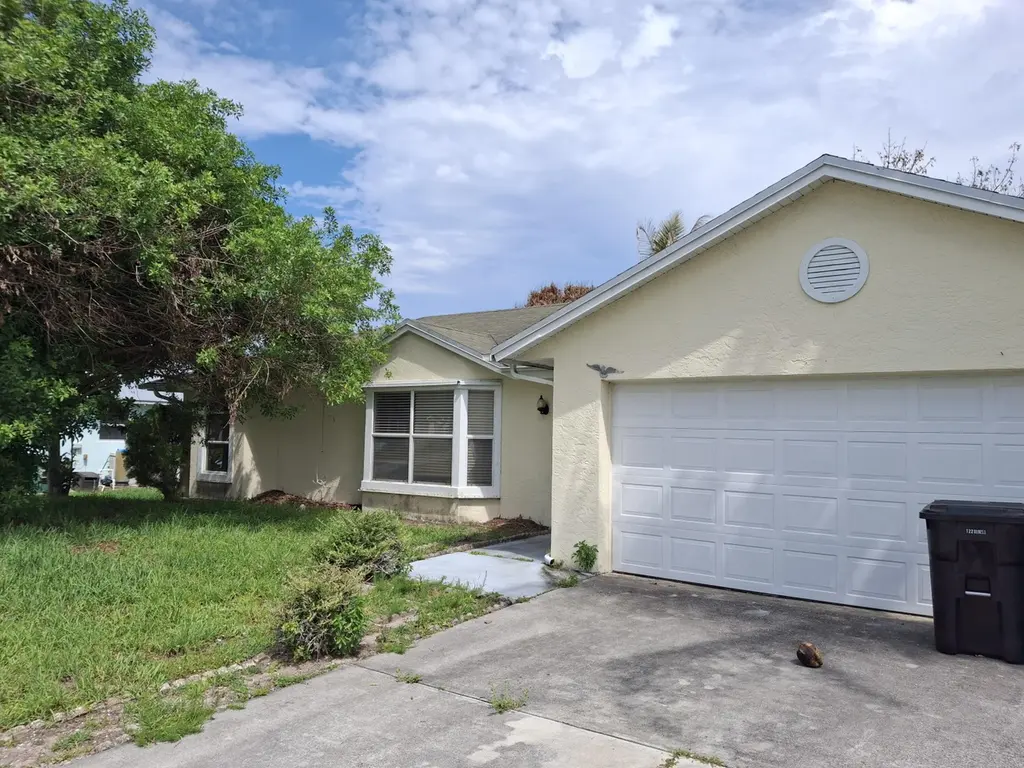
Welcome to this charming three-bedroom, two-bathroom single-family residence located in Port St. Lucie. This one-story home offers 1,176 square feet of finished living space, providing comfortable and functional layout for everyday living. The property includes a two-car garage, offering convenient parking and storage solutions. Situated in the established Port St. Lucie community, this residence presents an excellent opportunity for those seeking a well-proportioned home with practical amenities and straightforward appeal.
Key facts
- 0.23 acre lot
- 2 garage spots
- Built 1991
Property features AI
Exterior
- Parking: Attached 2-car garage; Total of 6 parking spaces (2 covered)
- Utilities: Public water; Private sewer; Cable available; Electricity connected
- Home design: Single family residence; One-story; Faces north; Resale property
- Construction: CBS construction; Shingle roof; Living area approximately 1,176 (public records); Building area total approximately 1,846
- Exterior features: Not waterfront; Cable available; Electricity connected; Public water
Interior
- Kitchen: Dishwasher; Microwave; Refrigerator
- Bedrooms: 3 bedrooms on the main level
- Flooring: Ceramic tile
- Bathrooms: 2 full bathrooms (main level)
- Heating & cooling: Central heating; Central air conditioning
- Interior features: Dishwasher; Microwave; Refrigerator; Ceramic tile flooring
Neighborhood map
What this means for you Summary
Snapshot
- This is a 3-bed/2.0-bath single-family listed at $280k.
Deal economics
- At list price, monthly cash flow is $375 ($4k/yr) — positive.
- The deal already cash-flows at list — no discount required.
- To meet the 1% rule (rent ≥ 1% of price), the offer needs to be $262k (6.2% below list).
- Recommended offer: $262k (6.2% below list) — sets the bar for 1% rule.
- Cap rate 7.9% vs local median 3.9% in Port St. Lucie — top-decile yield for the area; either an underpriced asset or a hidden risk that comps aren't pricing in. Stress-test before assuming the spread holds.
Location & tenants
- Location reads: area grade C — affects rentability + tenant quality, not the cash-flow math above.
- St. Lucie (urban): math 40% / reading 48% proficiency, ranked #51 of 73 in FL (top 70%) — families likely to look elsewhere, expect single-tenant / working-renter base with shorter leases.
- Market conditions: Rents rising fast (+4.5%/yr); 352 active listings in the ZIP; 24 comparable units currently listed for rent nearby; rentals at typical pace (median 24d on market — plan ~3-4 weeks tenant-placement turnaround); solid renter incomes; 4,868 units permitted in St. Lucie County in 2024 (268 in 5+ unit buildings).
- This rent runs 39% of the median local income ($81k/yr) — at the standard rent-burdened threshold; future hikes will face affordability resistance.
Forward outlook
- Local home prices are declining (-3.0%/yr); year-one equity from $2k of loan paydown is wiped out by about $8k of value loss. Plan a longer hold.
- St. Lucie County population projected at +20% by 2050 — long-run rental-demand tailwind backs the buy-and-hold thesis.
Negotiation context
- It's been on market 15 days — a 2% lower offer ($276k) is reasonable based on typical stale-listing flexibility.
- Current owner paid $12k; list at $280k implies a 2334% gain — meaningful room to come down on a strong offer.
Risks & watch-outs
- Climate carrying-cost: severe wind risk, 99% chance of damaging wind over 30y; extreme-heat days projected 7→25/yr by 2055 (HVAC capex compounding) — expect insurance premiums to compound above CPI over the hold.
Questions for the listing agent
- Is there a deadline driving the sale (1031 exchange, divorce, estate, relocation)? That informs how much negotiation room exists.
- What's the average days-on-market for RENTAL listings here right now (not sales)? A rising rental-DOM trend means longer vacancies and softer asking-rent achievability than the comps imply.
- What's the recent tenant-quality profile in this submarket — average credit score on applications, eviction rate, late-payment / NSF rate, and stable-employment percentage? A property-management company in the area should have these aggregated.
- How much new for-sale + rental construction is in the pipeline within 1–3 miles? Heavy new supply typically softens prices + rents 12–24 months out; constrained supply supports both.
Investment metrics
- 1% rule
- 0.94% ✗
- Cap rate
- 7.90%
- Cash-on-cash
- 5.74%
- DSCR
- 1.26
- GRM
- 8.9
CMA / ARV
- ARV (on-the-fly)
- $317,520
- Comps found
- 12
Show comp detail 12 sales within ~0.75 mi
| Address | Dist | Beds/Ba | Sqft | Sold | Price | $/sf | Match |
|---|---|---|---|---|---|---|---|
| 407 SW Molloy St | 0.37mi | 3/2.0 | 1,154 (-2%) | 4mo | $340,000 | $295 | 76 |
| 2068 SW Morelia Ln | 0.48mi | 3/2.0 | 1,196 (+2%) | 1mo | $226,000 | $189 | 74 |
| 461 SW Meadow Ter | 0.39mi | 3/2.0 | 1,272 (+8%) | 2mo | $345,000 | $271 | 66 |
| 261 SW Chelsea Ter | 0.45mi | 3/2.0 | 1,242 (+6%) | 6mo | $279,000 | $225 | 65 |
| 726 SW Bond Rd | 0.73mi | 3/2.0 | 1,204 (+2%) | 3mo | $325,000 | $270 | 60 |
| 273 SW Nativity Ter Ter | 0.53mi | 3/2.0 | 1,275 (+8%) | 5mo | $405,000 | $318 | 57 |
| 202 SW Voltair Ter | 0.55mi | 2/2.0 (-1) | 1,257 (+7%) | 3mo | $296,500 | $236 | 56 |
| 2012 SW Cameo Blvd | 0.51mi | 3/2.0 | 1,070 (-9%) | 11mo | $289,000 | $270 | 52 |
| 2049 SW Monterrey Ln | 0.54mi | 2/2.0 (-1) | 1,288 (+10%) | 2mo | $320,000 | $248 | 52 |
| 1809 SW Morelia Ln | 0.66mi | 3/2.0 | 1,000 (-15%) | 2mo | $240,000 | $240 | 43 |
| 168 SW Majestic Ter | 0.67mi | 3/2.0 | 1,337 (+14%) | 4mo | $307,000 | $230 | 43 |
| 1652 SW Angelico Ln | 0.65mi | 2/2.0 (-1) | 1,000 (-15%) | 2mo | $282,500 | $283 | 38 |
Match score weights: distance 35% · size 25% · config 20% · recency 20%. Top-matched comps best support the ARV.
Projected returns pro-forma
-3.0% appreciation · 4.54% rent growth · sell at horizon
- IRR
- -5.9%
- Equity multiple
- 0.78×
- Total profit
- $-17,466
- Equity at exit
- $41,734
- IRR
- 5.3%
- Equity multiple
- 1.42×
- Total profit
- $32,581
- Equity at exit
- $24,201
Cash invested: $78,372 (down + closing). Projections, not guarantees.
Landlord ↔ Tenant lean methodology
- Overall (STATE)
- 87 Strongly Landlord-Friendly
- State Florida
- 87 Strongly Landlord-Friendly · R+3
- County
- — inherits STATE
- City
- — inherits STATE
ZIP-level market 34984
- Home prices YoY
- -24.5%
- Rents YoY
- 4.5%
- Active inventory
- 352
- Price-to-rent
- 8.9×
Monthly cashflow live
- Estimated rent
- $2,625 high interval (Pro) →
- Mortgage (P&I)
- −$1,468
- Tax from tax record
- −$115 /mo · $1,374/yr
- Insurance
- −$117
- HOA
- −$0
- Vacancy / Maint / Mgmt
- −$551
- Net cashflow
- $375
Break-even live
UW: 25.0% down · 7.5% · 30yr · 1.5% tax · 5.0% vac · 8.0% maint · 8.0% mgmt
Financing live
Cash to close
- Down payment
- $69,975
- Closing costs
- $8,397
- Reserves months
- —
- Total cash needed
- —
Loan-product check · same deal, 3 products live
Conventional
25% down · 7.5% · 30yr
- Down + closing
- —
- Monthly P&I
- —
- Monthly cashflow
- —
- DSCR
- —
- Eligible?
- —
Personal DTI + credit; lowest rate.
DSCR
20% down · 8.5% · 30yr
- Down + closing
- —
- Monthly P&I
- —
- Monthly cashflow
- —
- DSCR
- —
- Eligible?
- —
No personal income docs; deal must DSCR.
Hard money
10% down · 12.0% · 12mo
- Down + closing
- —
- Monthly P&I
- —
- Monthly cashflow
- —
- DSCR
- —
- Eligible?
- —
Short-term bridge; refi at stabilization.
Rent comps 24 comps
| Address | Beds | Baths | Sqft | Rent | $/sqft | DOM | Units | Dist |
|---|---|---|---|---|---|---|---|---|
| 481 SW Voltair Ter Port Saint Lucie, FL | 3.0 | 2.0 | 1056 | $3,300 | $3.12 | 23d | 1 | 0.16mi |
| 2010 SW Burlington St Port Saint Lucie, FL | 3.0 | 2.0 | 1118 | $2,600 | $2.33 | 23d | 1 | 0.31mi |
| 1841 SW McAllister Ln Port Saint Lucie, FL | 3.0 | 2.0 | 1146 | $2,250 | $1.96 | 21d | 1 | 0.53mi |
| 205 SW Voltair Ter Port Saint Lucie, FL | 2.0 | 2.0 | 925 | $2,095 | $2.26 | 21d | 1 | 0.57mi |
| 262 SW Crescent Ave Port Saint Lucie, FL | 3.0 | 2.0 | 1482 | $2,600 | $1.75 | 23d | 1 | 0.70mi |
| 233 SW Chapman Ave Port Saint Lucie, FL | 3.0 | 2.0 | 1467 | $1,250 | $0.85 | 21d | 1 | 0.77mi |
| 279 SW Glenwood Dr Port Saint Lucie, FL | 3.0 | 2.0 | 1393 | $2,975 | $2.14 | 23d | 1 | 0.82mi |
| 2174 SW Wayne St Port Saint Lucie, FL | 3.0 | 2.0 | 1463 | $2,370 | $1.62 | 23d | 1 | 0.82mi |
| 613 SW Pueblo Ter Port Saint Lucie, FL | 3.0 | 2.0 | 1209 | $2,200 | $1.82 | 14d | 1 | 0.86mi |
| 613 SW Pueblo Ter Port Saint Lucie, FL | 3.0 | 2.0 | 1209 | $2,200 | $1.82 | 23d | 1 | 0.86mi |
| 2342 SW Bayshore Blvd Port Saint Lucie, FL | 3.0 | 2.0 | 1176 | $2,300 | $1.96 | 23d | 1 | 0.90mi |
| 385 SW Fairway Ave Port Saint Lucie, FL | 3.0 | 2.0 | 1440 | $2,800 | $1.94 | 23d | 1 | 0.92mi |
| 2265 SW Edison Cir Port Saint Lucie, FL | 2.0 | 2.0 | 1305 | $2,250 | $1.72 | 23d | 1 | 0.92mi |
| 1881 SE Airoso Blvd Port Saint Lucie, FL | 3.0 | 2.0 | 1384 | $2,200 | $1.59 | 23d | 1 | 0.94mi |
| 326 SW Ray Ave Port Saint Lucie, FL | 3.0 | 2.0 | 1350 | $2,350 | $1.74 | 21d | 1 | 1.08mi |
| 326 SW Ray Ave Port Saint Lucie, FL | 3.0 | 2.0 | 1350 | $2,400 | $1.78 | 23d | 1 | 1.08mi |
| 581 SW Banks Ter Port Saint Lucie, FL | 2.0 | 2.0 | 960 | $2,100 | $2.19 | 14d | 1 | 1.15mi |
| 2617 SW Chestnut Ln Port Saint Lucie, FL | 3.0 | 2.0 | 1457 | $2,675 | $1.84 | 23d | 1 | 1.29mi |
| 1080 SW Colorado Ave Port Saint Lucie, FL | 3.0 | 2.0 | 1240 | $2,150 | $1.73 | 23d | 1 | 1.30mi |
| 1050 SW Fenway Rd Port Saint Lucie, FL | 2.0 | 2.0 | 1035 | $2,000 | $1.93 | 23d | 1 | 1.32mi |
| 173 SE Fallon Dr Port Saint Lucie, FL | 3.0 | 2.0 | 1281 | $2,400 | $1.87 | 14d | 1 | 1.38mi |
| 431 SE Dalva Ave Port Saint Lucie, FL | 3.0 | 2.0 | 1176 | $2,150 | $1.83 | 23d | 1 | 1.40mi |
| 481 SW Aster Rd Port Saint Lucie, FL | 3.0 | 2.0 | 1499 | $3,000 | $2.00 | 23d | 1 | 1.41mi |
| 1189 SW Broadview St Port Saint Lucie, FL | 2.0 | 2.0 | 988 | $2,200 | $2.23 | 14d | 1 | 1.43mi |
Listing history 15 events
-
2026-06-18pricestatus $279,900 Active 15 DOM
-
2026-06-18days on market $269,900 Active Under Contract 15 DOM
-
2026-06-17days on market $269,900 Active Under Contract 14 DOM
-
2026-06-16days on market $269,900 Active Under Contract 13 DOM
-
2026-06-15status $269,900 Active Under Contract 12 DOM
-
2026-06-15days on market $269,900 Active 12 DOM
-
2026-06-14days on market $269,900 Active 10 DOM
-
2026-06-13statusdays on market $269,900 Active 9 DOM
-
2026-06-10days on market $269,900 Active Under Contract 7 DOM
-
2026-06-09days on market $269,900 Active Under Contract 6 DOM
-
2026-06-09status $269,900 Active Under Contract 5 DOM
-
2026-06-08days on market $269,900 Active 5 DOM
-
2026-06-07days on market $269,900 Active 4 DOM
-
2026-06-05remarks 529-char remark
-
2026-06-05$269,900 Active 1 DOM
ⓘ Source: listings_history table (triggers on properties + properties_extension) + one-shot
backfill from property_details.listing_events for pre-trigger history.
Tax reassessment forecast FL · Resets to sale price
- Current annual tax
- $1,374 · $115/mo
- Projected year-2 tax
- $2,323 · $194/mo
- Expected delta
- +$949/yr (+$79/mo · 69.1%)
ⓘ Screening estimate from a state-policy table — verify with the county assessor before closing.
Climate risk First Street
- Flood 1/10 Low FEMA zone X (unshaded) · 0% chance over 30 yrs
- Wildfire 1/10 Low
- Heat 10/10 Extreme 7 d/yr ≥106°F today · 25 d/yr by 30 yrs out
- Wind 10/10 Extreme 99% chance of damaging wind over 30 yrs
- Air quality 1/10 Low 0 unhealthy d/yr today · 0 by 30 yrs out
Nearby sold comps map
Loading sold comps map…
Walkable amenities ~0.75 mi
Loading nearby amenities…
Taxation est. · year 1
- Rental income
- $31,499
- − Mortgage interest
- −$15,679
- − Property taxes
- −$1,374
- − Insurance
- −$1,400
- − Repairs & maintenance
- −$2,520
- − Management
- −$2,520
- − Depreciation
- −$8,143
- Taxable loss
- −$136
- Est. tax savings @ 24.0%
- +$33
- After-tax cash flow
- $4,529/yr
For passive investors: Depreciation is non-cash, so a rental often shows a tax loss while cash-flowing — sheltering income. Rental losses are passive: they offset passive income freely, and up to $25,000/yr can offset ordinary (W-2) income if you actively participate and your MAGI is under $100k (phasing out to $0 by $150k); unused losses carry forward. On sale, claimed depreciation is recaptured at up to 25%, and gains may owe capital-gains tax (a 1031 exchange can defer both). Figures are a year-1 estimate at your 24.0% rate — not tax advice; consult a CPA.
Schools (NCES district)
- District
- St. Lucie
- NCES district ID
- 1201770
- Math proficiency
- 40% ▼ -11.00%
- Reading proficiency
- 48% ▼ -4.00%
- Median HH income
- $44,737
- Composite
- 37.28/100
- National rank
- #4449
- State rank
- #51 of 73 in FL
Livability — Port St. Lucie
No livability data for this city. (Only ~50 U.S. cities are tracked.)
Census & demographics
- Census place
- Port St. Lucie, FL
- County
- Saint Lucie County · 337,150 people
- City population
- 221,051
- Metro
- Port St. Lucie, FL
- Population (ZIP)
- 20,151
- Household income
- $80,725
- Rent vs Own
- Severe rent burden
- 266.0
Population outlook (St. Lucie County) Hauer SSP2
- Today (2025)
- 338,016 people
- By 2030
- 355,687 · +5.2%
- By 2040
- 385,521 · +14.1%
- By 2050
- 406,106 · +20.1%
- By 2075
- 441,054 · +30.5%
- By 2100
- 436,885 · +29.2%
Race, ethnicity, and origin ACS 2023
- Neighborhood character
- Diverse neighborhood (Simpson 0.62)
- Race & ethnicity
- White 55% Black 20% Hispanic / Latino 18% Two or more races 8% Asian 2%
- Hispanic origin (detail)
- Mexican 1% Puerto Rican 8% Cuban 3%
- Common ancestry
- Hispanic 2% Romanian 1% Scotch-Irish 1%
- Foreign-born
- 15% · Canada, Jamaica, China
- Languages at home
- 77% English-only · Spanish 15% French/Haitian/Cajun 5% Other Indo-European 1%
Political lean MEDSL · St. Lucie
- 2024 margin
- Lean R (+9.1) · D 45.1% · R 54.2%
- 2008→2024 swing
- -21.2pp toward R · 2008: 12.1pp · 2024: -9.1pp
- All cycles
- 2024: R+9.1 2020: R+1.6 2016: R+2.5 2012: D+7.9 2008: D+12.1
Not yet ingested
- Civics
- —
Market trends
- HPI YoY
- ▼ -121.06%
- Current HPI
- 373.9523
- Rent YoY
- ▲ 4.54%
- Metro
- Port St. Lucie, FL
- State GDP YoY
- ▲ 3.28%
- F500 in state
- 36
Industry mix (Fortune 500 HQ in FL)
| Industry | F500 HQs | Revenue |
|---|---|---|
| Industrial Technology | 2 | $29B |
|
||
| Insurance | 2 | $17B |
|
||
| Retail | 1 | $60B |
|
||
| Technology Distribution | 1 | $58B |
|
||
| Homebuilding | 1 | $35B |
|
||
| Technology Manufacturing | 1 | $35B |
|
||
Price history
+3075.3% since first listed3 events — show timeline
- 2026-06-03 Listed $269,900 Beaches MLS
- 1991-10-13 Sold (Public Records) $11,500 Public Records
- 1991-08-27 Sold (Public Records) $8,500 Public Records
Property tax history
+2.0%/yrLatest (2025): $1,374 · +3.0% YoY. Source: county tax records.
Cash-flow waterfall
monthlySold comps — $/sqft
last 12 mo · ≤1 miLoading sold comps…