143 Chicago St · Waterloo, IA
Flood risk 1/10 · Minimal
- FEMA flood zone
- X (unshaded)
- Chance of flooding over 30 yrs
- 0.0%
- Est. flood insurance / yr
- $473 – $860
Fire risk 1/10 · Minimal
- Est. fire insurance / yr
- $902 – $1,676
Heat risk 3/10 · Minor
- Hot days now (above 101°F)
- 7 days/yr
- Hot days in 30 yrs
- 16 days/yr
Wind risk 2/10 · Minimal
- Chance of severe wind over 30 yrs
- —
Air-quality risk 1/10 · Minimal
- Unhealthy air days now
- 0 days/yr
- Unhealthy air days in 30 yrs
- 0 days/yr
Risk factors via First Street. Map © Google.
Why this score? — see what drove the B grade
The composite is a weighted blend of 9 inputs, each scored 0–100. Each bar is that input's sub-score; the figure is the points it added to the 100-point composite (weight × sub-score).
- Cash flow +26.4/30.0
- ARV discount +15.0/15.0
- DSCR +9.0/10.0
- 1% rule +7.8/10.0
- Schools +4.4/10.0
- Livability +4.0/5.0
- Rent growth +3.5/5.0
- Condition / age +2.5/5.0
- Appreciation +0.0/10.0
$54,900
🖨 Deal sheet 📄 Offer letter ✓ Due diligence
Listing remarks MLS
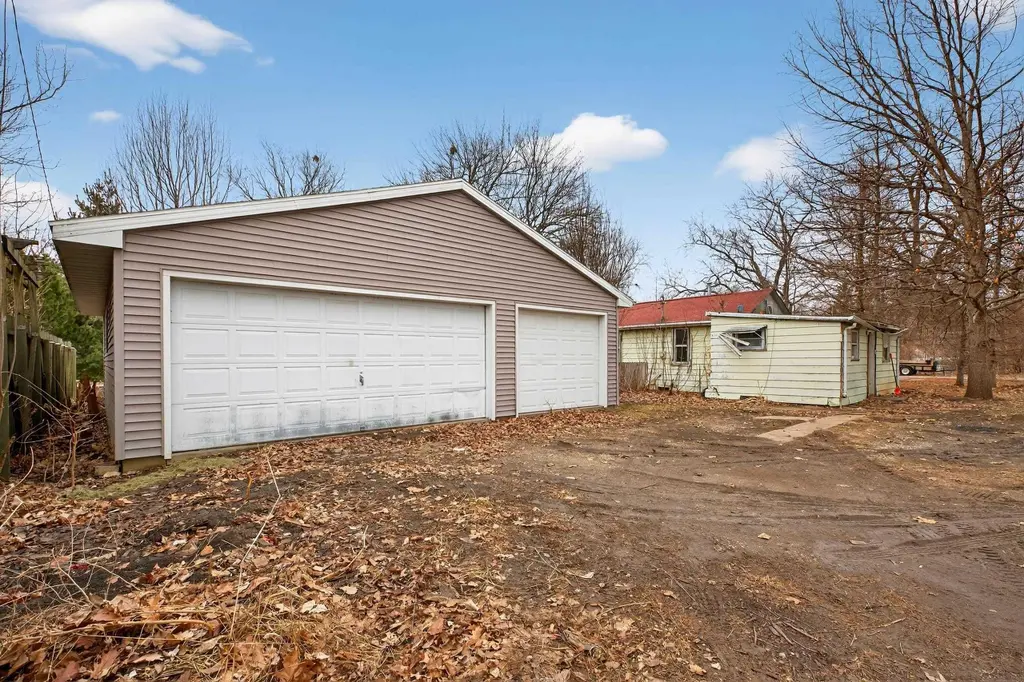
Calling all Investors!! This one bed, one bath home comes with an oversized three stall garage. Whether you're looking to take on a renovation project, or looking for storage this home presents a solid opportunity. Schedule your showing today!
Key facts
- 0.26 acre lot
- 3 parking spots
- Built 1921
Neighborhood map
What this means for you Summary
Snapshot
- This is a 1-bed/1.0-bath single-family listed at $55k.
Deal economics
- At list price, monthly cash flow is $144 ($2k/yr) — positive.
- The deal already cash-flows at list — no discount required.
- Meets the 1% rule at list price ($700 rent vs $55k).
- Recommended offer: $52k (6.0% below list) — sets the bar for market timing.
- Cap rate 9.4% vs local median 4.2% in Waterloo — top-decile yield for the area; either an underpriced asset or a hidden risk that comps aren't pricing in. Stress-test before assuming the spread holds.
Location & tenants
- Location reads 81/100 on livability (#74 in IA, #1,589 nationally) — a professional / high-income tenant draw. Strengths: commute A+, cost of living A+, housing A+; Watch: schools C-, crime F, employment D-.
- Waterloo Community School District (urban): math 50% / reading 54% proficiency, ranked #276 of 289 in IA (top 96%) — acceptable for families but not a draw, mixed tenant base, ~2y average lease.
- Market conditions: Rents rising (+3.8%/yr); 282 active listings in the ZIP; 32 comparable units currently listed for rent nearby; rentals at typical pace (median 21d on market — plan ~3-4 weeks tenant-placement turnaround); 44% of comp listings sitting > 30 days — soft ceiling on asking rent; 287 units permitted in Black Hawk County in 2024 (67 in 5+ unit buildings).
- This rent is only 14% of the median local income ($61k/yr) — well below the 30% rent-burden line; pricing power to push rent on renewal without tenant pushback.
Forward outlook
- Local home prices are declining (-3.0%/yr); year-one equity from $380 of loan paydown is wiped out by about $2k of value loss. Plan a longer hold.
- Black Hawk County population projected at +10% by 2050 — modest demand growth; plan on rents tracking national, not racing it.
- At projected returns (-3.0% appreciation + 3.8% rent growth), your $15k cash investment doubles in ~9 years — after that, you're playing with house money.
Negotiation context
- It's been on market 79 days — a 6% lower offer ($52k) is reasonable based on typical stale-listing flexibility.
- 2 sale attempts; this cycle's ask has dropped $10k (15%) from the opening price — seller is motivated, your offer sets the floor, not the list.
Risks & watch-outs
- Watch-outs: built in 1921 — expect roof / HVAC / electrical / plumbing capex.
Questions for the listing agent
- It's been on market 79 days. Have you received any prior offers? Is the seller open to a 6% concession, seller financing, or rate buy-down credit?
- Built in 1921 — when were the roof, HVAC, electrical panel, plumbing, and water heater last replaced?
- Why hasn't it sold? Are there any deal-killer items the seller is aware of (foundation, flood, title, zoning, code violations)?
- Is there a deadline driving the sale (1031 exchange, divorce, estate, relocation)? That informs how much negotiation room exists.
- Crime grade is F in this area — have there been break-ins, vandalism, or insurance claims at this property in the last 3 years? What carrier currently insures it and at what premium?
- What's the average days-on-market for RENTAL listings here right now (not sales)? A rising rental-DOM trend means longer vacancies and softer asking-rent achievability than the comps imply.
- What's the recent tenant-quality profile in this submarket — average credit score on applications, eviction rate, late-payment / NSF rate, and stable-employment percentage? A property-management company in the area should have these aggregated.
- How much new for-sale + rental construction is in the pipeline within 1–3 miles? Heavy new supply typically softens prices + rents 12–24 months out; constrained supply supports both.
Investment metrics
- 1% rule
- 1.28% ✓
- Cap rate
- 9.45%
- Cash-on-cash
- 11.26%
- DSCR
- 1.50
- GRM
- 6.5
CMA / ARV
- ARV (median comp)
- $106,864
- List price
- $54,900
- Delta
- -48.63%
- Verdict
- UNDERPRICED
- Comps
- 20 within 1.0 mi
Show comp detail 9 sales within ~0.75 mi
| Address | Dist | Beds/Ba | Sqft | Sold | Price | $/sf | Match |
|---|---|---|---|---|---|---|---|
| 117 Bertch Ave | 0.51mi | 2/1.0 (+1) | 672 (-1%) | 4mo | $70,000 | $104 | 66 |
| 615 Marsh St | 0.35mi | 2/1.5 (+1) | 680 (+0%) | 24mo | $109,900 | $162 | 57 |
| 619 Bertch Ave Ave | 0.75mi | 1/1.0 | 684 (+1%) | 10mo | $78,220 | $114 | 56 |
| 402 Black Hawk Rd | 0.53mi | 2/1.0 (+1) | 740 (+9%) | 2mo | $115,000 | $155 | 54 |
| 1313 Wallgate Ave | 0.69mi | 2/1.0 (+1) | 684 (+1%) | 14mo | $122,000 | $178 | 50 |
| 404 Black Hawk Rd Rd | 0.53mi | 2/1.0 (+1) | 616 (-9%) | 7mo | $72,000 | $117 | 49 |
| 108 Bertch Ave | 0.53mi | 2/1.0 (+1) | 769 (+13%) | 4mo | $127,500 | $166 | 45 |
| 1318 Knoll Ave | 0.61mi | 2/1.0 (+1) | 776 (+14%) | 9mo | $90,000 | $116 | 35 |
| 1012 W 6th St | 0.74mi | 2/1.0 (+1) | 740 (+9%) | 14mo | $12,900 | $17 | 34 |
Match score weights: distance 35% · size 25% · config 20% · recency 20%. Top-matched comps best support the ARV.
Projected returns pro-forma
-3.0% appreciation · 3.8% rent growth · sell at horizon
- IRR
- 1.5%
- Equity multiple
- 1.06×
- Total profit
- $886
- Equity at exit
- $8,186
- IRR
- 12.0%
- Equity multiple
- 1.98×
- Total profit
- $15,085
- Equity at exit
- $4,747
Cash invested: $15,372 (down + closing). Projections, not guarantees.
Landlord ↔ Tenant lean methodology
- Overall (STATE)
- 83 Strongly Landlord-Friendly
- State Iowa
- 83 Strongly Landlord-Friendly · R+6
- County
- — inherits STATE
- City
- — inherits STATE
ZIP-level market 50701
- Rents YoY
- 3.8%
- Active inventory
- 282
- Price-to-rent
- 6.5×
Monthly cashflow live
- Estimated rent
- $700 high interval (Pro) →
- Mortgage (P&I)
- −$288
- Tax from tax record
- −$98 /mo · $1,178/yr
- Insurance
- −$23
- HOA
- −$0
- Vacancy / Maint / Mgmt
- −$147
- Net cashflow
- $144
Break-even live
UW: 25.0% down · 7.5% · 30yr · 1.5% tax · 5.0% vac · 8.0% maint · 8.0% mgmt
Financing live
Cash to close
- Down payment
- $13,725
- Closing costs
- $1,647
- Reserves months
- —
- Total cash needed
- —
Loan-product check · same deal, 3 products live
Conventional
25% down · 7.5% · 30yr
- Down + closing
- —
- Monthly P&I
- —
- Monthly cashflow
- —
- DSCR
- —
- Eligible?
- —
Personal DTI + credit; lowest rate.
DSCR
20% down · 8.5% · 30yr
- Down + closing
- —
- Monthly P&I
- —
- Monthly cashflow
- —
- DSCR
- —
- Eligible?
- —
No personal income docs; deal must DSCR.
Hard money
10% down · 12.0% · 12mo
- Down + closing
- —
- Monthly P&I
- —
- Monthly cashflow
- —
- DSCR
- —
- Eligible?
- —
Short-term bridge; refi at stabilization.
Rent comps 32 comps
| Address | Beds | Baths | Sqft | Rent | $/sqft | DOM | Units | Dist |
|---|---|---|---|---|---|---|---|---|
| 130 Sherwood Ct Waterloo, IA | 1.0 | 1.0 | 490 | $695 | $1.42 | 20d | 1 | 0.22mi |
| 125 Sherwood Ct Unit 6 Waterloo, IA | 1.0 | 1.0 | 490 | $625 | $1.28 | 20d | 1 | 0.24mi |
| 125 Sherwood Ct Waterloo, IA | 1.0 | 1.0 | 490 | $625 | $1.28 | 43d | 2 | 0.24mi |
| 120 Sherwood Ct Unit 1 Waterloo, IA | 1.0 | 1.0 | 490 | $625 | $1.28 | 20d | 1 | 0.24mi |
| 209 Baltimore St Waterloo, IA | 1.0 | 1.0 | 618 | $650 | $1.05 | 43d | 1 | 0.33mi |
| 211 W Wellington St Unit 211 1/2 Wellington Waterloo, IA | 1.0 | 1.0 | 600 | $600 | $1.00 | 43d | 1 | 0.49mi |
| 314 Locust St Apt 5 Waterloo, IA | 1.0 | 1.0 | 500 | $825 | $1.65 | 43d | 1 | 0.51mi |
| 408 Locust St Waterloo, IA | 1.0 | 1.0 | 644 | $450 | $0.70 | 20d | 1 | 0.54mi |
| 808 W 2nd St Unit 1 Waterloo, IA | 1.0 | 1.0 | 452 | $595 | $1.32 | 43d | 1 | 0.61mi |
| 811 W 3rd St #8 Waterloo, IA | 1.0 | 1.0 | 600 | $575 | $0.96 | 43d | 1 | 0.67mi |
| 733 Baltimore St Waterloo, IA | 1.0 | 1.0 | 724 | $700 | $0.97 | 43d | 1 | 0.70mi |
| 102 1/2 South St Waterloo, IA | 1.0 | 1.0 | 668 | $550 | $0.82 | 20d | 1 | 0.72mi |
| 609 Wellington Ct Apt D6 Waterloo, IA | 1.0 | 1.0 | 588 | $600 | $1.02 | 20d | 1 | 0.78mi |
| 609 Wellington Ct Waterloo, IA | 1.0 | 1.0 | 567 | $600 | $1.06 | 43d | 2 | 0.78mi |
| 200 Parkview Blvd Waterloo, IA | 2.0 | 1.0 | 744 | $725 | $0.97 | 20d | 1 | 0.79mi |
| 209 Parkview Blvd Waterloo, IA | 1.0 | 1.0 | 624 | $695 | $1.11 | 43d | 1 | 0.81mi |
| 246 Parkview Blvd Unit 242 Waterloo, IA | 1.0 | 1.0 | 624 | $650 | $1.04 | 20d | 1 | 0.81mi |
| 254 Parkview Blvd Unit 254 Waterloo, IA | 2.0 | 1.0 | 744 | $795 | $1.07 | 43d | 1 | 0.82mi |
| 225 Parkview Blvd Waterloo, IA | 1.0 | 1.0 | 624 | $650 | $1.04 | 20d | 1 | 0.82mi |
| 225 Miriam Dr Unit A Waterloo, IA | 2.0 | 1.0 | 700 | $650 | $0.93 | 43d | 1 | 0.87mi |
| 237 Miriam Dr Apt B Waterloo, IA | 2.0 | 1.0 | 750 | $725 | $0.97 | 43d | 1 | 0.88mi |
| 21 W Jefferson St Waterloo, IA | 1.0 | 1.0 | 711 | $1,410 | $1.98 | 20d | 6 | 0.91mi |
| 706 South St Waterloo, IA | 2.0 | 1.0 | 750 | $675 | $0.90 | 43d | 1 | 0.96mi |
| 706 South St Unit B Waterloo, IA | 2.0 | 1.0 | 750 | $635 | $0.85 | 20d | 1 | 0.96mi |
| 1008 Leavitt St Waterloo, IA | 2.0 | 1.0 | 700 | $920 | $1.31 | 20d | 1 | 0.96mi |
| 1014 Leavitt St Waterloo, IA | 2.0 | 1.0 | 700 | $1,060 | $1.51 | 20d | 2 | 0.98mi |
| 1001 1/2 Randolph St Waterloo, IA | 1.0 | 1.0 | 624 | $475 | $0.76 | 20d | 1 | 1.09mi |
| 335 Cedar St Waterloo, IA | 1.0 | 1.0 | 540 | $1,510 | $2.80 | 20d | 1 | 1.12mi |
| 606 Sycamore St Unit A Waterloo, IA | 1.0 | 1.0 | 622 | $875 | $1.41 | 43d | 1 | 1.40mi |
| 611 Sycamore St Unit 302 Waterloo, IA | 1.0 | 1.0 | 550 | $750 | $1.36 | 20d | 1 | 1.42mi |
| 1040 Patrick Ct Unit 1118-119 Waterloo, IA | 1.0 | 1.0 | 500 | $650 | $1.30 | 20d | 1 | 1.48mi |
| 325 E Park Ave Waterloo, IA | — | 1.0 | 425 | $1,100 | $2.59 | 20d | 1 | 1.49mi |
Listing history 21 events
-
2026-06-19days on market $54,900 Active 79 DOM
-
2026-06-18days on market $54,900 Active 78 DOM
-
2026-06-17days on market $54,900 Active 77 DOM
-
2026-06-16days on market $54,900 Active 76 DOM
-
2026-06-15days on market $54,900 Active 75 DOM
-
2026-06-14days on market $54,900 Active 73 DOM
-
2026-06-13pricedays on market $54,900 Active 72 DOM
-
2026-06-10days on market $59,900 Active 70 DOM
-
2026-06-09days on market $59,900 Active 69 DOM
-
2026-06-08days on market $59,900 Active 68 DOM
-
2026-06-07days on market $59,900 Active 67 DOM
-
2026-06-05days on market $59,900 Active 64 DOM
-
2026-06-03days on market $59,900 Active 63 DOM
-
2026-06-02days on market $59,900 Active 62 DOM
-
2026-06-01days on market $59,900 Active 61 DOM
-
2026-05-31days on market $59,900 Active 60 DOM
-
2026-05-30days on market $59,900 Active 59 DOM
-
2026-05-12price $59,900 243-char remark
Show marketing remark (243 chars)
Calling all Investors!! This one bed, one bath home comes with an oversized three stall garage. Whether you're looking to take on a renovation project, or looking for storage this home presents a solid opportunity. Schedule your showing today!
-
2026-04-14status Active 243-char remark
Show marketing remark (243 chars)
Calling all Investors!! This one bed, one bath home comes with an oversized three stall garage. Whether you're looking to take on a renovation project, or looking for storage this home presents a solid opportunity. Schedule your showing today!
-
2026-03-19status Pending 243-char remark
Show marketing remark (243 chars)
Calling all Investors!! This one bed, one bath home comes with an oversized three stall garage. Whether you're looking to take on a renovation project, or looking for storage this home presents a solid opportunity. Schedule your showing today!
-
2026-03-06$64,900 Active 243-char remark
Show marketing remark (243 chars)
Calling all Investors!! This one bed, one bath home comes with an oversized three stall garage. Whether you're looking to take on a renovation project, or looking for storage this home presents a solid opportunity. Schedule your showing today!
ⓘ Source: listings_history table (triggers on properties + properties_extension) + one-shot
backfill from property_details.listing_events for pre-trigger history.
Tax reassessment forecast IA · Partial reset (capped growth)
- Current annual tax
- $1,178 · $98/mo
- Projected year-2 tax
- $1,178 · $98/mo
- Expected delta
- $0/yr ($0/mo · 0.0%)
ⓘ Screening estimate from a state-policy table — verify with the county assessor before closing.
Climate risk First Street
- Flood 1/10 Low FEMA zone X (unshaded) · 0% chance over 30 yrs
- Wildfire 1/10 Low
- Heat 3/10 Moderate 7 d/yr ≥101°F today · 16 d/yr by 30 yrs out
- Wind 2/10 Low
- Air quality 1/10 Low 0 unhealthy d/yr today · 0 by 30 yrs out
Nearby sold comps map
Loading sold comps map…
Walkable amenities ~0.75 mi
Loading nearby amenities…
Taxation est. · year 1
- Rental income
- $8,402
- − Mortgage interest
- −$3,075
- − Property taxes
- −$1,178
- − Insurance
- −$274
- − Repairs & maintenance
- −$672
- − Management
- −$672
- − Depreciation
- −$1,597
- Taxable income
- $933
- Est. tax owed @ 24.0%
- −$224
- After-tax cash flow
- $1,507/yr
For passive investors: Depreciation is non-cash, so a rental often shows a tax loss while cash-flowing — sheltering income. Rental losses are passive: they offset passive income freely, and up to $25,000/yr can offset ordinary (W-2) income if you actively participate and your MAGI is under $100k (phasing out to $0 by $150k); unused losses carry forward. On sale, claimed depreciation is recaptured at up to 25%, and gains may owe capital-gains tax (a 1031 exchange can defer both). Figures are a year-1 estimate at your 24.0% rate — not tax advice; consult a CPA.
Schools (NCES district)
- District
- Waterloo Community School District
- NCES district ID
- 1930480
- Math proficiency
- 50% ▼ -4.00%
- Reading proficiency
- 54% ▲ 1.00%
- Median HH income
- $42,545
- Composite
- 43.72/100
- National rank
- #2950
- State rank
- #276 of 289 in IA
Livability — Waterloo
- Score
- 81/100
- State rank
- #74
- US rank
- #1589
Category grades
Schools grade is shown separately in the Schools card above.
Census & demographics
- Census place
- Waterloo, IA
- County
- Black Hawk County · 112,933 people
- City population
- 69,066
- Metro
- Waterloo-Cedar Falls, IA
- Population (ZIP)
- 30,232
- Household income
- $61,475
- Rent vs Own
- Severe rent burden
- 1377.0
Population outlook (Black Hawk County) Hauer SSP2
- Today (2025)
- 139,716 people
- By 2030
- 142,853 · +2.2%
- By 2040
- 147,843 · +5.8%
- By 2050
- 153,247 · +9.7%
- By 2075
- 167,977 · +20.2%
- By 2100
- 177,320 · +26.9%
Race, ethnicity, and origin ACS 2023
- Neighborhood character
- Predominantly White (78%)
- Race & ethnicity
- White 78% Black 11% Two or more races 5% Hispanic / Latino 3% Asian 3%
- Common ancestry
- Portuguese 3% Italian 3% American 2%
- Foreign-born
- 7% · Canada, South Korea, Vietnam
- Languages at home
- 92% English-only · Russian/Polish/Slavic 2% Spanish 2% French/Haitian/Cajun 2%
Political lean MEDSL · Black Hawk
- 2024 margin
- Toss-up / Even · D 50.0% · R 48.8% · Other 1.2%
- 2008→2024 swing
- -21.3pp toward R · 2008: 22.4pp · 2024: 1.2pp
- All cycles
- 2024: D+1.2 2020: D+9.0 2016: D+7.3 2012: D+20.0 2008: D+22.4
Not yet ingested
- Civics
- —
Market trends
- HPI YoY
- ▼ -107.19%
- Current HPI
- 162.8951
- Rent YoY
- ▲ 3.80%
- Metro
- Waterloo-Cedar Falls, IA
- State GDP YoY
- ▲ 2.48%
- F500 in state
- 4
Industry mix (Fortune 500 HQ in IA)
| Industry | F500 HQs | Revenue |
|---|---|---|
| Financial Services | 1 | $16B |
|
||
| Retail / Convenience | 1 | $15B |
|
||
Price history
-7.7% since first listed4 events — show timeline
- 2026-05-12 Price Changed $59,900 NEIRBR as distributed by MLS GRID
- 2026-04-14 Relisted — NEIRBR as distributed by MLS GRID
- 2026-03-19 Pending — NEIRBR as distributed by MLS GRID
- 2026-03-06 Listed $64,900 NEIRBR as distributed by MLS GRID
Property tax history
+4.2%/yrLatest (2025): $1,178 · +8.5% YoY. Source: county tax records.
Cash-flow waterfall
monthlySold comps — $/sqft
last 12 mo · ≤1 miLoading sold comps…