 🏷️ Likely Rental
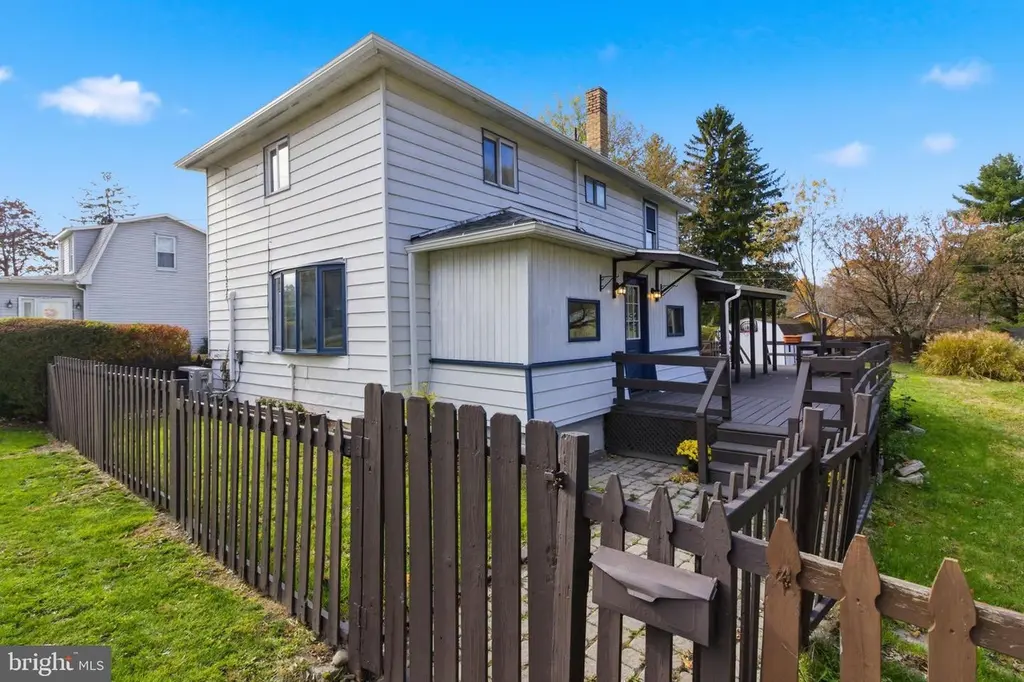
334 Hemlock St · Rush, PA
Flood risk 1/10 · Minimal
- FEMA flood zone
- X (unshaded)
- Chance of flooding over 30 yrs
- 0.0%
- Est. flood insurance / yr
- $507 – $1,088
Fire risk 2/10 · Minimal
- Est. fire insurance / yr
- $511 – $949
Heat risk 3/10 · Minor
- Hot days now (above 89°F)
- 7 days/yr
- Hot days in 30 yrs
- 18 days/yr
Wind risk 2/10 · Minimal
- Chance of severe wind over 30 yrs
- —
Air-quality risk 2/10 · Minimal
- Unhealthy air days now
- 1 days/yr
- Unhealthy air days in 30 yrs
- 2 days/yr
Risk factors via First Street. Map © Google.
Why this score? — see what drove the A grade
The composite is a weighted blend of 9 inputs, each scored 0–100. Each bar is that input's sub-score; the figure is the points it added to the 100-point composite (weight × sub-score).
- Cash flow +30.0/30.0
- ARV discount +15.0/15.0
- DSCR +10.0/10.0
- Appreciation +10.0/10.0
- 1% rule +8.7/10.0
- Schools +3.9/10.0
- Rent growth +2.5/5.0
- Livability +2.5/5.0
- Condition / age +2.5/5.0
$115,900
🖨 Deal sheet 📄 Offer letter ✓ Due diligence
Listing remarks MLS
Welcome to 334 Hemlock Street, located in the charming south side of Philipsburg. This property features a cozy 0.11-acre fenced lot, ideal for children and pets to play safely. Inside, you will find three bedrooms and one bathroom. The home is equipped with a mini-split system, providing efficient heating and cooling year-round. Additionally, a pellet stove serves as a warm and rustic backup heat source, perfect for cozy evenings. Currently, the property is leased with an 18-month rental agreement set to conclude on June 30, 2027. The tenant is responsible for the monthly rent of $1,100 and any utility costs. Contact us to schedule your private showing and explore the possibilities at 334 Hemlock Street!
Key facts
- Fenced in
- Pellet stove
- Mini split system
Tags
Neighborhood map
What this means for you Summary
Snapshot
- This is a 3-bed/1.0-bath other listed at $116k.
Deal economics
- At list price, monthly cash flow is $496 ($6k/yr) — positive.
- The deal already cash-flows at list — no discount required.
- Meets the 1% rule at list price ($2k rent vs $116k).
- Recommended offer: $102k (12.0% below list) — sets the bar for market timing.
Location & tenants
- Location reads: area grade A — affects rentability + tenant quality, not the cash-flow math above.
- Philipsburg-Osceola Area SD (town): math 42% / reading 52% proficiency, ranked #258 of 539 in PA (top 48%) — families likely to look elsewhere, expect single-tenant / working-renter base with shorter leases.
- Market conditions: 36 active listings in the ZIP; 399 units permitted in Centre County in 2024 (44 in 5+ unit buildings).
Forward outlook
- In year one you build about $12k of equity ($801 loan paydown + $12k appreciation (10.0% local appreciation)).
- Centre County population projected at +16% by 2050 — long-run rental-demand tailwind backs the buy-and-hold thesis.
- At projected returns (10.0% appreciation + 3.0% rent growth), your $32k cash investment doubles in ~2 years — after that, you're playing with house money.
- By year 3, paydown + projected appreciation supports a ~$31k cash-out refi (75% LTV) — recoverable capital for the next deal without selling this one.
Negotiation context
- It's been on market 230 days — a 12% lower offer ($102k) is reasonable based on typical stale-listing flexibility.
Risks & watch-outs
- Watch-outs: built in 1915 — expect roof / HVAC / electrical / plumbing capex.
Questions for the listing agent
- It's been on market 230 days. Have you received any prior offers? Is the seller open to a 12% concession, seller financing, or rate buy-down credit?
- Built in 1915 — when were the roof, HVAC, electrical panel, plumbing, and water heater last replaced?
- Why hasn't it sold? Are there any deal-killer items the seller is aware of (foundation, flood, title, zoning, code violations)?
- Is there a deadline driving the sale (1031 exchange, divorce, estate, relocation)? That informs how much negotiation room exists.
- What's the average days-on-market for RENTAL listings here right now (not sales)? A rising rental-DOM trend means longer vacancies and softer asking-rent achievability than the comps imply.
- What's the recent tenant-quality profile in this submarket — average credit score on applications, eviction rate, late-payment / NSF rate, and stable-employment percentage? A property-management company in the area should have these aggregated.
- How much new for-sale + rental construction is in the pipeline within 1–3 miles? Heavy new supply typically softens prices + rents 12–24 months out; constrained supply supports both.
Investment metrics
- 1% rule
- 1.37% ✓
- Cap rate
- 11.43%
- Cash-on-cash
- 18.35%
- DSCR
- 1.82
- GRM
- 6.1
CMA / ARV
- ARV (median comp)
- $183,956
- List price
- $115,900
- Delta
- -37.00%
- Verdict
- UNDERPRICED
- Comps
- 20 within 1.0 mi
Projected returns pro-forma
10.0% appreciation · 3.0% rent growth · sell at horizon
- IRR
- 37.9%
- Equity multiple
- 3.92×
- Total profit
- $94,729
- Equity at exit
- $104,412
- IRR
- 32.7%
- Equity multiple
- 8.83×
- Total profit
- $254,096
- Equity at exit
- $225,168
Cash invested: $32,452 (down + closing). Projections, not guarantees.
Landlord ↔ Tenant lean methodology
- Overall (STATE)
- 62 Landlord-Friendly
- State Pennsylvania
- 62 Landlord-Friendly · EVEN
- County
- — inherits STATE
- City
- — inherits STATE
ZIP-level market 16866
- Home prices YoY
- 12.0%
- Active inventory
- 36
- Price-to-rent
- 6.1×
Monthly cashflow live
- Estimated rent
- $1,586 medium interval (Pro) →
- Mortgage (P&I)
- −$608
- Tax from tax record
- −$101 /mo · $1,207/yr
- Insurance
- −$48
- HOA
- −$0
- Vacancy / Maint / Mgmt
- −$333
- Net cashflow
- $496
Break-even live
UW: 25.0% down · 7.5% · 30yr · 1.5% tax · 5.0% vac · 8.0% maint · 8.0% mgmt
Financing live
Cash to close
- Down payment
- $28,975
- Closing costs
- $3,477
- Reserves months
- —
- Total cash needed
- —
Loan-product check · same deal, 3 products live
Conventional
25% down · 7.5% · 30yr
- Down + closing
- —
- Monthly P&I
- —
- Monthly cashflow
- —
- DSCR
- —
- Eligible?
- —
Personal DTI + credit; lowest rate.
DSCR
20% down · 8.5% · 30yr
- Down + closing
- —
- Monthly P&I
- —
- Monthly cashflow
- —
- DSCR
- —
- Eligible?
- —
No personal income docs; deal must DSCR.
Hard money
10% down · 12.0% · 12mo
- Down + closing
- —
- Monthly P&I
- —
- Monthly cashflow
- —
- DSCR
- —
- Eligible?
- —
Short-term bridge; refi at stabilization.
Listing history 15 events
-
2026-06-18days on market $115,900 Active 230 DOM
-
2026-06-17days on market $115,900 Active 229 DOM
-
2026-06-16days on market $115,900 Active 228 DOM
-
2026-06-15days on market $115,900 Active 227 DOM
-
2026-06-13days on market $115,900 Active 225 DOM
-
2026-06-12days on market $115,900 Active 224 DOM
-
2026-06-09days on market $115,900 Active 221 DOM
-
2026-06-08days on market $115,900 Active 220 DOM
-
2026-06-08days on market $115,900 Active 219 DOM
-
2026-06-07days on market $115,900 Active 218 DOM
-
2026-06-04days on market $115,900 Active 215 DOM
-
2026-06-02days on market $115,900 Active 214 DOM
-
2026-06-01days on market $115,900 Active 213 DOM
-
2026-05-31days on market $115,900 Active 212 DOM
-
2025-10-31$115,900 Active 714-char remark
Show marketing remark (714 chars)
Welcome to 334 Hemlock Street, located in the charming south side of Philipsburg. This property features a cozy 0.11-acre fenced lot, ideal for children and pets to play safely. Inside, you will find three bedrooms and one bathroom. The home is equipped with a mini-split system, providing efficient heating and cooling year-round. Additionally, a pellet stove serves as a warm and rustic backup heat source, perfect for cozy evenings. Currently, the property is leased with an 18-month rental agreement set to conclude on June 30, 2027. The tenant is responsible for the monthly rent of $1,100 and any utility costs. Contact us to schedule your private showing and explore the possibilities at 334 Hemlock Street!
ⓘ Source: listings_history table (triggers on properties + properties_extension) + one-shot
backfill from property_details.listing_events for pre-trigger history.
Tax reassessment forecast PA · Partial reset (capped growth)
- Current annual tax
- $1,207 · $101/mo
- Projected year-2 tax
- $1,519 · $127/mo
- Expected delta
- +$312/yr (+$26/mo · 25.8%)
ⓘ Screening estimate from a state-policy table — verify with the county assessor before closing.
Climate risk First Street
- Flood 1/10 Low FEMA zone X (unshaded) · 0% chance over 30 yrs
- Wildfire 2/10 Low
- Heat 3/10 Moderate 7 d/yr ≥89°F today · 18 d/yr by 30 yrs out
- Wind 2/10 Low
- Air quality 2/10 Low 1 unhealthy d/yr today · 2 by 30 yrs out
Nearby sold comps map
Loading sold comps map…
Walkable amenities ~0.75 mi
Loading nearby amenities…
Taxation est. · year 1
- Rental income
- $19,033
- − Mortgage interest
- −$6,492
- − Property taxes
- −$1,207
- − Insurance
- −$580
- − Repairs & maintenance
- −$1,523
- − Management
- −$1,523
- − Depreciation
- −$3,372
- Taxable income
- $4,337
- Est. tax owed @ 24.0%
- −$1,041
- After-tax cash flow
- $4,915/yr
For passive investors: Depreciation is non-cash, so a rental often shows a tax loss while cash-flowing — sheltering income. Rental losses are passive: they offset passive income freely, and up to $25,000/yr can offset ordinary (W-2) income if you actively participate and your MAGI is under $100k (phasing out to $0 by $150k); unused losses carry forward. On sale, claimed depreciation is recaptured at up to 25%, and gains may owe capital-gains tax (a 1031 exchange can defer both). Figures are a year-1 estimate at your 24.0% rate — not tax advice; consult a CPA.
Schools (NCES district)
- District
- Philipsburg-Osceola Area SD
- NCES district ID
- 4219020
- Math proficiency
- 42% ▼ -9.00%
- Reading proficiency
- 52% ▼ -10.00%
- Median HH income
- $40,645
- Composite
- 39.37/100
- National rank
- #3977
- State rank
- #258 of 539 in PA
Livability — Rush
No livability data for this city. (Only ~50 U.S. cities are tracked.)
Census & demographics
- Census place
- South Philipsburg, PA
- Population (ZIP)
- 8,924
Population outlook (Centre County) Hauer SSP2
- Today (2025)
- 177,113 people
- By 2030
- 185,138 · +4.5%
- By 2040
- 196,009 · +10.7%
- By 2050
- 205,070 · +15.8%
- By 2075
- 217,575 · +22.8%
- By 2100
- 230,649 · +30.2%
Race, ethnicity, and origin ACS 2023
- Neighborhood character
- Predominantly White (86%)
- Race & ethnicity
- White 86% Hispanic / Latino 6% Black 6% Two or more races 3%
- Hispanic origin (detail)
- Mexican 2% Dominican 1%
- Common ancestry
- Romanian 7% Slovak 2% Polish 1%
- Foreign-born
- 7% · Canada, Jamaica
- Languages at home
- 92% English-only · Spanish 6%
Political lean MEDSL · Centre
- 2024 margin
- Toss-up / Even · D 50.9% · R 48.1% · Other 1.0%
- 2008→2024 swing
- -9.0pp toward R · 2008: 11.8pp · 2024: 2.8pp
- All cycles
- 2024: D+2.8 2020: D+4.8 2016: D+1.9 2012: R+0.0 2008: D+11.8
Not yet ingested
- Civics
- —
Market trends
- HPI YoY
- ▲ 30.47%
- Current HPI
- 284.148
- Rent YoY
- —
- Metro
- —
- State GDP YoY
- ▲ 1.68%
- F500 in state
- 34
Industry mix (Fortune 500 HQ in PA)
| Industry | F500 HQs | Revenue |
|---|---|---|
| Healthcare | 2 | $309B |
|
||
| Insurance | 2 | $27B |
|
||
| Telecommunications / Media | 1 | $124B |
|
||
| Industrial Distribution | 1 | $22B |
|
||
| Financial Services | 1 | $20B |
|
||
| Chemicals / Materials | 1 | $18B |
|
||
Price history
1 event — show timeline
- 2025-10-31 Listed $115,900 BRIGHT MLS
Property tax history
+2.2%/yrLatest (2026): $1,207 · +3.7% YoY. Source: county tax records.
Cash-flow waterfall
monthlySold comps — $/sqft
last 12 mo · ≤1 miLoading sold comps…