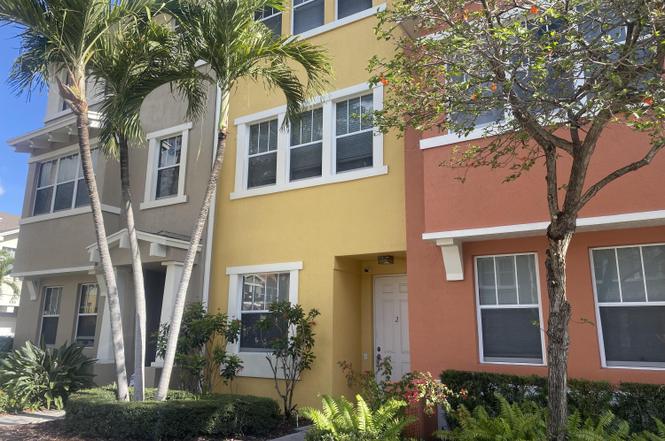
1740 San Benito Way #2 · West Palm Beach, FL
Flood risk 1/10 · Minimal
- FEMA flood zone
- X (unshaded)
- Chance of flooding over 30 yrs
- 0.0%
- Est. flood insurance / yr
- $507 – $1,088
Fire risk 1/10 · Minimal
- Est. fire insurance / yr
- $947 – $1,759
Heat risk 9/10 · Severe
- Hot days now (above 105°F)
- 5 days/yr
- Hot days in 30 yrs
- 17 days/yr
Wind risk 10/10 · Severe
- Chance of severe wind over 30 yrs
- 99.0%
Air-quality risk 2/10 · Minimal
- Unhealthy air days now
- 1 days/yr
- Unhealthy air days in 30 yrs
- 1 days/yr
Risk factors via First Street. Map © Google.
Why this score? — see what drove the D+ grade
The composite is a weighted blend of 9 inputs, each scored 0–100. Each bar is that input's sub-score; the figure is the points it added to the 100-point composite (weight × sub-score).
- Cash flow +15.5/30.0
- ARV discount +7.5/15.0
- 1% rule +7.1/10.0
- DSCR +4.8/10.0
- Schools +4.3/10.0
- Livability +4.1/5.0
- Rent growth +3.8/5.0
- Condition / age +2.5/5.0
- Appreciation +0.0/10.0
$309,000
🖨 Deal sheet (PDF) 📄 Offer letter ✓ Due diligence
Listing remarks
Completely renovated 2-bedroom, 2.5-bath townhouse in the gated Cityside community of West Palm Beach. This move-in ready home features an open floor plan with tile flooring throughout the main living areas, a beautifully updated kitchen with white cabinets, granite countertops, and stainless-steel appliances, plus a spacious dining area ideal for entertaining. Upstairs offers two large bedrooms, each with its own private updated bathroom. The home has been tastefully upgraded and meticulously maintained. Located just minutes from downtown West Palm Beach, shopping, dining, and major highways. Enjoy resort-style community amenities in a prime location.
Key facts
- Gated community
- Open floor plan
- Updated kitchen
Tags
Property features AI
Finance
- Other: Pets allowed (cats and dogs; pet restrictions possible)
- HOA & community: Monthly association fee of 900; Association covers common areas
Exterior
- Parking: Detached garage; 1 garage space; 1 covered space; Guest parking
- Utilities: Public water; Public sewer; Cable available; Electricity connected
- Home design: Condominium; Resale condition; 3-story building; Faces southwest
- Construction: Brick construction; Other roof
- Exterior features: Not waterfront; Pool (community)
Interior
- Kitchen: Dishwasher; Microwave; Refrigerator
- Bedrooms: 2 main-level bedrooms
- Flooring: Carpet; Tile
- Bathrooms: 2 full bathrooms; 1 half bathroom
- Heating & cooling: Central heating; Central air; Ceiling fan(s)
- Interior features: Built-in features; Dishwasher; Microwave; Refrigerator
- Laundry & utility: Washer hookup
Neighborhood map
What this means for you Summary
Snapshot
- This is a 3-bed/2.5-bath condo listed at $309k.
Deal economics
- At list price, monthly cash flow is $123 ($1k/yr) — positive.
- The deal already cash-flows at list — no discount required.
- Meets the 1% rule at list price ($4k rent vs $309k).
- Recommended offer: $300k (3.0% below list) — sets the bar for market timing.
- Cap rate 6.8% vs local median 3.8% in West Palm Beach — top-decile yield for the area; either an underpriced asset or a hidden risk that comps aren't pricing in. Stress-test before assuming the spread holds.
Location & tenants
- Location reads 82/100 on livability (#75 in FL, #1,255 nationally) — a professional / high-income tenant draw. Strengths: commute A+, housing A+, health & safety A+; Watch: employment C-, crime F.
- Palm Beach (suburban): math 46% / reading 53% proficiency, ranked #34 of 73 in FL (top 47%) — families likely to look elsewhere, expect single-tenant / working-renter base with shorter leases.
- Market conditions: Rents rising fast (+5.2%/yr); 507 active listings in the ZIP; 36 comparable units currently listed for rent nearby; rentals at typical pace (median 26d on market — plan ~3-4 weeks tenant-placement turnaround); 3,974 units permitted in Palm Beach County in 2024 (1,012 in 5+ unit buildings).
- At $3,745/mo this rent would consume 66% of the median local household income ($68k/yr) (locally 2953% of renters already pay >50% of income on rent) — very limited rent-growth headroom before tenants either downsize or default.
Forward outlook
- Local home prices are declining (-3.0%/yr); year-one equity from $2k of loan paydown is wiped out by about $9k of value loss. Plan a longer hold.
- Palm Beach County population projected at +30% by 2050 — long-run rental-demand tailwind backs the buy-and-hold thesis.
Negotiation context
- It's been on market 57 days — a 3% lower offer ($300k) is reasonable based on typical stale-listing flexibility.
- 5 sale attempts since 18y ago with the ask held roughly flat each time — persistent listings suggest the price (not the market) is what's stuck; bring a comps-based counter.
- Current owner paid $140k; list at $309k implies a 121% gain — meaningful room to come down on a strong offer.
Risks & watch-outs
- Watch-outs: HOA is 24% of rent.
- Climate carrying-cost: severe wind risk, 99% chance of damaging wind over 30y; extreme-heat days projected 5→17/yr by 2055 (HVAC capex compounding) — expect insurance premiums to compound above CPI over the hold.
Questions for the listing agent
- It's been on market 57 days. Have you received any prior offers? Is the seller open to a 3% concession, seller financing, or rate buy-down credit?
- What does the HOA fee cover, when was the last increase, and are there any pending special assessments or reserve-fund shortfalls?
- Any open or pending special assessments — roof, HVAC, plumbing, elevator, façade? What's the per-unit balance and payoff schedule, and is the seller paying it off at close or rolling it to the buyer?
- Is there a deadline driving the sale (1031 exchange, divorce, estate, relocation)? That informs how much negotiation room exists.
- Crime grade is F in this area — have there been break-ins, vandalism, or insurance claims at this property in the last 3 years? What carrier currently insures it and at what premium?
- The area grade is low — what's the realistic commute time and amenity access for the typical tenant pool here? Any planned neighborhood developments (good or bad) we should know about?
- What's the average days-on-market for RENTAL listings here right now (not sales)? A rising rental-DOM trend means longer vacancies and softer asking-rent achievability than the comps imply.
- What's the recent tenant-quality profile in this submarket — average credit score on applications, eviction rate, late-payment / NSF rate, and stable-employment percentage? A property-management company in the area should have these aggregated.
- How much new apartment / multifamily construction is in the pipeline within 1–3 miles? Heavy new supply (>2% of stock underway) typically softens rents 12–24 months out; light construction supports rent growth.
Investment metrics
- 1% rule
- 1.21% ✓
- Cap rate
- 6.77%
- Cash-on-cash
- 1.70%
- DSCR
- 1.08
- GRM
- 6.9
CMA / ARV
No comps found within radius.
Projected returns pro-forma
-3.0% appreciation · 5.15% rent growth · sell at horizon
- IRR
- -10.3%
- Equity multiple
- 0.61×
- Total profit
- $-33,494
- Equity at exit
- $46,073
- IRR
- 2.6%
- Equity multiple
- 1.21×
- Total profit
- $18,357
- Equity at exit
- $26,717
Cash invested: $86,520 (down + closing). Projections, not guarantees.
Landlord ↔ Tenant lean methodology
- Overall (STATE)
- 87 Strongly Landlord-Friendly
- State Florida
- 87 Strongly Landlord-Friendly · R+3
- County
- — inherits STATE
- City
- — inherits STATE
ZIP-level market 33401
- Rents YoY
- 5.2%
- Active inventory
- 507
- Price-to-rent
- 6.9×
Monthly cashflow live
- Estimated rent
- $3,745 high interval (Pro) →
- Mortgage (P&I)
- −$1,620
- Tax from tax record
- −$186 /mo · $2,236/yr
- Insurance
- −$129
- HOA
- −$900
- Vacancy / Maint / Mgmt
- −$786
- Net cashflow
- $123
Break-even live
Sensitivity live
| Price | -10% $298 | -5% $210 | +0% $123 | +5% $35 | +10% $-52 |
|---|---|---|---|---|---|
| Rent | -10% $-173 | -5% $-25 | +0% $123 | +5% $271 | +10% $419 |
| Rate | -1.0pp $278 | -0.5pp $201 | base $123 | +0.5pp $43 | +1.0pp $-39 |
UW: 25.0% down · 7.5% · 30yr · 1.5% tax · 5.0% vac · 8.0% maint · 8.0% mgmt
Financing live
Cash to close
- Down payment
- $77,250
- Closing costs
- $9,270
- Reserves months
- —
- Total cash needed
- —
Loan-product check · same deal, 3 products live
Conventional
25% down · 7.5% · 30yr
- Down + closing
- —
- Monthly P&I
- —
- Monthly cashflow
- —
- DSCR
- —
- Eligible?
- —
Personal DTI + credit; lowest rate.
DSCR
20% down · 8.5% · 30yr
- Down + closing
- —
- Monthly P&I
- —
- Monthly cashflow
- —
- DSCR
- —
- Eligible?
- —
No personal income docs; deal must DSCR.
Hard money
10% down · 12.0% · 12mo
- Down + closing
- —
- Monthly P&I
- —
- Monthly cashflow
- —
- DSCR
- —
- Eligible?
- —
Short-term bridge; refi at stabilization.
Rent comps 36 comps
| Address | Beds | Baths | Sqft | Rent | $/sqft | DOM | Units | Dist |
|---|---|---|---|---|---|---|---|---|
| 290 Courtney Lakes Cir West Palm Beach, FL | 1.0–3.0 | 1.0–2.0 | 1069 | $3,250 | $3.04 | 20d | 19 | 0.11mi |
| 1714 Consulate Pl #101 West Palm Beach, FL | 3.0 | 3.0 | 1377 | $3,000 | $2.18 | 25d | 1 | 0.89mi |
| 1979 Brandywine Rd Unit 1979-108 West Palm Beach, FL | 3.0 | 2.0 | 1395 | $3,205 | $2.30 | 25d | 1 | 0.95mi |
| 1900 Consulate Pl #1005 West Palm Beach, FL | 2.0 | 2.0 | 1557 | $4,900 | $3.15 | 15d | 1 | 1.00mi |
| 1319 13th St West Palm Beach, FL | 3.0 | 2.0 | 1215 | $3,200 | $2.63 | 25d | 1 | 1.08mi |
| 1991 Presidential Way West Palm Beach, FL | 3.0 | 2.0 | 1485 | $4,905 | $3.30 | 17d | 1 | 1.11mi |
| 2425 Presidential Way West Palm Beach, FL | 2.0 | 2.0 | 1294 | $4,500 | $3.48 | 25d | 1 | 1.15mi |
| 300 S Australian Ave West Palm Beach, FL | 3.0 | 2.0 | 1377 | $6,000 | $4.36 | 25d | 1 | 1.17mi |
| 300 S Australian Ave #1605 West Palm Beach, FL | 3.0 | 2.0 | 1188 | $4,800 | $4.04 | 25d | 1 | 1.17mi |
| 300 S Australian Ave #419 West Palm Beach, FL | 2.0 | 2.0 | 1186 | $3,750 | $3.16 | 18d | 1 | 1.17mi |
| 300 S Australian Ave #1418 West Palm Beach, FL | 2.0 | 2.0 | 1225 | $7,000 | $5.71 | 0d | 1 | 1.17mi |
| 300 S Australian Ave West Palm Beach, FL | 2.0 | 2.0 | 1245 | $3,250 | $2.61 | 0d | 1 | 1.17mi |
| 300 S Australian Ave #125 West Palm Beach, FL | 2.0 | 2.5 | 1871 | $7,000 | $3.74 | 11d | 1 | 1.17mi |
| 300 S Australian Ave #1608 West Palm Beach, FL | 2.0 | 2.0 | 1085 | $6,000 | $5.53 | 25d | 1 | 1.17mi |
| 201 Clearwater Dr West Palm Beach, FL | 2.0 | 1.0–2.0 | 731 | $6,632 | $9.07 | 12d | 16 | 1.20mi |
| 201 Clearwater Dr West Palm Beach, FL | 2.0 | 1.0–2.0 | 727 | $4,653 | $6.40 | 25d | 19 | 1.20mi |
| 1115 Windsor Ave West Palm Beach, FL | 4.0 | 3.0 | 1377 | $3,500 | $2.54 | 19d | 1 | 1.24mi |
| 2450 Presidential Way #7 West Palm Beach, FL | 2.0 | 2.0 | 1855 | $4,700 | $2.53 | 25d | 1 | 1.28mi |
| 2450 Presidential Way #7 West Palm Beach, FL | 2.0 | 2.0 | 1855 | $4,700 | $2.53 | 3d | 1 | 1.28mi |
| 2480 Presidential Way #902 West Palm Beach, FL | 2.0 | 2.0 | 1855 | $4,650 | $2.51 | 6d | 1 | 1.30mi |
| 2480 Presidential Way #1903 West Palm Beach, FL | 2.0 | 2.0 | 1855 | $4,650 | $2.51 | 25d | 1 | 1.30mi |
| 921 8th St West Palm Beach, FL | 3.0 | 1.0 | 1000 | $3,395 | $3.40 | 25d | 1 | 1.31mi |
| 616 Clearwater Park Rd West Palm Beach, FL | 2.0 | 2.0 | 1090 | $3,348 | $3.07 | 15d | 2 | 1.31mi |
| 616 Clearwater Park Rd West Palm Beach, FL | 2.0 | 2.0 | 1130 | $3,245 | $2.87 | 4d | 3 | 1.31mi |
| 616 Clearwater Park Rd West Palm Beach, FL | 2.0 | 2.0 | 1112 | $3,348 | $3.01 | 6d | 2 | 1.31mi |
| 616 Clearwater Park Rd West Palm Beach, FL | 2.0 | 2.0 | 1090 | $3,248 | $2.98 | 12d | 3 | 1.31mi |
| 2615 Hiawatha Ave West Palm Beach, FL | 3.0 | 2.0 | 1276 | $2,950 | $2.31 | 4d | 1 | 1.32mi |
| 616 Clearwater Park Rd Unit Lp01 West Palm Beach, FL | 2.0 | 2.0 | 1112 | $3,495 | $3.14 | 25d | 1 | 1.32mi |
| 2665 Hiawatha Ave West Palm Beach, FL | 3.0 | 2.0 | 1276 | $3,005 | $2.36 | 25d | 1 | 1.32mi |
| 2671 Hiawatha Ave West Palm Beach, FL | 3.0 | 2.0 | 1276 | $3,005 | $2.36 | 25d | 1 | 1.33mi |
| 2677 Hiawatha Ave West Palm Beach, FL | 3.0 | 2.0 | 1276 | $3,005 | $2.36 | 25d | 1 | 1.33mi |
| 2117 Longwood Rd West Palm Beach, FL | 4.0 | 2.0 | 1112 | $5,000 | $4.50 | 25d | 1 | 1.33mi |
| 2683 Hiawatha Ave West Palm Beach, FL | 3.0 | 2.0 | 1276 | $3,005 | $2.36 | 25d | 1 | 1.33mi |
| 2689 Hiawatha Ave West Palm Beach, FL | 3.0 | 2.0 | 1276 | $2,950 | $2.31 | 4d | 1 | 1.33mi |
| 926 14th St West Palm Beach, FL | 4.0 | 2.0 | 1050 | $3,000 | $2.86 | 16d | 1 | 1.42mi |
| 1104 State St Unit C West Palm Beach, FL | 3.0 | 1.0 | 875 | $3,000 | $3.43 | 25d | 1 | 1.50mi |
HOA detail condo
- Monthly dues
- $900 · $10,800/yr
- Likely covers
- security
- Assessments
- None detected in remarks — confirm with the listing agent.
Listing history 12 events
-
2026-05-07status Pending
-
2026-03-11$309,000 Active
-
2026-02-23historical
-
2025-09-24price $336,900
-
2025-08-22$346,900 Active
-
2025-05-12historical
-
2025-03-20price $359,900
-
2025-02-19$369,900 Active
-
2024-04-18$419,000 Active
-
2008-07-31soldstatus $140,000
-
2008-07-15historical
-
2008-05-16$143,000
ⓘ Source: listings_history table (triggers on properties + properties_extension) + one-shot
backfill from property_details.listing_events for pre-trigger history.
Tax reassessment forecast FL · Resets to sale price
- Current annual tax
- $2,236 · $186/mo
- Projected year-2 tax
- $2,565 · $214/mo
- Expected delta
- +$329/yr (+$27/mo · 14.7%)
ⓘ Screening estimate from a state-policy table — verify with the county assessor before closing.
Climate risk First Street
- Flood 1/10 Low FEMA zone X (unshaded) · 0% chance over 30 yrs
- Wildfire 1/10 Low
- Heat 9/10 Extreme 5 d/yr ≥105°F today · 17 d/yr by 30 yrs out
- Wind 10/10 Extreme 99% chance of damaging wind over 30 yrs
- Air quality 2/10 Low 1 unhealthy d/yr today · 1 by 30 yrs out
Nearby sold comps map
Loading sold comps map…
Walkable amenities ~0.75 mi
Loading nearby amenities…
Taxation est. · year 1
- Rental income
- $44,935
- − Mortgage interest
- −$17,309
- − Property taxes
- −$2,236
- − Insurance
- −$1,545
- − Repairs & maintenance
- −$3,595
- − Management
- −$3,595
- − HOA
- −$10,800
- − Depreciation
- −$8,989
- Taxable loss
- −$3,133
- Est. tax savings @ 24.0%
- +$752
- After-tax cash flow
- $2,225/yr
For passive investors: Depreciation is non-cash, so a rental often shows a tax loss while cash-flowing — sheltering income. Rental losses are passive: they offset passive income freely, and up to $25,000/yr can offset ordinary (W-2) income if you actively participate and your MAGI is under $100k (phasing out to $0 by $150k); unused losses carry forward. On sale, claimed depreciation is recaptured at up to 25%, and gains may owe capital-gains tax (a 1031 exchange can defer both). Figures are a year-1 estimate at your 24.0% rate — not tax advice; consult a CPA.
Schools (NCES district)
- District
- Palm Beach
- NCES district ID
- 1201500
- Math proficiency
- 46% ▼ -16.00%
- Reading proficiency
- 53% ▼ -4.00%
- Median HH income
- $53,943
- Composite
- 42.72/100
- National rank
- #3160
- State rank
- #34 of 73 in FL
Livability — West Palm Beach
- Score
- 82/100
- State rank
- #75
- US rank
- #1255
Category grades
Schools grade is shown separately in the Schools card above.
Census & demographics
- Census place
- West Palm Beach, FL
- County
- Palm Beach County · 1,438,312 people
- City population
- 222,012
- Metro
- Miami-Fort Lauderdale-Pompano Beach, FL
- Population (ZIP)
- 33,698
- Household income
- $67,967
- Rent vs Own
- Severe rent burden
- 2953.0
Population outlook (Palm Beach County) Hauer SSP2
- Today (2025)
- 1,637,487 people
- By 2030
- 1,743,255 · +6.5%
- By 2040
- 1,948,712 · +19.0%
- By 2050
- 2,132,979 · +30.3%
- By 2075
- 2,530,027 · +54.5%
- By 2100
- 2,706,979 · +65.3%
Race, ethnicity, and origin ACS 2023
- Neighborhood character
- Diverse neighborhood (Simpson 0.68)
- Race & ethnicity
- White 43% Black 32% Hispanic / Latino 17% Two or more races 11% Asian 3%
- Hispanic origin (detail)
- Mexican 2% Puerto Rican 3% Cuban 3%
- Common ancestry
- Hispanic 6% Slovak 2% Romanian 2%
- Foreign-born
- 26% · Canada, Jamaica, China
- Languages at home
- 73% English-only · Spanish 13% French/Haitian/Cajun 7% Other Asian/Pacific 2%
Political lean MEDSL · Palm Beach
- 2024 margin
- Toss-up / Even · D 50.0% · R 49.2%
- 2008→2024 swing
- -22.1pp toward R · 2008: 22.9pp · 2024: 0.8pp
- All cycles
- 2024: D+0.8 2020: D+12.8 2016: D+15.3 2012: D+17.0 2008: D+22.9
Not yet ingested
- Civics
- —
Market trends
- HPI YoY
- ▼ -324.96%
- Current HPI
- 367.0978
- Rent YoY
- ▲ 5.15%
- Metro
- Miami-Fort Lauderdale-Pompano Beach, FL
- State GDP YoY
- ▲ 3.28%
- F500 in state
- 36
Industry mix (Fortune 500 HQ in FL)
| Industry | F500 HQs | Revenue |
|---|---|---|
| Industrial Technology | 2 | $29B |
|
||
| Insurance | 2 | $17B |
|
||
| Retail | 1 | $60B |
|
||
| Technology Distribution | 1 | $58B |
|
||
| Homebuilding | 1 | $35B |
|
||
| Technology Manufacturing | 1 | $35B |
|
||
Price history
+116.1% since first listed12 events — show timeline
- 2026-05-07 Pending — Beaches MLS
- 2026-03-11 Listed $309,000 Beaches MLS
- 2026-02-23 Listing Removed — Beaches MLS
- 2025-09-24 Price Changed $336,900 Beaches MLS
- 2025-08-22 Listed $346,900 Beaches MLS
- 2025-05-12 Listing Removed — Beaches MLS
- 2025-03-20 Price Changed $359,900 Beaches MLS
- 2025-02-19 Listed $369,900 Beaches MLS
- 2024-04-18 Listed $419,000 MARMLS
- 2008-07-31 Sold (MLS) $140,000 Beaches MLS
- 2008-07-15 Listing Removed — Beaches MLS
- 2008-05-16 Listed $143,000 Beaches MLS
Property tax history
+6.0%/yrLatest (2025): $2,236 · +3.6% YoY. Source: county tax records.
Cash-flow waterfall
monthlySold comps — $/sqft
last 12 mo · ≤1 miLoading sold comps…