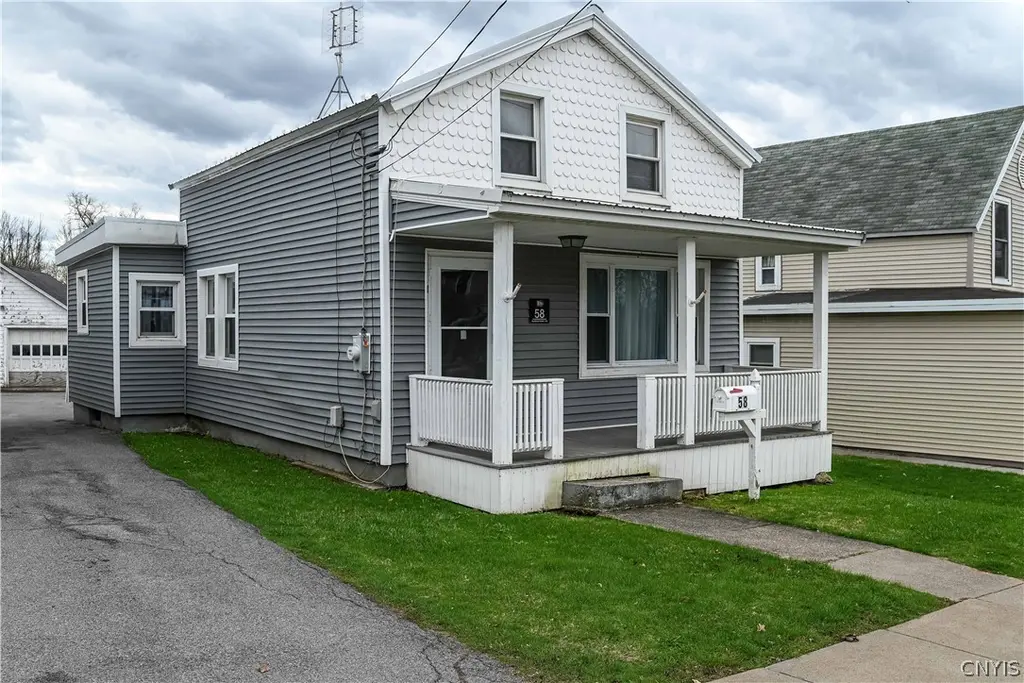
58 Burrstone Rd · New York Mills, NY
Flood risk 1/10 · Minimal
- FEMA flood zone
- X (unshaded)
- Chance of flooding over 30 yrs
- 0.0%
- Est. flood insurance / yr
- $473 – $860
Fire risk 1/10 · Minimal
- Est. fire insurance / yr
- $691 – $1,283
Heat risk 3/10 · Minor
- Hot days now (above 95°F)
- 7 days/yr
- Hot days in 30 yrs
- 16 days/yr
Wind risk 1/10 · Minimal
- Chance of severe wind over 30 yrs
- 1.0%
Air-quality risk 2/10 · Minimal
- Unhealthy air days now
- 0 days/yr
- Unhealthy air days in 30 yrs
- 2 days/yr
Risk factors via First Street. Map © Google.
Why this score? — see what drove the B- grade
The composite is a weighted blend of 9 inputs, each scored 0–100. Each bar is that input's sub-score; the figure is the points it added to the 100-point composite (weight × sub-score).
- Cash flow +20.6/30.0
- ARV discount +12.2/15.0
- Appreciation +10.0/10.0
- DSCR +6.5/10.0
- 1% rule +5.2/10.0
- Schools +5.2/10.0
- Livability +3.9/5.0
- Rent growth +2.5/5.0
- Condition / age +2.5/5.0
$179,900
🖨 Deal sheet 📄 Offer letter ✓ Due diligence
Listing remarks MLS
Very well maintained, move in Ready, Bungalow in desirable NY Mills school district. This home provides 3-4 Bedrooms. There is a very large, enclosed, covered Hot Tub area behind Garage !Very deep backyard (324 feet)Includes 2 tax parcels. This wonderful home has Central Air and a convenient, 1st floor Laundry. A definite, must see home !!! Motivated Seller!!!
Key facts
- Deep double lot
- Updated kitchen
- Expansive backyard
Tags
Property features AI
Exterior
- Parking: Detached garage with electricity; 1-car garage
- Utilities: Electricity connected; High-speed internet available; Sewer connected; Public water connected
- Home design: Single-story property (listed as 1 story total); Resale condition
- Construction: Shingle roof; Vinyl siding; Block foundation; Copper and PEX plumbing
- Exterior features: Blacktop driveway; Rectangular residential lot; City street frontage; Hot tub
Interior
- Kitchen: Gas oven; Gas range; Refrigerator
- Bedrooms: Three bedrooms total — two on the second level and one on the main level
- Flooring: Laminate; Vinyl; Varies
- Bathrooms: One full bathroom
- Heating & cooling: Gas forced-air heating
- Interior features: Ceiling fan(s); Separate/formal dining room; Entrance foyer; Separate/formal living room; Country kitchen; Hot tub/spa; Bedroom on main level; Full basement
- Laundry & utility: Main-level laundry; Gas water heater
Neighborhood map
What this means for you Summary
Snapshot
- This is a 3-bed/1.0-bath single-family listed at $180k.
Deal economics
- At list price, monthly cash flow is $240 ($3k/yr) — positive.
- The deal already cash-flows at list — no discount required.
- Meets the 1% rule at list price ($2k rent vs $180k).
- Recommended offer: $169k (6.0% below list) — sets the bar for market timing.
- Cap rate 7.9% vs local median 5.1% in New York Mills — top-decile yield for the area; either an underpriced asset or a hidden risk that comps aren't pricing in. Stress-test before assuming the spread holds.
Location & tenants
- Location reads 78/100 on livability (#175 in NY, #2,712 nationally) — a middle-class / working-renter tenant base. Strengths: health & safety A+, cost of living A, housing A; Watch: amenities F, commute F.
- New York Mills Union Free School District (suburban): math 60% / reading 65% proficiency, ranked #224 of 590 in NY (top 38%) — acceptable for families but not a draw, mixed tenant base, ~2y average lease.
- Market conditions: 10 active listings in the ZIP; 4 comparable units currently listed for rent nearby; rentals lingering (median 44d on market — plan ~5-8 weeks vacancy on turnover, expect pricing pressure); 100% of comp listings sitting > 30 days — soft ceiling on asking rent; 204 units permitted in Oneida County in 2024 (68 in 5+ unit buildings).
Forward outlook
- In year one you build about $19k of equity ($1k loan paydown + $18k appreciation (10.0% local appreciation)).
- Oneida County population projected at -12% by 2050 — secular population decline; favor cash flow + early exit over multi-decade hold.
- At projected returns (10.0% appreciation + 3.0% rent growth), your $50k cash investment doubles in ~3 years — after that, you're playing with house money.
- By year 2, paydown + projected appreciation supports a ~$31k cash-out refi (75% LTV) — recoverable capital for the next deal without selling this one.
Negotiation context
- It's been on market 63 days — a 6% lower offer ($169k) is reasonable based on typical stale-listing flexibility.
- 3 sale attempts since 8y ago; this cycle's ask has dropped $10k (5%) from the opening price — seller is motivated, your offer sets the floor, not the list.
- Current owner paid $110k; list at $180k implies a 64% gain — meaningful room to come down on a strong offer.
Risks & watch-outs
- Watch-outs: built in 1890 — expect roof / HVAC / electrical / plumbing capex.
Questions for the listing agent
- It's been on market 63 days. Have you received any prior offers? Is the seller open to a 6% concession, seller financing, or rate buy-down credit?
- Built in 1890 — when were the roof, HVAC, electrical panel, plumbing, and water heater last replaced?
- Why hasn't it sold? Are there any deal-killer items the seller is aware of (foundation, flood, title, zoning, code violations)?
- Is there a deadline driving the sale (1031 exchange, divorce, estate, relocation)? That informs how much negotiation room exists.
- Schools are B-rated — typically a magnet for longer-tenancy family renters. What's the average tenant stay here, and is there a school-zone premium baked into asking?
- What's the average days-on-market for RENTAL listings here right now (not sales)? A rising rental-DOM trend means longer vacancies and softer asking-rent achievability than the comps imply.
- What's the recent tenant-quality profile in this submarket — average credit score on applications, eviction rate, late-payment / NSF rate, and stable-employment percentage? A property-management company in the area should have these aggregated.
- How much new for-sale + rental construction is in the pipeline within 1–3 miles? Heavy new supply typically softens prices + rents 12–24 months out; constrained supply supports both.
Investment metrics
- 1% rule
- 1.02% ✓
- Cap rate
- 7.90%
- Cash-on-cash
- 5.73%
- DSCR
- 1.25
- GRM
- 8.2
CMA / ARV
- ARV (on-the-fly)
- $200,746
- Comps found
- 11
Show comp detail 11 sales within ~0.75 mi
| Address | Dist | Beds/Ba | Sqft | Sold | Price | $/sf | Match |
|---|---|---|---|---|---|---|---|
| 93 Burrstone Rd | 0.18mi | 3/1.0 | 1,055 (-4%) | 8mo | $190,000 | $180 | 78 |
| 115 Fairway Dr | 0.31mi | 3/1.0 | 1,140 (+3%) | 17mo | $195,000 | $171 | 65 |
| 26 Burr Ave | 0.54mi | 3/1.0 | 1,080 (-2%) | 16mo | $196,100 | $182 | 58 |
| 71 Young Ave | 0.22mi | 2/1.5 (-1) | 1,258 (+14%) | 4mo | $195,000 | $155 | 56 |
| 30 Maple St | 0.48mi | 3/1.5 | 999 (-9%) | 5mo | $180,000 | $180 | 56 |
| 228 Fairway Dr | 0.58mi | 3/1.0 | 1,025 (-7%) | 9mo | $225,000 | $220 | 53 |
| 13 West Dr | 0.56mi | 3/1.0 | 1,014 (-8%) | 14mo | $200,000 | $197 | 48 |
| 116 Winchester Dr | 0.49mi | 3/2.0 | 1,198 (+9%) | 15mo | $155,000 | $129 | 46 |
| 303 Washington Dr | 0.70mi | 2/1.0 (-1) | 1,196 (+8%) | 7mo | $220,000 | $184 | 43 |
| 219 Fairway Dr | 0.51mi | 3/2.0 | 1,213 (+10%) | 15mo | $275,000 | $227 | 43 |
| 4 Royal Brook Ln | 0.54mi | 2/1.5 (-1) | 980 (-11%) | 19mo | $185,000 | $189 | 33 |
Match score weights: distance 35% · size 25% · config 20% · recency 20%. Top-matched comps best support the ARV.
Projected returns pro-forma
10.0% appreciation · 3.0% rent growth · sell at horizon
- IRR
- 28.4%
- Equity multiple
- 3.25×
- Total profit
- $113,291
- Equity at exit
- $162,068
- IRR
- 24.7%
- Equity multiple
- 7.38×
- Total profit
- $321,595
- Equity at exit
- $349,506
Cash invested: $50,372 (down + closing). Projections, not guarantees.
Landlord ↔ Tenant lean methodology
- Overall (STATE)
- 15 Strongly Tenant-Friendly
- State New York
- 15 Strongly Tenant-Friendly · D+10
- County
- — inherits STATE
- City
- — inherits STATE
ZIP-level market 13417
- Home prices YoY
- 11.9%
- Active inventory
- 10
- Price-to-rent
- 8.2×
Monthly cashflow live
- Estimated rent
- $1,832 medium interval (Pro) →
- Mortgage (P&I)
- −$943
- Tax from tax record
- −$188 /mo · $2,261/yr
- Insurance
- −$75
- HOA
- −$0
- Vacancy / Maint / Mgmt
- −$385
- Net cashflow
- $240
Break-even live
UW: 25.0% down · 7.5% · 30yr · 1.5% tax · 5.0% vac · 8.0% maint · 8.0% mgmt
Financing live
Cash to close
- Down payment
- $44,975
- Closing costs
- $5,397
- Reserves months
- —
- Total cash needed
- —
Loan-product check · same deal, 3 products live
Conventional
25% down · 7.5% · 30yr
- Down + closing
- —
- Monthly P&I
- —
- Monthly cashflow
- —
- DSCR
- —
- Eligible?
- —
Personal DTI + credit; lowest rate.
DSCR
20% down · 8.5% · 30yr
- Down + closing
- —
- Monthly P&I
- —
- Monthly cashflow
- —
- DSCR
- —
- Eligible?
- —
No personal income docs; deal must DSCR.
Hard money
10% down · 12.0% · 12mo
- Down + closing
- —
- Monthly P&I
- —
- Monthly cashflow
- —
- DSCR
- —
- Eligible?
- —
Short-term bridge; refi at stabilization.
Rent comps 4 comps
| Address | Beds | Baths | Sqft | Rent | $/sqft | DOM | Units | Dist |
|---|---|---|---|---|---|---|---|---|
| 77 Clinton St New York Mills, NY | 2.0 | 1.0 | 777 | $1,450 | $1.86 | 44d | 7 | 0.63mi |
| 4770 Middle Settlement Rd Whitesboro, NY | 1.0–2.0 | 1.0 | 725 | $2,085 | $2.88 | 44d | 1 | 1.17mi |
| 1503 Fox Pl Utica, NY | 3.0 | 1.0 | 1119 | $2,000 | $1.79 | 44d | 1 | 1.17mi |
| 4 1st St Yorkville, NY | 3.0 | 1.0 | 888 | $2,100 | $2.36 | 44d | 1 | 1.48mi |
Listing history 20 events
-
2026-06-19days on market $179,900 Active 63 DOM
-
2026-06-18days on market $179,900 Active 62 DOM
-
2026-06-17days on market $179,900 Active 61 DOM
-
2026-06-16days on market $179,900 Active 60 DOM
-
2026-06-15days on market $179,900 Active 59 DOM
-
2026-06-14days on market $179,900 Active 57 DOM
-
2026-06-13days on market $179,900 Active 56 DOM
-
2026-06-10days on market $179,900 Active 54 DOM
-
2026-06-09days on market $179,900 Active 53 DOM
-
2026-06-08days on market $179,900 Active 52 DOM
-
2026-06-07days on market $179,900 Active 51 DOM
-
2026-06-02days on market $179,900 Active 46 DOM
-
2026-06-01days on market $179,900 Active 45 DOM
-
2026-05-31days on market $179,900 Active 44 DOM
-
2026-05-30days on market $179,900 Active 43 DOM
-
2026-04-17$189,900 Active
-
2018-09-17soldstatus $110,000 362-char remark
Show marketing remark (362 chars)
Very well maintained, move in Ready, Bungalow in desirable NY Mills school district. This home provides 3-4 Bedrooms. There is a very large, enclosed, covered Hot Tub area behind Garage !Very deep backyard (324 feet)Includes 2 tax parcels. This wonderful home has Central Air and a convenient, 1st floor Laundry. A definite, must see home !!! Motivated Seller!!!
-
2018-08-27soldstatus $110,000
-
2018-06-25$115,000 362-char remark
Show marketing remark (362 chars)
Very well maintained, move in Ready, Bungalow in desirable NY Mills school district. This home provides 3-4 Bedrooms. There is a very large, enclosed, covered Hot Tub area behind Garage !Very deep backyard (324 feet)Includes 2 tax parcels. This wonderful home has Central Air and a convenient, 1st floor Laundry. A definite, must see home !!! Motivated Seller!!!
-
2018-02-09$115,000
ⓘ Source: listings_history table (triggers on properties + properties_extension) + one-shot
backfill from property_details.listing_events for pre-trigger history.
Tax reassessment forecast NY · Partial reset (capped growth)
- Current annual tax
- $2,261 · $188/mo
- Projected year-2 tax
- $2,651 · $221/mo
- Expected delta
- +$390/yr (+$32/mo · 17.2%)
ⓘ Screening estimate from a state-policy table — verify with the county assessor before closing.
Climate risk First Street
- Flood 1/10 Low FEMA zone X (unshaded) · 0% chance over 30 yrs
- Wildfire 1/10 Low
- Heat 3/10 Moderate 7 d/yr ≥95°F today · 16 d/yr by 30 yrs out
- Wind 1/10 Low 100% chance of damaging wind over 30 yrs
- Air quality 2/10 Low 0 unhealthy d/yr today · 2 by 30 yrs out
Nearby sold comps map
Loading sold comps map…
Walkable amenities ~0.75 mi
Loading nearby amenities…
Taxation est. · year 1
- Rental income
- $21,982
- − Mortgage interest
- −$10,077
- − Property taxes
- −$2,261
- − Insurance
- −$900
- − Repairs & maintenance
- −$1,759
- − Management
- −$1,759
- − Depreciation
- −$5,233
- Taxable loss
- −$7
- Est. tax savings @ 24.0%
- +$2
- After-tax cash flow
- $2,886/yr
For passive investors: Depreciation is non-cash, so a rental often shows a tax loss while cash-flowing — sheltering income. Rental losses are passive: they offset passive income freely, and up to $25,000/yr can offset ordinary (W-2) income if you actively participate and your MAGI is under $100k (phasing out to $0 by $150k); unused losses carry forward. On sale, claimed depreciation is recaptured at up to 25%, and gains may owe capital-gains tax (a 1031 exchange can defer both). Figures are a year-1 estimate at your 24.0% rate — not tax advice; consult a CPA.
Schools (NCES district)
- District
- New York Mills Union Free School District
- NCES district ID
- 3620610
- Math proficiency
- 60% ▲ 5.00%
- Reading proficiency
- 65% ▲ 13.00%
- Median HH income
- $40,329
- Composite
- 52.21/100
- National rank
- #1605
- State rank
- #224 of 590 in NY
Livability — New York Mills
- Score
- 78/100
- State rank
- #175
- US rank
- #2712
Category grades
Schools grade is shown separately in the Schools card above.
Census & demographics
- Census place
- New York Mills, NY
- City population
- 3,012
- Population (ZIP)
- 3,012
Population outlook (Oneida County) Hauer SSP2
- Today (2025)
- 225,223 people
- By 2030
- 220,384 · -2.1%
- By 2040
- 209,071 · -7.2%
- By 2050
- 197,920 · -12.1%
- By 2075
- 175,541 · -22.1%
- By 2100
- 148,491 · -34.1%
Race, ethnicity, and origin ACS 2023
- Neighborhood character
- Predominantly White (99%)
- Race & ethnicity
- White 99% Asian 1%
- Common ancestry
- Romanian 21% Lithuanian 4% Serbian 2%
- Foreign-born
- 2%
- Languages at home
- 94% English-only · Russian/Polish/Slavic 4% Vietnamese 1% Other Indo-European 1%
Political lean MEDSL · Oneida
- 2024 margin
- Strong R (+21.3) · D 39.4% · R 60.6%
- 2008→2024 swing
- -15.2pp toward R · 2008: -6.1pp · 2024: -21.3pp
- All cycles
- 2024: R+21.3 2020: R+15.5 2016: R+21.1 2012: R+5.3 2008: R+6.1
Not yet ingested
- Civics
- —
Market trends
- HPI YoY
- ▲ 31.74%
- Current HPI
- 298.823
- Rent YoY
- —
- Metro
- —
- State GDP YoY
- ▲ 2.60%
- F500 in state
- 92
Industry mix (Fortune 500 HQ in NY)
| Industry | F500 HQs | Revenue |
|---|---|---|
| Financial Services | 10 | $950B |
|
||
| Consumer Goods | 9 | $162B |
|
||
| Insurance | 4 | $225B |
|
||
| Telecommunications | 2 | $144B |
|
||
| Pharmaceuticals | 2 | $112B |
|
||
| Media / Entertainment | 2 | $69B |
|
||
Price history
+65.1% since first listed5 events — show timeline
- 2026-04-17 Listed $189,900 CNYIS
- 2018-09-17 Sold (MLS) $110,000 CNYIS
- 2018-08-27 Sold (Public Records) $110,000 Public Records
- 2018-06-25 Listed $115,000 CNYIS
- 2018-02-09 Listed $115,000 CNYIS
Property tax history
+3.2%/yrLatest (2025): $2,261 · -13.1% YoY. Source: county tax records.
Cash-flow waterfall
monthlySold comps — $/sqft
last 12 mo · ≤1 miLoading sold comps…