 🏗️ New Construction
12047 Henley Ave · North Port, FL
Flood risk 6/10 · Moderate
- FEMA flood zone
- X (unshaded)
- Chance of flooding over 30 yrs
- 0.67%
- Est. flood insurance / yr
- $507 – $1,088
Fire risk 3/10 · Minor
- Est. fire insurance / yr
- $947 – $1,759
Heat risk 10/10 · Severe
- Hot days now (above 107°F)
- 6 days/yr
- Hot days in 30 yrs
- 23 days/yr
Wind risk 10/10 · Severe
- Chance of severe wind over 30 yrs
- 99.0%
Air-quality risk 2/10 · Minimal
- Unhealthy air days now
- 1 days/yr
- Unhealthy air days in 30 yrs
- 1 days/yr
Risk factors via First Street. Map © Google.
Why this score? — see what drove the D+ grade
The composite is a weighted blend of 9 inputs, each scored 0–100. Each bar is that input's sub-score; the figure is the points it added to the 100-point composite (weight × sub-score).
- Cash flow +15.9/30.0
- ARV discount +7.5/15.0
- DSCR +4.9/10.0
- Schools +4.6/10.0
- Rent growth +3.8/5.0
- Livability +3.8/5.0
- 1% rule +3.1/10.0
- Condition / age +2.5/5.0
- Appreciation +0.0/10.0
$315,000
🖨 Deal sheet 📄 Offer letter ✓ Due diligence
Listing remarks MLS
Great location in East Englewood. This multi-family lot is close to shopping, area golf courses and beaches. Don't let this one pass you by. This is a great investment opportunity.
Key facts
- Granite countertops
- Sleek kitchen
- Upgraded cabinets
Tags
Property features AI
Finance
- Financial info: Gross income (pro forma): $52,800; Estimated annual net income: $40,200; Estimated annual expenses: $6,300; Two units total — each unit: 3 bedrooms, 2 bathrooms; pro forma rent $2,200 per unit
- HOA & community: No association indicated
Exterior
- Parking: Attached garage present
- Utilities: Public water; Sewer: Other; Other utilities
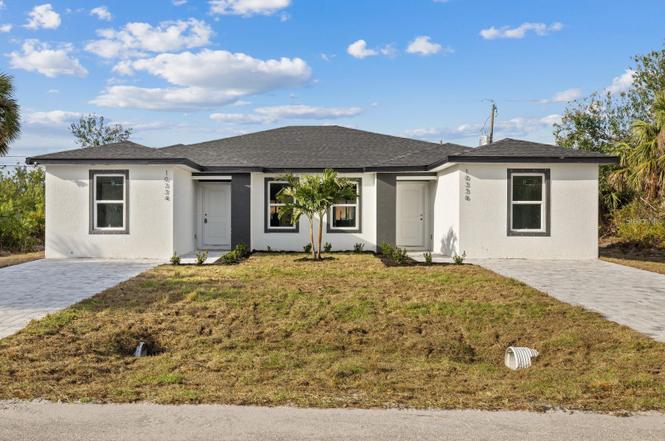
- Home design: Duplex residential income property; One level; Under construction (projected completion March 31, 2026); New construction
- Construction: Block construction; Shingle roof; Slab foundation; Building area approximately 2,466 total; living area approximately 2,324
- Exterior features: Other exterior features; Paved road access
Interior
- Kitchen: No appliances included
- Bedrooms: 6 bedrooms total
- Flooring: Other flooring
- Bathrooms: Multiple bathrooms (unit breakdown: each 3-bedroom unit has 2 bathrooms)
- Heating & cooling: Other heating; Other cooling
- Interior features: Other interior features
- Laundry & utility: Dedicated laundry room
Neighborhood map
What this means for you Summary
Snapshot
- This is a 6-bed/4.0-bath land listed at $315k.
Deal economics
- At list price, monthly cash flow is $151 ($2k/yr) — positive.
- The deal already cash-flows at list — no discount required.
- To meet the 1% rule (rent ≥ 1% of price), the offer needs to be $256k (18.9% below list).
- Recommended offer: $256k (18.9% below list) — sets the bar for 1% rule.
- Cap rate 6.9% vs local median 3.6% in North Port — top-decile yield for the area; either an underpriced asset or a hidden risk that comps aren't pricing in. Stress-test before assuming the spread holds.
Location & tenants
- Location reads 75/100 on livability (#252 in FL, #3,975 nationally) — a middle-class / working-renter tenant base. Strengths: crime A+, housing A+, health & safety A+; Watch: amenities F, commute F.
- Charlotte (suburban): math 54% / reading 54% proficiency, ranked #22 of 73 in FL (top 30%) — acceptable for families but not a draw, mixed tenant base, ~2y average lease.
- Zoned schools: Myakka River Elementary School (math 65% / reading 60%, grade B, #601 of 2,144 statewide, top 28%, 608 students, 51% FRL); Port Charlotte High School (math 23% / reading 38%, grade F, #434 of 667 statewide, top 66%, 1,649 students, 43% FRL).
- Market conditions: Rents rising fast (+5.3%/yr); 2188 active listings in the ZIP; solid renter incomes; 4,585 units permitted in Charlotte County in 2024 (703 in 5+ unit buildings).
- This rent runs 36% of the median local income ($84k/yr) — at the standard rent-burdened threshold; future hikes will face affordability resistance.
Forward outlook
- Local home prices are declining (-3.0%/yr); year-one equity from $2k of loan paydown is wiped out by about $9k of value loss. Plan a longer hold.
- Charlotte County population projected at +24% by 2050 — long-run rental-demand tailwind backs the buy-and-hold thesis.
Negotiation context
- It's been on market 255 days — a 12% lower offer ($277k) is reasonable based on typical stale-listing flexibility.
- 4 sale attempts since 22y ago; this cycle's ask has dropped $28k (8%) from the opening price — seller is motivated, your offer sets the floor, not the list.
- Current owner paid $118k; list at $315k implies a 167% gain — meaningful room to come down on a strong offer.
Risks & watch-outs
- Climate carrying-cost: major flood risk; severe wind risk, 99% chance of damaging wind over 30y; extreme-heat days projected 6→23/yr by 2055 (HVAC capex compounding) — expect insurance premiums to compound above CPI over the hold.
Questions for the listing agent
- It's been on market 255 days. Have you received any prior offers? Is the seller open to a 19% concession, seller financing, or rate buy-down credit?
- Why hasn't it sold? Are there any deal-killer items the seller is aware of (foundation, flood, title, zoning, code violations)?
- Is there a deadline driving the sale (1031 exchange, divorce, estate, relocation)? That informs how much negotiation room exists.
- Schools are B-rated — typically a magnet for longer-tenancy family renters. What's the average tenant stay here, and is there a school-zone premium baked into asking?
- The area grade is low — what's the realistic commute time and amenity access for the typical tenant pool here? Any planned neighborhood developments (good or bad) we should know about?
- What's the average days-on-market for RENTAL listings here right now (not sales)? A rising rental-DOM trend means longer vacancies and softer asking-rent achievability than the comps imply.
- What's the recent tenant-quality profile in this submarket — average credit score on applications, eviction rate, late-payment / NSF rate, and stable-employment percentage? A property-management company in the area should have these aggregated.
- How much new for-sale + rental construction is in the pipeline within 1–3 miles? Heavy new supply typically softens prices + rents 12–24 months out; constrained supply supports both.
Investment metrics
- 1% rule
- 0.81% ✗
- Cap rate
- 6.87%
- Cash-on-cash
- 2.06%
- DSCR
- 1.09
- GRM
- 10.3
CMA / ARV
No comps found within radius.
Projected returns pro-forma
-3.0% appreciation · 5.29% rent growth · sell at horizon
- IRR
- -10.9%
- Equity multiple
- 0.60×
- Total profit
- $-35,536
- Equity at exit
- $46,968
- IRR
- 1.0%
- Equity multiple
- 1.08×
- Total profit
- $6,753
- Equity at exit
- $27,235
Cash invested: $88,200 (down + closing). Projections, not guarantees.
Landlord ↔ Tenant lean methodology
- Overall (STATE)
- 87 Strongly Landlord-Friendly
- State Florida
- 87 Strongly Landlord-Friendly · R+3
- County
- — inherits STATE
- City
- — inherits STATE
ZIP-level market 33981
- Home prices YoY
- -7.5%
- Rents YoY
- 5.3%
- Active inventory
- 2188
- Price-to-rent
- 10.3×
Monthly cashflow live
- Estimated rent
- $2,556 medium interval (Pro) →
- Mortgage (P&I)
- −$1,652
- Tax from tax record
- −$85 /mo · $1,016/yr
- Insurance
- −$131
- HOA
- −$0
- Vacancy / Maint / Mgmt
- −$537
- Net cashflow
- $151
Break-even live
UW: 25.0% down · 7.5% · 30yr · 1.5% tax · 5.0% vac · 8.0% maint · 8.0% mgmt
Financing live
Cash to close
- Down payment
- $78,750
- Closing costs
- $9,450
- Reserves months
- —
- Total cash needed
- —
Loan-product check · same deal, 3 products live
Conventional
25% down · 7.5% · 30yr
- Down + closing
- —
- Monthly P&I
- —
- Monthly cashflow
- —
- DSCR
- —
- Eligible?
- —
Personal DTI + credit; lowest rate.
DSCR
20% down · 8.5% · 30yr
- Down + closing
- —
- Monthly P&I
- —
- Monthly cashflow
- —
- DSCR
- —
- Eligible?
- —
No personal income docs; deal must DSCR.
Hard money
10% down · 12.0% · 12mo
- Down + closing
- —
- Monthly P&I
- —
- Monthly cashflow
- —
- DSCR
- —
- Eligible?
- —
Short-term bridge; refi at stabilization.
Listing history 29 events
-
2026-06-18days on market $315,000 Active 255 DOM
-
2026-06-17days on market $315,000 Active 254 DOM
-
2026-06-16days on market $315,000 Active 253 DOM
-
2026-06-15days on market $315,000 Active 252 DOM
-
2026-06-14days on market $315,000 Active 250 DOM
-
2026-06-13days on market $315,000 Active 249 DOM
-
2026-06-10days on market $315,000 Active 247 DOM
-
2026-06-09days on market $315,000 Active 246 DOM
-
2026-06-08days on market $315,000 Active 245 DOM
-
2026-06-05days on market $315,000 Active 241 DOM
-
2026-06-02days on market $315,000 Active 239 DOM
-
2026-06-01days on market $315,000 Active 238 DOM
-
2026-05-31days on market $315,000 Active 237 DOM
-
2026-05-30pricedays on market $315,000 Active 236 DOM
-
2026-03-01price $327,900
-
2025-10-06$342,900 Active
-
2025-09-17price $342,900
-
2023-02-07soldstatus $118,000
-
2022-08-29soldstatus $50,000
-
2022-08-26soldstatus $50,000 Closed 180-char remark
Show marketing remark (180 chars)
Great location in East Englewood. This multi-family lot is close to shopping, area golf courses and beaches. Don't let this one pass you by. This is a great investment opportunity.
-
2022-07-04status Pending 180-char remark
Show marketing remark (180 chars)
Great location in East Englewood. This multi-family lot is close to shopping, area golf courses and beaches. Don't let this one pass you by. This is a great investment opportunity.
-
2022-06-07$55,000 Active 180-char remark
Show marketing remark (180 chars)
Great location in East Englewood. This multi-family lot is close to shopping, area golf courses and beaches. Don't let this one pass you by. This is a great investment opportunity.
-
2004-09-20soldstatus $30,000
-
2004-09-07soldstatus $29,900
-
2004-09-07soldstatus $29,900
-
2004-05-24$29,950
-
2004-05-24$29,950
-
2004-05-20soldstatus $15,000
-
2004-04-19soldstatus $30,000
ⓘ Source: listings_history table (triggers on properties + properties_extension) + one-shot
backfill from property_details.listing_events for pre-trigger history.
Tax reassessment forecast FL · Resets to sale price
- Current annual tax
- $1,016 · $85/mo
- Projected year-2 tax
- $2,614 · $218/mo
- Expected delta
- +$1,598/yr (+$133/mo · 157.3%)
ⓘ Screening estimate from a state-policy table — verify with the county assessor before closing.
Climate risk First Street
- Flood 6/10 Major FEMA zone X (unshaded) · 67% chance over 30 yrs
- Wildfire 3/10 Moderate
- Heat 10/10 Extreme 6 d/yr ≥107°F today · 23 d/yr by 30 yrs out
- Wind 10/10 Extreme 99% chance of damaging wind over 30 yrs
- Air quality 2/10 Low 1 unhealthy d/yr today · 1 by 30 yrs out
Nearby sold comps map
Loading sold comps map…
Walkable amenities ~0.75 mi
Loading nearby amenities…
Taxation est. · year 1
- Rental income
- $30,670
- − Mortgage interest
- −$17,645
- − Property taxes
- −$1,016
- − Insurance
- −$1,575
- − Repairs & maintenance
- −$2,454
- − Management
- −$2,454
- − Depreciation
- −$9,164
- Taxable loss
- −$3,637
- Est. tax savings @ 24.0%
- +$873
- After-tax cash flow
- $2,688/yr
For passive investors: Depreciation is non-cash, so a rental often shows a tax loss while cash-flowing — sheltering income. Rental losses are passive: they offset passive income freely, and up to $25,000/yr can offset ordinary (W-2) income if you actively participate and your MAGI is under $100k (phasing out to $0 by $150k); unused losses carry forward. On sale, claimed depreciation is recaptured at up to 25%, and gains may owe capital-gains tax (a 1031 exchange can defer both). Figures are a year-1 estimate at your 24.0% rate — not tax advice; consult a CPA.
Schools (NCES district)
- District
- Charlotte
- NCES district ID
- 1200240
- Math proficiency
- 54% ▼ -6.00%
- Reading proficiency
- 54% ▼ -1.00%
- Median HH income
- $44,864
- Composite
- 45.62/100
- National rank
- #2586
- State rank
- #22 of 73 in FL
Livability — North Port
- Score
- 75/100
- State rank
- #252
- US rank
- #3975
Category grades
Schools grade is shown separately in the Schools card above.
Census & demographics
- County
- Charlotte County · 196,994 people
- City population
- 75,324
- Metro
- Punta Gorda, FL
- Population (ZIP)
- 15,622
- Household income
- $84,098
- Rent vs Own
- Severe rent burden
- 105.0
Population outlook (Charlotte County) Hauer SSP2
- Today (2025)
- 198,646 people
- By 2030
- 210,507 · +6.0%
- By 2040
- 230,857 · +16.2%
- By 2050
- 247,148 · +24.4%
- By 2075
- 281,777 · +41.8%
- By 2100
- 293,609 · +47.8%
Race, ethnicity, and origin ACS 2023
- Neighborhood character
- Predominantly White (89%)
- Race & ethnicity
- White 89% Two or more races 4% Hispanic / Latino 4% Black 2% Asian 1%
- Common ancestry
- Romanian 4% Lithuanian 3% Italian 2%
- Foreign-born
- 6% · Canada
- Languages at home
- 96% English-only · Spanish 1% German/W. Germanic 1% Tagalog/Filipino 1%
Political lean MEDSL · Charlotte
- 2024 margin
- Solid R (+34.0) · D 32.7% · R 66.7%
- 2008→2024 swing
- -26.7pp toward R · 2008: -7.2pp · 2024: -34.0pp
- All cycles
- 2024: R+34.0 2020: R+26.6 2016: R+27.8 2012: R+14.3 2008: R+7.2
Not yet ingested
- Civics
- —
Market trends
- HPI YoY
- ▼ -28.09%
- Current HPI
- 346.5247
- Rent YoY
- ▲ 5.29%
- Metro
- Punta Gorda, FL
- State GDP YoY
- ▲ 3.28%
- F500 in state
- 36
Industry mix (Fortune 500 HQ in FL)
| Industry | F500 HQs | Revenue |
|---|---|---|
| Industrial Technology | 2 | $29B |
|
||
| Insurance | 2 | $17B |
|
||
| Retail | 1 | $60B |
|
||
| Technology Distribution | 1 | $58B |
|
||
| Homebuilding | 1 | $35B |
|
||
| Technology Manufacturing | 1 | $35B |
|
||
Price history
+993.0% since first listed15 events — show timeline
- 2026-03-01 Price Changed $327,900 Stellar MLS as Distributed by MLS Grid
- 2025-10-06 Listed $342,900 Stellar MLS as Distributed by MLS Grid
- 2025-09-17 Price Changed $342,900 Stellar MLS as Distributed by MLS Grid
- 2023-02-07 Sold (Public Records) $118,000 Public Records
- 2022-08-29 Sold (Public Records) $50,000 Public Records
- 2022-08-26 Sold (MLS) $50,000 Stellar MLS as Distributed by MLS Grid
- 2022-07-04 Pending — Stellar MLS as Distributed by MLS Grid
- 2022-06-07 Listed $55,000 Stellar MLS as Distributed by MLS Grid
- 2004-09-20 Sold (Public Records) $30,000 Public Records
- 2004-09-07 Sold (MLS) $29,900 Stellar MLS as Distributed by MLS Grid
- 2004-09-07 Sold (MLS) $29,900 Stellar MLS as Distributed by MLS Grid
- 2004-05-24 Listed $29,950 Stellar MLS as Distributed by MLS Grid
- 2004-05-24 Listed $29,950 Stellar MLS as Distributed by MLS Grid
- 2004-05-20 Sold (Public Records) $15,000 Public Records
- 2004-04-19 Sold (Public Records) $30,000 Public Records
Property tax history
+12.9%/yrLatest (2025): $1,016 · +21.6% YoY. Source: county tax records.
Cash-flow waterfall
monthlySold comps — $/sqft
last 12 mo · ≤1 miLoading sold comps…