2500 Parkview Dr #315 · Hallandale Beach, FL
Flood risk 9/10 · Severe
- FEMA flood zone
- AE
- Chance of flooding over 30 yrs
- 0.99%
- Est. flood insurance / yr
- $1,737 – $8,500
Fire risk 1/10 · Minimal
- Est. fire insurance / yr
- $947 – $1,759
Heat risk 10/10 · Severe
- Hot days now (above 104°F)
- 7 days/yr
- Hot days in 30 yrs
- 24 days/yr
Wind risk 10/10 · Severe
- Chance of severe wind over 30 yrs
- 99.0%
Air-quality risk 2/10 · Minimal
- Unhealthy air days now
- 1 days/yr
- Unhealthy air days in 30 yrs
- 2 days/yr
Risk factors via First Street. Map © Google.
Why this score? — see what drove the C- grade
The composite is a weighted blend of 9 inputs, each scored 0–100. Each bar is that input's sub-score; the figure is the points it added to the 100-point composite (weight × sub-score).
- Cash flow +15.6/30.0
- 1% rule +10.0/10.0
- ARV discount +7.5/15.0
- DSCR +4.8/10.0
- Schools +4.1/10.0
- Livability +4.0/5.0
- Rent growth +2.6/5.0
- Condition / age +2.5/5.0
- Appreciation +0.0/10.0
$267,000
🖨 Deal sheet 📄 Offer letter ✓ Due diligence
Listing remarks
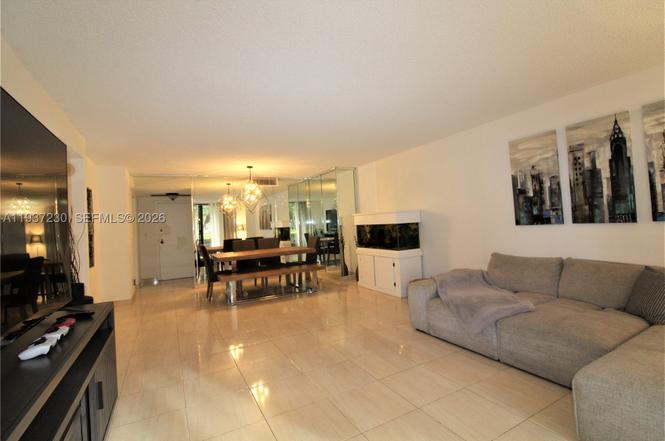
INVESTMENT OPPORTUNITY - Resort-style living at OLYMPUS. Experience tranquil garden views from this expansive 2-bedroom, 2-bath residence offering 1,280 sq. ft. of refined living space. Soaring ceilings and oversized closets create an open, sophisticated ambiance, while the original condition presents a rare opportunity to customize a luxury retreat to your taste. Priced to sell and located in the prestigious Olympus community in Hallandale Beach. Surrounded by impeccably maintained grounds, this private residence overlooks a lush tropical setting and features tile flooring throughout with a soft, neutral palette. The generously sized terrace invites effortless indoor-outdoor living—p
Key facts
- Heated pools
- Billiards
- Tennis courts
Tags
Property features AI
Finance
- Financial info: Pets: Cats allowed (no dogs)
- HOA & community: Monthly association fee; Association covers management, amenities, cable TV, insurance, internet, laundry, grounds maintenance, pest control, reserve fund, roof, sewer, security, trash, and water; Community amenities include billiard room, marina, bike storage, fitness center, laundry, barbecue/picnic area, pool, shuffleboard, sauna, storage, tennis courts, transportation service, and vehicle wash area; 1,090 units in community
Exterior
- Parking: Assigned parking; One covered space; Valet; 1-car garage
- Security: Doorman; Secured garage/parking; Key card entry; Smoke detector(s)
- Utilities: Cable available
- Home design: Attached property; Entry on 3rd level; 25-story building
- Construction: Block construction; Resale property
- Exterior features: Balcony; Screened balcony; Heated pool; Intracoastal access waterfront
Interior
- Kitchen: Dishwasher; Electric range; Disposal; Refrigerator
- Bedrooms: Bedroom on main level
- Flooring: Ceramic tile; Tile
- Bathrooms: 2 full bathrooms
- Heating & cooling: Central heating; Central air conditioning
- Interior features: Blinds; Bedroom on main level; Breakfast area; Family/dining room; First floor entry; Main living area entry level; Pantry; Separate shower; Walk-in closet(s)
- Laundry & utility: Common area laundry
Neighborhood map
What this means for you Summary
Snapshot
- This is a 2-bed/2.0-bath condo listed at $267k.
Deal economics
- At list price, monthly cash flow is $-315 ($-4k/yr) — negative.
- To cash-flow at today's rent, offer at most $211k (20.8% below list).
- Meets the 1% rule at list price ($4k rent vs $267k).
- Recommended offer: $211k (20.8% below list) — sets the bar for cash-flow.
- Cap rate 6.8% vs local median 5.2% in Hallandale Beach — meaningfully above typical; check what's discounted (condition, days-on-market, listing class) to confirm the premium yield is real.
Location & tenants
- Location reads 81/100 on livability (#86 in FL, #1,400 nationally) — a professional / high-income tenant draw. Strengths: commute A+, health & safety A+, crime B+; Watch: schools C-, employment D-.
- Broward (suburban): math 42% / reading 53% proficiency, ranked #46 of 73 in FL (top 63%) — families likely to look elsewhere, expect single-tenant / working-renter base with shorter leases.
- Market conditions: Rents flat; 1373 active listings in the ZIP; 40 comparable units currently listed for rent nearby; rentals at typical pace (median 15d on market — plan ~3-4 weeks tenant-placement turnaround); 2,111 units permitted in Broward County in 2024 (1,265 in 5+ unit buildings).
- At $4,230/mo this rent would consume 97% of the median local household income ($52k/yr) (locally 3293% of renters already pay >50% of income on rent) — very limited rent-growth headroom before tenants either downsize or default.
Forward outlook
- Local home prices are declining (-3.0%/yr); year-one equity from $2k of loan paydown is wiped out by about $8k of value loss. Plan a longer hold.
- Broward County population projected at +34% by 2050 — long-run rental-demand tailwind backs the buy-and-hold thesis.
Negotiation context
- It's been on market 159 days — a 12% lower offer ($235k) is reasonable based on typical stale-listing flexibility.
- 6 sale attempts since 7y ago with the ask held roughly flat each time — persistent listings suggest the price (not the market) is what's stuck; bring a comps-based counter.
- Current owner paid $140k; list at $267k implies a 91% gain — meaningful room to come down on a strong offer.
Risks & watch-outs
- Watch-outs: flood insurance adds $427/mo; HOA is 28% of rent.
- Climate carrying-cost: in FEMA flood zone AE (mandatory federal flood insurance); severe wind risk, 99% chance of damaging wind over 30y; extreme-heat days projected 7→24/yr by 2055 (HVAC capex compounding) — expect insurance premiums to compound above CPI over the hold.
Questions for the listing agent
- What do current leases actually rent for vs. the listed asking? Can we see a recent rent roll and the last 12 months of T-12 income?
- It's been on market 159 days. Have you received any prior offers? Is the seller open to a 21% concession, seller financing, or rate buy-down credit?
- What's the actual annual flood-insurance premium (NFIP or private), and is the property in a SFHA with mandatory coverage?
- What does the HOA fee cover, when was the last increase, and are there any pending special assessments or reserve-fund shortfalls?
- Any open or pending special assessments — roof, HVAC, plumbing, elevator, façade? What's the per-unit balance and payoff schedule, and is the seller paying it off at close or rolling it to the buyer?
- Why hasn't it sold? Are there any deal-killer items the seller is aware of (foundation, flood, title, zoning, code violations)?
- Is there a deadline driving the sale (1031 exchange, divorce, estate, relocation)? That informs how much negotiation room exists.
- What's the average days-on-market for RENTAL listings here right now (not sales)? A rising rental-DOM trend means longer vacancies and softer asking-rent achievability than the comps imply.
- What's the recent tenant-quality profile in this submarket — average credit score on applications, eviction rate, late-payment / NSF rate, and stable-employment percentage? A property-management company in the area should have these aggregated.
- How much new apartment / multifamily construction is in the pipeline within 1–3 miles? Heavy new supply (>2% of stock underway) typically softens rents 12–24 months out; light construction supports rent growth.
Investment metrics
- 1% rule
- 1.58% ✓
- Cap rate
- 6.79%
- Cash-on-cash
- 1.79%
- DSCR
- 1.08
- GRM
- 5.3
CMA / ARV
No comps found within radius.
Projected returns pro-forma
-3.0% appreciation · 0.43% rent growth · sell at horizon
- IRR
- -30.8%
- Equity multiple
- 0.03×
- Total profit
- $-72,814
- Equity at exit
- $39,811
- IRR
- -77.7%
- Equity multiple
- -0.69×
- Total profit
- $-126,024
- Equity at exit
- $23,085
Cash invested: $74,760 (down + closing). Projections, not guarantees.
Landlord ↔ Tenant lean methodology
- Overall (STATE)
- 87 Strongly Landlord-Friendly
- State Florida
- 87 Strongly Landlord-Friendly · R+3
- County
- — inherits STATE
- City
- — inherits STATE
ZIP-level market 33009
- Rents YoY
- 0.4%
- Active inventory
- 1373
- Price-to-rent
- 5.3×
Monthly cashflow live
- Estimated rent
- $4,230 high interval (Pro) →
- Mortgage (P&I)
- −$1,400
- Tax from tax record
- −$519 /mo · $6,228/yr
- Insurance
- −$111
- Flood insurance flood zone
- −$427 /mo · $5,118/yr
- HOA
- −$1,200
- Vacancy / Maint / Mgmt
- −$888
- Net cashflow
- $-315
Break-even live
UW: 25.0% down · 7.5% · 30yr · 1.5% tax · 5.0% vac · 8.0% maint · 8.0% mgmt
Financing live
Cash to close
- Down payment
- $66,750
- Closing costs
- $8,010
- Reserves months
- —
- Total cash needed
- —
Loan-product check · same deal, 3 products live
Conventional
25% down · 7.5% · 30yr
- Down + closing
- —
- Monthly P&I
- —
- Monthly cashflow
- —
- DSCR
- —
- Eligible?
- —
Personal DTI + credit; lowest rate.
DSCR
20% down · 8.5% · 30yr
- Down + closing
- —
- Monthly P&I
- —
- Monthly cashflow
- —
- DSCR
- —
- Eligible?
- —
No personal income docs; deal must DSCR.
Hard money
10% down · 12.0% · 12mo
- Down + closing
- —
- Monthly P&I
- —
- Monthly cashflow
- —
- DSCR
- —
- Eligible?
- —
Short-term bridge; refi at stabilization.
Rent comps 40 comps
| Address | Beds | Baths | Sqft | Rent | $/sqft | DOM | Units | Dist |
|---|---|---|---|---|---|---|---|---|
| 2500 Parkview Dr #2518 Hallandale Beach, FL | 2.0 | 2.0 | 1280 | $4,000 | $3.12 | 7d | 1 | 0.01mi |
| 2500 Parkview Dr #2518 Hallandale Beach, FL | 2.0 | 2.0 | 1280 | $4,000 | $3.12 | 14d | 1 | 0.01mi |
| 2500 Parkview Dr #1112 Hallandale Beach, FL | 2.0 | 2.0 | 1580 | $3,800 | $2.41 | 24d | 1 | 0.01mi |
| 2753 S Parkview Dr Hallandale Beach, FL | 2.0 | 2.0 | 1680 | $3,699 | $2.20 | 17d | 1 | 0.14mi |
| 513 Leslie Dr #513 Hallandale Beach, FL | 3.0 | 2.0 | 1624 | $5,250 | $3.23 | 24d | 1 | 0.16mi |
| 523 Leslie Dr Hallandale Beach, FL | 3.0 | 2.0 | 1624 | $4,950 | $3.05 | 24d | 1 | 0.17mi |
| 825 NE 26th Ave Hallandale Beach, FL | 3.0 | 2.0 | 1844 | $4,200 | $2.28 | 24d | 1 | 0.20mi |
| 3800 S Ocean Dr #1818 Hollywood, FL | 2.0 | 2.0 | 1270 | $4,200 | $3.31 | 7d | 1 | 0.41mi |
| 3800 S Ocean Dr #1818 Hollywood, FL | 2.0 | 2.0 | 1270 | $3,800 | $2.99 | 5d | 1 | 0.41mi |
| 3800 S Ocean Dr Hollywood, FL | 2.0 | 2.0 | 1302 | $3,750 | $2.88 | 4d | 3 | 0.42mi |
| 3800 S Ocean Dr Hollywood, FL | 2.0 | 2.0 | 1301 | $3,775 | $2.90 | 5d | 2 | 0.42mi |
| 1529 Shoreline Way #1529 Hollywood, FL | 3.0 | 2.0 | 1784 | $7,500 | $4.20 | 1d | 1 | 0.43mi |
| 1529 Shoreline Way #1529 Hollywood, FL | 3.0 | 2.5 | 1784 | $7,750 | $4.34 | 12d | 1 | 0.43mi |
| 1529 Shoreline Way Hollywood, FL | 3.0 | 2.5 | 1784 | $7,500 | $4.20 | 7d | 1 | 0.43mi |
| 3505 S Ocean Dr Hollywood, FL | 1.0–2.0 | 1.5–2.0 | 1085 | $6,500 | $5.99 | 10d | 18 | 0.45mi |
| 3505 S Ocean Dr Hollywood, FL | 1.0–2.0 | 1.5–2.0 | 1085 | $6,500 | $5.99 | 12d | 17 | 0.45mi |
| 3101 S Ocean Dr #1904 Hollywood, FL | 2.0 | 2.5 | 1733 | $5,500 | $3.17 | 22d | 1 | 0.45mi |
| 3101 S Ocean Dr #1504 Hollywood, FL | 2.0 | 2.5 | 1733 | $7,500 | $4.33 | 24d | 1 | 0.45mi |
| 3725 S Ocean Dr Hollywood, FL | 2.0–3.0 | 2.0 | 1377 | $4,000 | $2.90 | 2d | 7 | 0.48mi |
| 3725 S Ocean Dr Hollywood, FL | 2.0–3.0 | 2.0 | 1377 | $4,000 | $2.90 | 14d | 8 | 0.48mi |
| 3725 S Ocean Dr Hollywood, FL | 2.0–3.0 | 2.0 | 1454 | $4,000 | $2.75 | 24d | 6 | 0.48mi |
| 3725 S Ocean Dr Unit 1339235P Hollywood, FL | 2.0 | 2.0 | 1248 | $5,429 | $4.35 | 3d | 1 | 0.48mi |
| 3001 S Ocean Dr #1211 Hollywood, FL | 2.0 | 2.0 | 1208 | $4,750 | $3.93 | 24d | 1 | 0.48mi |
| 3001 S Ocean Dr #1211 Hollywood, FL | 2.0 | 2.0 | 1208 | $4,750 | $3.93 | 7d | 1 | 0.48mi |
| 1755 E Hallandale Beach Blvd Unit 1407E Hallandale Beach, FL | 2.0 | 2.0 | 1354 | $3,650 | $2.70 | 24d | 1 | 0.48mi |
| 1755 E Hallandale Beach Blvd Unit 2207E Hallandale Beach, FL | 2.0 | 2.0 | 1354 | $3,950 | $2.92 | 24d | 1 | 0.48mi |
| 4010 S Ocean Dr Hollywood, FL | 1.0–3.0 | 1.0–3.5 | 1078 | $7,250 | $6.73 | 24d | 5 | 0.48mi |
| 2601 E Hallandale Beach Blvd Unit 1227344P Hallandale Beach, FL | 1.0–2.0 | 1.0–2.0 | 844 | $4,219 | $5.00 | 1d | 2 | 0.50mi |
| 1745 E Hallandale Beach Blvd Unit 2302W Hallandale Beach, FL | 3.0 | 2.0 | 1481 | $3,900 | $2.63 | 15d | 1 | 0.50mi |
| 1745 E Hallandale Beach Blvd Unit 2302W Hallandale Beach, FL | 3.0 | 2.0 | 1481 | $3,900 | $2.63 | 24d | 1 | 0.50mi |
| 1745 E Hallandale Beach Blvd Unit 802W Hallandale Beach, FL | 3.0 | 2.0 | 1481 | $3,600 | $2.43 | 24d | 1 | 0.50mi |
| 2751 S Ocean Dr Unit 508S Hollywood, FL | 3.0 | 2.5 | 1868 | $5,300 | $2.84 | 17d | 1 | 0.50mi |
| 2751 S Ocean Dr Unit 508S Hollywood, FL | 3.0 | 2.5 | 1868 | $5,300 | $2.84 | 7d | 1 | 0.50mi |
| 2751 S Ocean Dr Unit 1705 Hollywood, FL | 2.0 | 2.0 | 1360 | $5,000 | $3.68 | 7d | 1 | 0.50mi |
| 4010 S Ocean Dr Unit R504 Hollywood, FL | 3.0 | 2.0 | 1122 | $10,000 | $8.91 | 24d | 1 | 0.50mi |
| 4010 S Ocean Dr Unit R1108 Hollywood, FL | 3.0 | 2.5 | 1361 | $12,999 | $9.55 | 24d | 1 | 0.50mi |
| 4010 S Ocean Dr Unit 1227485P Hollywood, FL | 2.0–3.0 | 2.0 | 1118 | $5,049 | $4.51 | 15d | 2 | 0.50mi |
| 4010 S Ocean Dr Unit T3708 Hollywood, FL | 3.0 | 2.5 | 1361 | $8,000 | $5.88 | 24d | 1 | 0.50mi |
| 4010 S Ocean Dr Unit T3609 Hollywood, FL | 2.0 | 2.0 | 1060 | $6,300 | $5.94 | 24d | 1 | 0.50mi |
| 4010 S Ocean Dr Unit T3609 Hollywood, FL | 2.0 | 2.0 | 1060 | $6,300 | $5.94 | 3d | 1 | 0.50mi |
HOA detail condo
- Monthly dues
- $1,200 · $14,400/yr
- Likely covers
- landscaping
- Assessments
- None detected in remarks — confirm with the listing agent.
Listing history 28 events
-
2026-06-18days on market $267,000 Active 159 DOM
-
2026-06-17days on market $267,000 Active 158 DOM
-
2026-06-16days on market $267,000 Active 157 DOM
-
2026-06-15days on market $267,000 Active 156 DOM
-
2026-06-13days on market $267,000 Active 154 DOM
-
2026-06-09days on market $267,000 Active 150 DOM
-
2026-06-07days on market $267,000 Active 148 DOM
-
2026-06-04days on market $267,000 Active 145 DOM
-
2026-06-03days on market $267,000 Active 144 DOM
-
2026-06-02days on market $267,000 Active 143 DOM
-
2026-06-01days on market $267,000 Active 142 DOM
-
2026-05-31days on market $267,000 Active 141 DOM
-
2026-01-10$267,000 Active
-
2025-05-23historical
-
2025-01-18$310,000 Active
-
2025-01-03historical
-
2023-11-07price $320,000
-
2023-08-11historical $2,400
-
2023-07-17price $2,400
-
2023-06-18$340,000 Active
-
2022-04-15status Active
-
2021-12-23$310,000 Active
-
2019-09-30soldstatus $140,000
-
2019-09-18soldstatus $140,000 Sold
-
2019-08-17status Pending
-
2019-08-09price $155,000
-
2019-05-19$170,000 Active
-
1994-08-31soldstatus $62,500
ⓘ Source: listings_history table (triggers on properties + properties_extension) + one-shot
backfill from property_details.listing_events for pre-trigger history.
Tax reassessment forecast FL · Resets to sale price
- Current annual tax
- $6,228 · $519/mo
- Projected year-2 tax
- $6,228 · $519/mo
- Expected delta
- $0/yr ($0/mo · 0.0%)
ⓘ Screening estimate from a state-policy table — verify with the county assessor before closing.
Climate risk First Street
- Flood 9/10 Extreme FEMA zone AE · 99% chance over 30 yrs
- Wildfire 1/10 Low
- Heat 10/10 Extreme 7 d/yr ≥104°F today · 24 d/yr by 30 yrs out
- Wind 10/10 Extreme 99% chance of damaging wind over 30 yrs
- Air quality 2/10 Low 1 unhealthy d/yr today · 2 by 30 yrs out
Nearby sold comps map
Loading sold comps map…
Walkable amenities ~0.75 mi
Loading nearby amenities…
Taxation est. · year 1
- Rental income
- $50,765
- − Mortgage interest
- −$14,956
- − Property taxes
- −$6,228
- − Insurance
- −$6,454
- − Repairs & maintenance
- −$4,061
- − Management
- −$4,061
- − HOA
- −$14,400
- − Depreciation
- −$7,767
- Taxable loss
- −$7,163
- Est. tax savings @ 24.0%
- +$1,719
- After-tax cash flow
- $-2,061/yr
For passive investors: Depreciation is non-cash, so a rental often shows a tax loss while cash-flowing — sheltering income. Rental losses are passive: they offset passive income freely, and up to $25,000/yr can offset ordinary (W-2) income if you actively participate and your MAGI is under $100k (phasing out to $0 by $150k); unused losses carry forward. On sale, claimed depreciation is recaptured at up to 25%, and gains may owe capital-gains tax (a 1031 exchange can defer both). Figures are a year-1 estimate at your 24.0% rate — not tax advice; consult a CPA.
Schools (NCES district)
- District
- Broward
- NCES district ID
- 1200180
- Math proficiency
- 42% ▼ -18.00%
- Reading proficiency
- 53% ▼ -5.00%
- Median HH income
- $52,139
- Composite
- 40.88/100
- National rank
- #3621
- State rank
- #46 of 73 in FL
Livability — Hallandale Beach
- Score
- 81/100
- State rank
- #86
- US rank
- #1400
Category grades
Schools grade is shown separately in the Schools card above.
Census & demographics
- Census place
- Hallandale Beach, FL
- County
- Broward County · 1,963,430 people
- City population
- 44,021
- Metro
- Miami-Fort Lauderdale-Pompano Beach, FL
- Population (ZIP)
- 44,502
- Household income
- $52,079
- Rent vs Own
- Severe rent burden
- 3293.0
Population outlook (Broward County) Hauer SSP2
- Today (2025)
- 2,207,033 people
- By 2030
- 2,360,704 · +7.0%
- By 2040
- 2,661,208 · +20.6%
- By 2050
- 2,946,698 · +33.5%
- By 2075
- 3,602,273 · +63.2%
- By 2100
- 3,970,984 · +79.9%
Race, ethnicity, and origin ACS 2023
- Neighborhood character
- Diverse neighborhood (Simpson 0.67)
- Race & ethnicity
- Hispanic / Latino 39% White 39% Two or more races 24% Black 17% Asian 1%
- Hispanic origin (detail)
- Mexican 2% Puerto Rican 3% Cuban 9% Dominican 3% Salvadoran 2%
- Common ancestry
- Scotch-Irish 5% Hispanic 5% Subsaharan African 3%
- Foreign-born
- 51% · Canada, Jamaica, Dominican Republic
- Languages at home
- 38% English-only · Spanish 36% Russian/Polish/Slavic 12% French/Haitian/Cajun 7%
Political lean MEDSL · Broward
- 2024 margin
- D (+17.0) · D 58.0% · R 41.0%
- 2008→2024 swing
- -17.8pp toward R · 2008: 34.7pp · 2024: 17.0pp
- All cycles
- 2024: D+17.0 2020: D+29.8 2016: D+35.0 2012: D+34.9 2008: D+34.7
Not yet ingested
- Civics
- —
Market trends
- HPI YoY
- ▼ -299.13%
- Current HPI
- 329.9081
- Rent YoY
- ▲ 0.43%
- Metro
- Miami-Fort Lauderdale-Pompano Beach, FL
- State GDP YoY
- ▲ 3.28%
- F500 in state
- 36
Industry mix (Fortune 500 HQ in FL)
| Industry | F500 HQs | Revenue |
|---|---|---|
| Industrial Technology | 2 | $29B |
|
||
| Insurance | 2 | $17B |
|
||
| Retail | 1 | $60B |
|
||
| Technology Distribution | 1 | $58B |
|
||
| Homebuilding | 1 | $35B |
|
||
| Technology Manufacturing | 1 | $35B |
|
||
Price history
+327.2% since first listed16 events — show timeline
- 2026-01-10 Listed $267,000 MARMLS
- 2025-05-23 Listing Removed — MARMLS
- 2025-01-18 Listed $310,000 MARMLS
- 2025-01-03 Listing Removed — MARMLS
- 2023-11-07 Price Changed $320,000 MARMLS
- 2023-08-11 Rental Removed $2,400 MARMLS
- 2023-07-17 Price Changed $2,400 MARMLS
- 2023-06-18 Listed $340,000 MARMLS
- 2022-04-15 Relisted — MARMLS
- 2021-12-23 Listed $310,000 MARMLS
- 2019-09-30 Sold (Public Records) $140,000 Public Records
- 2019-09-18 Sold (MLS) $140,000 MARMLS
- 2019-08-17 Pending — MARMLS
- 2019-08-09 Price Changed $155,000 MARMLS
- 2019-05-19 Listed $170,000 MARMLS
- 1994-08-31 Sold (Public Records) $62,500 Public Records
Property tax history
+6.6%/yrLatest (2025): $6,228 · -4.3% YoY. Source: county tax records.
Cash-flow waterfall
monthlySold comps — $/sqft
last 12 mo · ≤1 miLoading sold comps…