 🏗️ New Construction
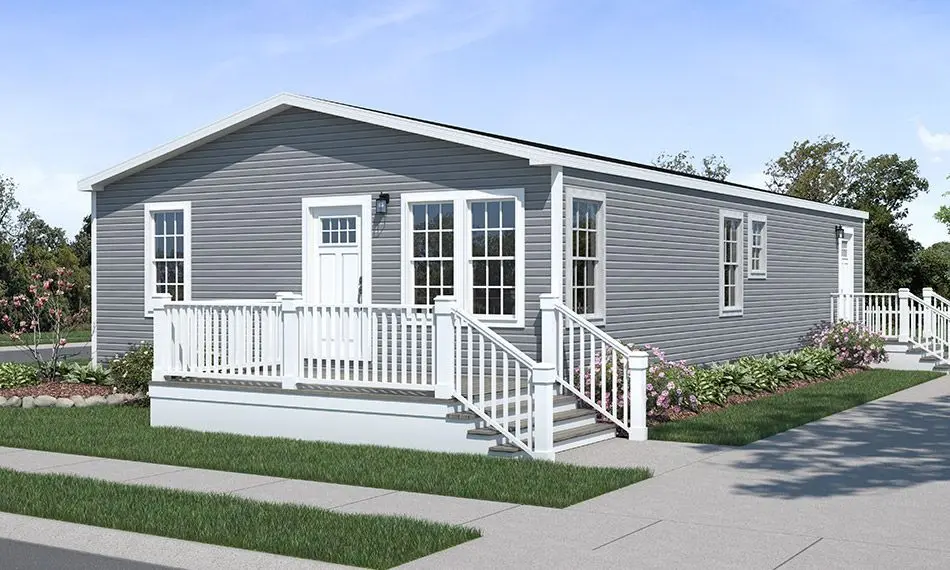
Carlyle Plan · East Avon, NY
Flood risk No data
- FEMA flood zone
- —
- Chance of flooding over 30 yrs
- —
- Est. flood insurance / yr
- —
Fire risk No data
- Est. fire insurance / yr
- —
Heat risk No data
- Hot days now (above threshold)
- —
- Hot days in 30 yrs
- —
Wind risk No data
- Chance of severe wind over 30 yrs
- —
Air-quality risk No data
- Unhealthy air days now
- —
- Unhealthy air days in 30 yrs
- —
Risk factors via First Street. Map © Google.
Why this score? — see what drove the B grade
The composite is a weighted blend of 9 inputs, each scored 0–100. Each bar is that input's sub-score; the figure is the points it added to the 100-point composite (weight × sub-score).
- Cash flow +30.0/30.0
- 1% rule +10.0/10.0
- DSCR +10.0/10.0
- ARV discount +7.5/15.0
- Schools +4.5/10.0
- Livability +3.0/5.0
- Condition / age +2.8/5.0
- Rent growth +2.5/5.0
- Appreciation +0.0/10.0
$124,900
🖨 Deal sheet 📄 Offer letter ✓ Due diligence
Key facts
- Listed 553 days
Neighborhood map
What this means for you Summary
Snapshot
- This is a 3-bed/2.0-bath manufactured listed at $125k. Condition is rated average.
Deal economics
- At list price, monthly cash flow is $958 ($11k/yr) — positive.
- The deal already cash-flows at list — no discount required.
- Meets the 1% rule at list price ($2k rent vs $125k).
- Recommended offer: $110k (12.0% below list) — sets the bar for market timing.
Location & tenants
- Location reads 60/100 on livability (#1,004 in NY) — a middle-class / working-renter tenant base. Strengths: housing A+, employment A-, cost of living B; Watch: schools F, crime F, amenities F.
- Avon Central School District (town): math 53% / reading 50% proficiency, ranked #349 of 590 in NY (top 59%) — acceptable for families but not a draw, mixed tenant base, ~2y average lease.
- Market conditions: 37 active listings in the ZIP; 86 units permitted in Livingston County in 2024 (0 in 5+ unit buildings).
Forward outlook
- Local home prices are declining (-3.0%/yr); year-one equity from $398 of loan paydown is wiped out by about $2k of value loss. Plan a longer hold.
- Livingston County population projected at -13% by 2050 — secular population decline; favor cash flow + early exit over multi-decade hold.
- At projected returns (-3.0% appreciation + 3.0% rent growth), your $16k cash investment doubles in ~2 years — after that, you're playing with house money.
Negotiation context
- It's been on market 553 days — a 12% lower offer ($110k) is reasonable based on typical stale-listing flexibility.
Questions for the listing agent
- It's been on market 553 days. Have you received any prior offers? Is the seller open to a 12% concession, seller financing, or rate buy-down credit?
- Why hasn't it sold? Are there any deal-killer items the seller is aware of (foundation, flood, title, zoning, code violations)?
- Is there a deadline driving the sale (1031 exchange, divorce, estate, relocation)? That informs how much negotiation room exists.
- Schools are F-rated, which usually means shorter tenancies and higher turnover. Who's the typical renter profile here, and what's been the actual vacancy rate?
- Crime grade is F in this area — have there been break-ins, vandalism, or insurance claims at this property in the last 3 years? What carrier currently insures it and at what premium?
- What's the average days-on-market for RENTAL listings here right now (not sales)? A rising rental-DOM trend means longer vacancies and softer asking-rent achievability than the comps imply.
- What's the recent tenant-quality profile in this submarket — average credit score on applications, eviction rate, late-payment / NSF rate, and stable-employment percentage? A property-management company in the area should have these aggregated.
- How much new for-sale + rental construction is in the pipeline within 1–3 miles? Heavy new supply typically softens prices + rents 12–24 months out; constrained supply supports both.
Investment metrics
- 1% rule
- 2.98% ✓
- Cap rate
- 26.27%
- Cash-on-cash
- 71.34%
- DSCR
- 4.17
- GRM
- 2.8
CMA / ARV
- ARV (median comp)
- $57,566
- List price
- $124,900
- Delta
- 116.97%
- Verdict
- OVERPRICED
- Comps
- 5 within 1.0 mi
Show comp detail 4 sales within ~0.75 mi
| Address | Dist | Beds/Ba | Sqft | Sold | Price | $/sf | Match |
|---|---|---|---|---|---|---|---|
| 36 Harper Parkway Pkwy | 0.27mi | 3/2.0 | 1,404 (+4%) | 15mo | $64,000 | $46 | 67 |
| 27 Hillside Dr | 0.22mi | 3/2.0 | 1,450 (+8%) | 17mo | $117,500 | $81 | 62 |
| 100 Hillside Dr | 0.49mi | 3/2.0 | 1,458 (+8%) | 8mo | $117,900 | $81 | 56 |
| 70 Parkview Dr | 0.44mi | 3/1.0 | 1,152 (-14%) | 7mo | $55,000 | $48 | 46 |
Match score weights: distance 35% · size 25% · config 20% · recency 20%. Top-matched comps best support the ARV.
Projected returns pro-forma
-3.0% appreciation · 3.0% rent growth · sell at horizon
- IRR
- 71.0%
- Equity multiple
- 4.21×
- Total profit
- $51,731
- Equity at exit
- $8,583
- IRR
- 74.9%
- Equity multiple
- 8.68×
- Total profit
- $123,742
- Equity at exit
- $4,977
Cash invested: $16,118 (down + closing). Projections, not guarantees.
Landlord ↔ Tenant lean methodology
- Overall (STATE)
- 15 Strongly Tenant-Friendly
- State New York
- 15 Strongly Tenant-Friendly · D+10
- County
- — inherits STATE
- City
- — inherits STATE
ZIP-level market 14414
- Home prices YoY
- -14.1%
- Active inventory
- 37
- Price-to-rent
- 6.1×
Monthly cashflow live
- Estimated rent
- $1,717 medium interval (Pro) →
- Mortgage (P&I)
- −$302
- Tax est. 1.5%
- −$72 /mo · $863/yr
- Insurance
- −$24
- HOA
- −$0
- Vacancy / Maint / Mgmt
- −$360
- Net cashflow
- $958
Break-even live
UW: 25.0% down · 7.5% · 30yr · 1.5% tax · 5.0% vac · 8.0% maint · 8.0% mgmt
Financing live
Cash to close
- Down payment
- $14,392
- Closing costs
- $1,727
- Reserves months
- —
- Total cash needed
- —
Loan-product check · same deal, 3 products live
Conventional
25% down · 7.5% · 30yr
- Down + closing
- —
- Monthly P&I
- —
- Monthly cashflow
- —
- DSCR
- —
- Eligible?
- —
Personal DTI + credit; lowest rate.
DSCR
20% down · 8.5% · 30yr
- Down + closing
- —
- Monthly P&I
- —
- Monthly cashflow
- —
- DSCR
- —
- Eligible?
- —
No personal income docs; deal must DSCR.
Hard money
10% down · 12.0% · 12mo
- Down + closing
- —
- Monthly P&I
- —
- Monthly cashflow
- —
- DSCR
- —
- Eligible?
- —
Short-term bridge; refi at stabilization.
Listing history 15 events
-
2026-06-18days on market $124,900 Active 553 DOM
-
2026-06-17days on market $124,900 Active 552 DOM
-
2026-06-16days on market $124,900 Active 551 DOM
-
2026-06-15days on market $124,900 Active 550 DOM
-
2026-06-13days on market $124,900 Active 548 DOM
-
2026-06-13days on market $124,900 Active 547 DOM
-
2026-06-10days on market $124,900 Active 545 DOM
-
2026-06-09days on market $124,900 Active 544 DOM
-
2026-06-08days on market $124,900 Active 543 DOM
-
2026-06-07days on market $124,900 Active 542 DOM
-
2026-06-03days on market $124,900 Active 538 DOM
-
2026-06-03days on market $124,900 Active 537 DOM
-
2026-06-01days on market $124,900 Active 536 DOM
-
2026-05-31days on market $124,900 Active 535 DOM
-
2024-12-13$124,900 Active
ⓘ Source: listings_history table (triggers on properties + properties_extension) + one-shot
backfill from property_details.listing_events for pre-trigger history.
Nearby sold comps map
Loading sold comps map…
Walkable amenities ~0.75 mi
Loading nearby amenities…
Taxation est. · year 1
- Rental income
- $20,599
- − Mortgage interest
- −$3,225
- − Property taxes
- −$863
- − Insurance
- −$288
- − Repairs & maintenance
- −$1,648
- − Management
- −$1,648
- − Depreciation
- −$1,675
- Taxable income
- $11,253
- Est. tax owed @ 24.0%
- −$2,701
- After-tax cash flow
- $8,799/yr
For passive investors: Depreciation is non-cash, so a rental often shows a tax loss while cash-flowing — sheltering income. Rental losses are passive: they offset passive income freely, and up to $25,000/yr can offset ordinary (W-2) income if you actively participate and your MAGI is under $100k (phasing out to $0 by $150k); unused losses carry forward. On sale, claimed depreciation is recaptured at up to 25%, and gains may owe capital-gains tax (a 1031 exchange can defer both). Figures are a year-1 estimate at your 24.0% rate — not tax advice; consult a CPA.
Condition & rehab AI · 3 photos
The home is in good condition with a cosmetic rehab level, requiring minor exterior painting and window maintenance to enhance its curb appeal and value.
Value-add opportunities
- Both Paint the exterior — Painting the exterior can improve curb appeal and increase both resale and rental value.
- Both Clean and maintain the windows — Clean windows can make the home appear more attractive and increase its value for both resale and rental.
Renovation cost estimate screening
Value-add ROI direction
- Both Paint the exterior — Painting the exterior can improve curb appeal and increase both resale and rental value. ↑
- Both Clean and maintain the windows — Clean windows can make the home appear more attractive and increase its value for both resale and rental. ↑
ⓘ Cost ranges are severity-bucket heuristics (US national rule-of-thumb). Get contractor quotes + a written scope before underwriting a rehab budget.
Schools (NCES district)
- District
- Avon Central School District
- NCES district ID
- 3603660
- Math proficiency
- 53% ▬ 0.00%
- Reading proficiency
- 50% ▲ 12.00%
- Median HH income
- $55,407
- Composite
- 44.56/100
- National rank
- #2786
- State rank
- #349 of 590 in NY
Livability — East Avon
- Score
- 60/100
- State rank
- #1004
- US rank
- #19541
Category grades
Schools grade is shown separately in the Schools card above.
Census & demographics
- County
- Livingston County · 6,576 people
- Metro
- Rochester, NY
- Population (ZIP)
- 6,576
- Household income
- $72,006
- Rent vs Own
- Severe rent burden
- 100.0
Population outlook (Livingston County) Hauer SSP2
- Today (2025)
- 63,466 people
- By 2030
- 61,966 · -2.4%
- By 2040
- 58,398 · -8.0%
- By 2050
- 54,955 · -13.4%
- By 2075
- 49,958 · -21.3%
- By 2100
- 43,944 · -30.8%
Race, ethnicity, and origin ACS 2023
- Neighborhood character
- Predominantly White (92%)
- Race & ethnicity
- White 92% Two or more races 4% Hispanic / Latino 2% Black 1%
- Common ancestry
- Romanian 6% Italian 4% Lithuanian 2%
- Foreign-born
- 2% · China, Canada
- Languages at home
- 98% English-only · Spanish 1%
Political lean MEDSL · Livingston
- 2024 margin
- Strong R (+21.4) · D 39.3% · R 60.7%
- 2008→2024 swing
- -13.6pp toward R · 2008: -7.9pp · 2024: -21.4pp
- All cycles
- 2024: R+21.4 2020: R+18.2 2016: R+27.8 2012: R+9.4 2008: R+7.9
Not yet ingested
- Civics
- —
Market trends
- HPI YoY
- ▼ -40.57%
- Current HPI
- 247.7027
- Rent YoY
- —
- Metro
- Rochester, NY
- State GDP YoY
- ▲ 2.60%
- F500 in state
- 92
Industry mix (Fortune 500 HQ in NY)
| Industry | F500 HQs | Revenue |
|---|---|---|
| Financial Services | 10 | $950B |
|
||
| Consumer Goods | 9 | $162B |
|
||
| Insurance | 4 | $225B |
|
||
| Telecommunications | 2 | $144B |
|
||
| Pharmaceuticals | 2 | $112B |
|
||
| Media / Entertainment | 2 | $69B |
|
||
Price history
1 event — show timeline
- 2024-12-13 Listed $124,900 Zillow
Cash-flow waterfall
monthlySold comps — $/sqft
last 12 mo · ≤1 miLoading sold comps…