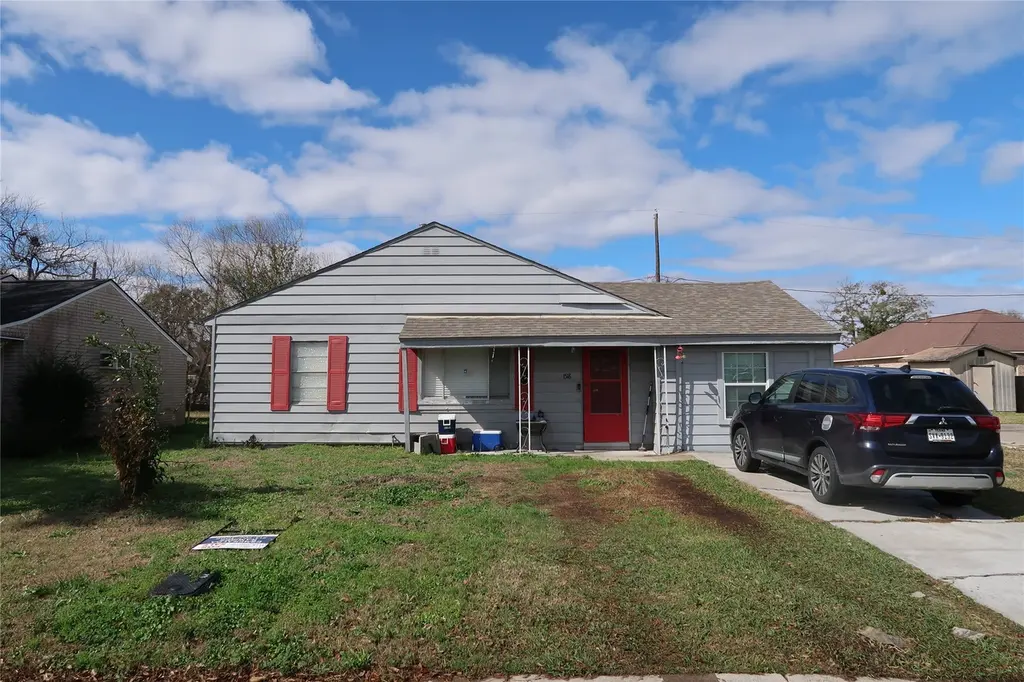
1518 Pleasantville Dr · Houston, TX
Flood risk 4/10 · Minor
- FEMA flood zone
- X (unshaded)
- Chance of flooding over 30 yrs
- 0.22%
- Est. flood insurance / yr
- $507 – $1,088
Fire risk 2/10 · Minimal
- Est. fire insurance / yr
- $1,222 – $2,270
Heat risk 9/10 · Severe
- Hot days now (above 110°F)
- 7 days/yr
- Hot days in 30 yrs
- 24 days/yr
Wind risk 9/10 · Severe
- Chance of severe wind over 30 yrs
- 99.0%
Air-quality risk 3/10 · Minor
- Unhealthy air days now
- 2 days/yr
- Unhealthy air days in 30 yrs
- 3 days/yr
Risk factors via First Street. Map © Google.
Why this score? — see what drove the C- grade
The composite is a weighted blend of 9 inputs, each scored 0–100. Each bar is that input's sub-score; the figure is the points it added to the 100-point composite (weight × sub-score).
- Cash flow +13.0/30.0
- ARV discount +10.0/15.0
- Appreciation +10.0/10.0
- 1% rule +5.0/10.0
- DSCR +3.9/10.0
- Livability +3.7/5.0
- Schools +2.7/10.0
- Rent growth +2.5/5.0
- Condition / age +2.5/5.0
$175,400
🖨 Deal sheet 📄 Offer letter ✓ Due diligence
Listing remarks MLS
Home is selling as is.
Key facts
- 5,832 sq ft lot
- Built 1950
- Listed 77 days
Neighborhood map
What this means for you Summary
Snapshot
- This is a 3-bed/2.0-bath single-family listed at $175k.
Deal economics
- At list price, monthly cash flow is $-11 ($-130/yr) — negative.
- To cash-flow at today's rent, offer at most $173k (1.1% below list).
- To meet the 1% rule (rent ≥ 1% of price), the offer needs to be $175k (0.4% below list).
- Recommended offer: $165k (6.0% below list) — sets the bar for market timing.
- Cap rate 6.2% vs local median 3.2% in Houston — top-decile yield for the area; either an underpriced asset or a hidden risk that comps aren't pricing in. Stress-test before assuming the spread holds.
Location & tenants
- Location reads 74/100 on livability (#184 in TX, #4,771 nationally) — a middle-class / working-renter tenant base. Strengths: amenities A+, cost of living A+, housing A+; Watch: schools D, crime F.
- Houston ISD (urban): math 27% / reading 35% proficiency, ranked #593 of 826 in TX (top 72%) — families likely to look elsewhere, expect single-tenant / working-renter base with shorter leases; 71% free/reduced lunch — lower-income household profile, screen leases tightly.
- Market conditions: 153 active listings in the ZIP; 8 comparable units currently listed for rent nearby; rentals lingering (median 44d on market — plan ~5-8 weeks vacancy on turnover, expect pricing pressure); 50% of comp listings sitting > 30 days — soft ceiling on asking rent; 29,883 units permitted in Harris County in 2024 (8,621 in 5+ unit buildings).
- This rent runs 43% of the median local income ($48k/yr) — at the standard rent-burdened threshold; future hikes will face affordability resistance.
Forward outlook
- In year one you build about $19k of equity ($1k loan paydown + $18k appreciation (10.0% local appreciation)).
- Harris County population projected at +47% by 2050 — long-run rental-demand tailwind backs the buy-and-hold thesis.
- At projected returns (10.0% appreciation + 3.0% rent growth), your $49k cash investment doubles in ~3 years — after that, you're playing with house money.
- By year 2, paydown + projected appreciation supports a ~$30k cash-out refi (75% LTV) — recoverable capital for the next deal without selling this one.
Negotiation context
- It's been on market 77 days — a 6% lower offer ($165k) is reasonable based on typical stale-listing flexibility.
- 3 sale attempts since 6y ago with the ask held roughly flat each time — persistent listings suggest the price (not the market) is what's stuck; bring a comps-based counter.
Risks & watch-outs
- Watch-outs: property tax is 2.7% of price; built in 1950 — expect roof / HVAC / electrical / plumbing capex.
- Climate carrying-cost: severe wind risk, 99% chance of damaging wind over 30y; extreme-heat days projected 7→24/yr by 2055 (HVAC capex compounding) — expect insurance premiums to compound above CPI over the hold.
Questions for the listing agent
- What do current leases actually rent for vs. the listed asking? Can we see a recent rent roll and the last 12 months of T-12 income?
- It's been on market 77 days. Have you received any prior offers? Is the seller open to a 6% concession, seller financing, or rate buy-down credit?
- Built in 1950 — when were the roof, HVAC, electrical panel, plumbing, and water heater last replaced?
- Property tax is high relative to price — has the assessment been appealed recently, and will the sale trigger a re-assessment?
- Why hasn't it sold? Are there any deal-killer items the seller is aware of (foundation, flood, title, zoning, code violations)?
- Is there a deadline driving the sale (1031 exchange, divorce, estate, relocation)? That informs how much negotiation room exists.
- Schools are D-rated, which usually means shorter tenancies and higher turnover. Who's the typical renter profile here, and what's been the actual vacancy rate?
- Crime grade is F in this area — have there been break-ins, vandalism, or insurance claims at this property in the last 3 years? What carrier currently insures it and at what premium?
- What's the average days-on-market for RENTAL listings here right now (not sales)? A rising rental-DOM trend means longer vacancies and softer asking-rent achievability than the comps imply.
- What's the recent tenant-quality profile in this submarket — average credit score on applications, eviction rate, late-payment / NSF rate, and stable-employment percentage? A property-management company in the area should have these aggregated.
- How much new for-sale + rental construction is in the pipeline within 1–3 miles? Heavy new supply typically softens prices + rents 12–24 months out; constrained supply supports both.
Investment metrics
- 1% rule
- 1.00% ✗
- Cap rate
- 6.22%
- Cash-on-cash
- -0.26%
- DSCR
- 0.99
- GRM
- 8.4
CMA / ARV
- ARV (median comp)
- $185,764
- List price
- $175,400
- Delta
- -5.58%
- Verdict
- FAIR
- Comps
- 20 within 1.0 mi
Show comp detail 12 sales within ~0.75 mi
| Address | Dist | Beds/Ba | Sqft | Sold | Price | $/sf | Match |
|---|---|---|---|---|---|---|---|
| 8446 Norvic St | 0.08mi | 4/2.0 (+1) | 1,289 (-7%) | 4mo | $164,580 | $128 | 76 |
| 1427 Teanaway Ln | 0.09mi | 3/2.0 | 1,232 (-11%) | 11mo | $239,750 | $195 | 68 |
| 8606 Guinevere St | 0.35mi | 3/1.5 | 1,238 (-11%) | 2mo | $225,000 | $182 | 62 |
| 8427 Guinevere St | 0.28mi | 4/2.0 (+1) | 1,228 (-12%) | 1mo | $225,000 | $183 | 62 |
| 8522 Northton St | 0.59mi | 4/1.0 (+1) | 1,398 (+1%) | 3mo | $174,999 | $125 | 60 |
| 8707 Fannette St | 0.46mi | 4/2.0 (+1) | 1,300 (-6%) | 6mo | $199,999 | $154 | 58 |
| 8726 Tilgham St | 0.46mi | 4/2.0 (+1) | 1,456 (+5%) | 11mo | $189,990 | $130 | 56 |
| 8766 Flossie Mae St | 0.58mi | 3/1.0 | 1,412 (+2%) | 12mo | $194,750 | $138 | 56 |
| 8527 Bucroft St | 0.46mi | 4/2.0 (+1) | 1,504 (+8%) | 7mo | $189,900 | $126 | 54 |
| 8647 Berndale St | 0.38mi | 4/2.0 (+1) | 1,252 (-10%) | 11mo | $199,999 | $160 | 52 |
| 8711 Othello St | 0.45mi | 3/2.0 | 1,180 (-15%) | 8mo | $215,000 | $182 | 47 |
| 8743 Pattibob St | 0.49mi | 3/2.0 | 1,576 (+14%) | 12mo | $208,000 | $132 | 45 |
Match score weights: distance 35% · size 25% · config 20% · recency 20%. Top-matched comps best support the ARV.
Projected returns pro-forma
10.0% appreciation · 3.0% rent growth · sell at horizon
- IRR
- 24.1%
- Equity multiple
- 2.93×
- Total profit
- $94,976
- Equity at exit
- $158,014
- IRR
- 21.4%
- Equity multiple
- 6.71×
- Total profit
- $280,499
- Equity at exit
- $340,764
Cash invested: $49,112 (down + closing). Projections, not guarantees.
Landlord ↔ Tenant lean methodology
- Overall (STATE)
- 87 Strongly Landlord-Friendly
- State Texas
- 87 Strongly Landlord-Friendly · R+5
- County
- — inherits STATE
- City
- — inherits STATE
ZIP-level market 77029
- Home prices YoY
- 7.2%
- Active inventory
- 153
- Price-to-rent
- 8.4×
Monthly cashflow live
- Estimated rent
- $1,747 high interval (Pro) →
- Mortgage (P&I)
- −$920
- Tax from tax record
- −$398 /mo · $4,772/yr
- Insurance
- −$73
- HOA
- −$0
- Vacancy / Maint / Mgmt
- −$367
- Net cashflow
- $-11
Break-even live
UW: 25.0% down · 7.5% · 30yr · 1.5% tax · 5.0% vac · 8.0% maint · 8.0% mgmt
Financing live
Cash to close
- Down payment
- $43,850
- Closing costs
- $5,262
- Reserves months
- —
- Total cash needed
- —
Loan-product check · same deal, 3 products live
Conventional
25% down · 7.5% · 30yr
- Down + closing
- —
- Monthly P&I
- —
- Monthly cashflow
- —
- DSCR
- —
- Eligible?
- —
Personal DTI + credit; lowest rate.
DSCR
20% down · 8.5% · 30yr
- Down + closing
- —
- Monthly P&I
- —
- Monthly cashflow
- —
- DSCR
- —
- Eligible?
- —
No personal income docs; deal must DSCR.
Hard money
10% down · 12.0% · 12mo
- Down + closing
- —
- Monthly P&I
- —
- Monthly cashflow
- —
- DSCR
- —
- Eligible?
- —
Short-term bridge; refi at stabilization.
Rent comps 8 comps
| Address | Beds | Baths | Sqft | Rent | $/sqft | DOM | Units | Dist |
|---|---|---|---|---|---|---|---|---|
| 1629 Demaree Ln Houston, TX | 4.0 | 2.0 | 1520 | $2,225 | $1.46 | 24d | 1 | 0.19mi |
| 8534 Fillmore St Houston, TX | 3.0 | 1.0 | 965 | $1,600 | $1.66 | 43d | 1 | 0.40mi |
| 8726 Josie St Houston, TX | 3.0 | 1.0 | 950 | $1,000 | $1.05 | 43d | 1 | 0.45mi |
| 8735 Cowart St Houston, TX | 3.0 | 1.0 | 1136 | $1,000 | $0.88 | 43d | 1 | 0.46mi |
| 2203 Pearl St Houston, TX | 3.0 | 2.0 | 1298 | $1,570 | $1.21 | 13d | 1 | 0.77mi |
| 9701 Market St Houston, TX | 1.0–2.0 | 1.0 | 798 | $1,309 | $1.64 | 7d | 1 | 1.20mi |
| 9709 Cargill St Houston, TX | 3.0 | 2.0 | 1184 | $2,300 | $1.94 | 43d | 1 | 1.20mi |
| 9710 Tuffly St Houston, TX | 3.0 | 2.0 | 1275 | $1,795 | $1.41 | 24d | 1 | 1.30mi |
Listing history 21 events
-
2026-06-18days on market $175,400 Active 77 DOM
-
2026-06-17days on market $175,400 Active 76 DOM
-
2026-06-16days on market $175,400 Active 75 DOM
-
2026-06-15days on market $175,400 Active 74 DOM
-
2026-06-13days on market $175,400 Active 72 DOM
-
2026-06-10days on market $175,400 Active 68 DOM
-
2026-06-08days on market $175,400 Active 67 DOM
-
2026-06-07days on market $175,400 Active 66 DOM
-
2026-06-04days on market $175,400 Active 63 DOM
-
2026-06-01days on market $175,400 Active 60 DOM
-
2026-05-31days on market $175,400 Active 59 DOM
-
2026-05-07status Active 22-char remark
Show marketing remark (22 chars)
Home is selling as is.
-
2026-04-03status Pending 22-char remark
Show marketing remark (22 chars)
Home is selling as is.
-
2026-02-27$175,400 Active 22-char remark
Show marketing remark (22 chars)
Home is selling as is.
-
2020-06-23soldstatus
-
2020-05-14soldstatus Sold 439-char remark
Show marketing remark (439 chars)
BEAUTIFUL 4 beds 2 baths, fully fenced, new 30 years roof, tile floor, laminated flooring in bedroom, beautiful large kitchen with lots of cabinet space, new gas stove, dishwasher, microwave, new water heater, remodeled bath, new sinks, ceiling fans, new fixture, new blinds, new interior and exterior paints. new fence, central air and heating system, Foundation has life time warranty. complete renovated a must see. Call me for details.
-
2020-04-04status Pending 439-char remark
Show marketing remark (439 chars)
BEAUTIFUL 4 beds 2 baths, fully fenced, new 30 years roof, tile floor, laminated flooring in bedroom, beautiful large kitchen with lots of cabinet space, new gas stove, dishwasher, microwave, new water heater, remodeled bath, new sinks, ceiling fans, new fixture, new blinds, new interior and exterior paints. new fence, central air and heating system, Foundation has life time warranty. complete renovated a must see. Call me for details.
-
2020-02-10$152,000 Active 439-char remark
Show marketing remark (439 chars)
BEAUTIFUL 4 beds 2 baths, fully fenced, new 30 years roof, tile floor, laminated flooring in bedroom, beautiful large kitchen with lots of cabinet space, new gas stove, dishwasher, microwave, new water heater, remodeled bath, new sinks, ceiling fans, new fixture, new blinds, new interior and exterior paints. new fence, central air and heating system, Foundation has life time warranty. complete renovated a must see. Call me for details.
-
2019-12-05soldstatus
-
2019-11-01soldstatus
-
1988-01-02soldstatus
ⓘ Source: listings_history table (triggers on properties + properties_extension) + one-shot
backfill from property_details.listing_events for pre-trigger history.
Tax reassessment forecast TX · Resets to sale price
- Current annual tax
- $4,772 · $398/mo
- Projected year-2 tax
- $4,772 · $398/mo
- Expected delta
- $0/yr ($0/mo · 0.0%)
ⓘ Screening estimate from a state-policy table — verify with the county assessor before closing.
Climate risk First Street
- Flood 4/10 Moderate FEMA zone X (unshaded) · 22% chance over 30 yrs
- Wildfire 2/10 Low
- Heat 9/10 Extreme 7 d/yr ≥110°F today · 24 d/yr by 30 yrs out
- Wind 9/10 Extreme 99% chance of damaging wind over 30 yrs
- Air quality 3/10 Moderate 2 unhealthy d/yr today · 3 by 30 yrs out
Nearby sold comps map
Loading sold comps map…
Walkable amenities ~0.75 mi
Loading nearby amenities…
Taxation est. · year 1
- Rental income
- $20,959
- − Mortgage interest
- −$9,825
- − Property taxes
- −$4,772
- − Insurance
- −$877
- − Repairs & maintenance
- −$1,677
- − Management
- −$1,677
- − Depreciation
- −$5,103
- Taxable loss
- −$2,972
- Est. tax savings @ 24.0%
- +$713
- After-tax cash flow
- $584/yr
For passive investors: Depreciation is non-cash, so a rental often shows a tax loss while cash-flowing — sheltering income. Rental losses are passive: they offset passive income freely, and up to $25,000/yr can offset ordinary (W-2) income if you actively participate and your MAGI is under $100k (phasing out to $0 by $150k); unused losses carry forward. On sale, claimed depreciation is recaptured at up to 25%, and gains may owe capital-gains tax (a 1031 exchange can defer both). Figures are a year-1 estimate at your 24.0% rate — not tax advice; consult a CPA.
Schools (NCES district)
- District
- Houston ISD
- NCES district ID
- 4823640
- Math proficiency
- 27% ▼ -18.00%
- Reading proficiency
- 35% ▼ -6.00%
- Median HH income
- $46,054
- Composite
- 26.63/100
- National rank
- #7173
- State rank
- #593 of 826 in TX
Livability — Houston
- Score
- 74/100
- State rank
- #184
- US rank
- #4771
Category grades
Schools grade is shown separately in the Schools card above.
Census & demographics
- Census place
- Houston, TX
- County
- Harris County · 4,702,590 people
- City population
- 3,226,434
- Metro
- Houston-The Woodlands-Sugar Land, TX
- Population (ZIP)
- 16,154
- Household income
- $48,279
- Rent vs Own
- Severe rent burden
- 457.0
Population outlook (Harris County) Hauer SSP2
- Today (2025)
- 5,571,493 people
- By 2030
- 6,089,821 · +9.3%
- By 2040
- 7,142,806 · +28.2%
- By 2050
- 8,185,864 · +46.9%
- By 2075
- 10,574,329 · +89.8%
- By 2100
- 12,109,958 · +117.4%
Race, ethnicity, and origin ACS 2023
- Neighborhood character
- Predominantly Hispanic (72%)
- Race & ethnicity
- Hispanic / Latino 72% Two or more races 32% Black 22% White 5%
- Hispanic origin (detail)
- Mexican 66%
- Foreign-born
- 31% · Canada
- Languages at home
- 39% English-only · Spanish 61%
Political lean MEDSL · Harris
- 2024 margin
- Lean D (+5.5) · D 52.0% · R 46.4% · Other 1.6%
- 2008→2024 swing
- +3.9pp toward D · 2008: 1.6pp · 2024: 5.5pp
- All cycles
- 2024: D+5.5 2020: D+13.3 2016: D+12.4 2012: D+0.1 2008: D+1.6
Not yet ingested
- Civics
- —
Market trends
- HPI YoY
- ▲ 18.53%
- Current HPI
- 276.1811
- Rent YoY
- —
- Metro
- Houston-The Woodlands-Sugar Land, TX
- State GDP YoY
- ▲ 3.95%
- F500 in state
- 110
Industry mix (Fortune 500 HQ in TX)
| Industry | F500 HQs | Revenue |
|---|---|---|
| Energy | 16 | $1,198B |
|
||
| Technology | 5 | $198B |
|
||
| Engineering / Construction | 4 | $72B |
|
||
| Energy Services | 3 | $60B |
|
||
| Utilities | 3 | $41B |
|
||
| Healthcare | 2 | $330B |
|
||
Price history
+15.4% since first listed10 events — show timeline
- 2026-05-07 Relisted — HARMLS
- 2026-04-03 Pending — HARMLS
- 2026-02-27 Listed $175,400 HARMLS
- 2020-06-23 Sold (Public Records) — Public Records
- 2020-05-14 Sold (MLS) — HARMLS
- 2020-04-04 Pending — HARMLS
- 2020-02-10 Listed $152,000 HARMLS
- 2019-12-05 Sold (Public Records) — Public Records
- 2019-11-01 Sold (Public Records) — Public Records
- 1988-01-02 Sold (Public Records) — Public Records
Property tax history
+7.2%/yrLatest (2025): $4,772 · +5.9% YoY. Source: county tax records.
Cash-flow waterfall
monthlySold comps — $/sqft
last 12 mo · ≤1 miLoading sold comps…