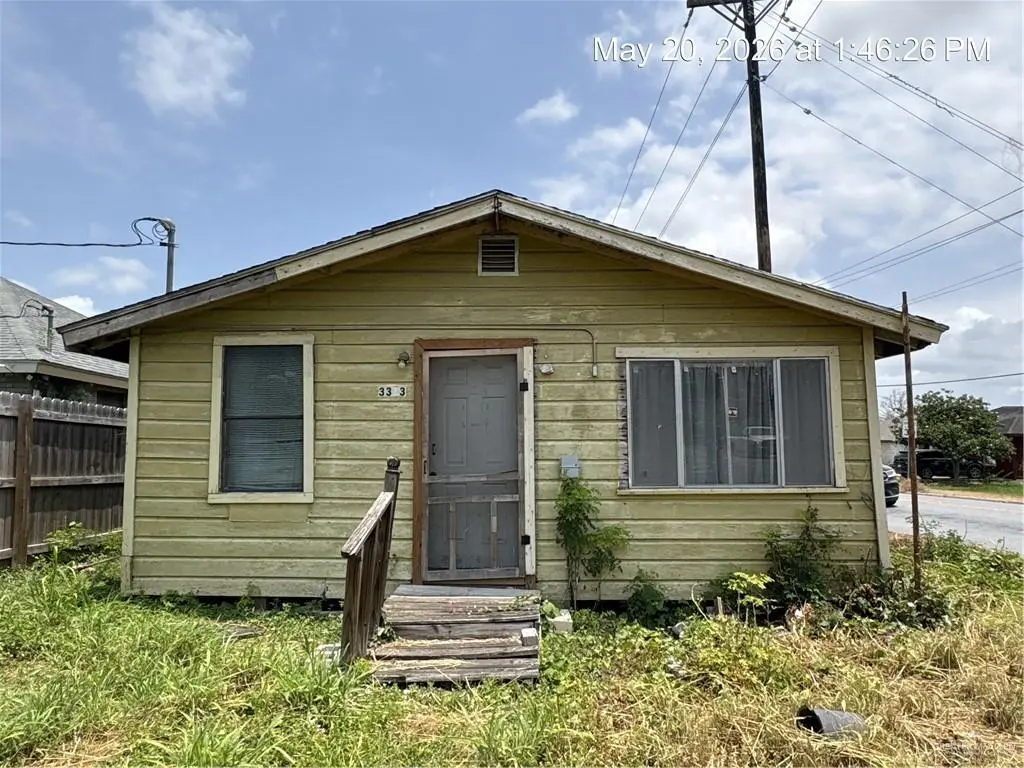
3313 S Mccoll Rd S · McAllen, TX
Flood risk 4/10 · Minor
- FEMA flood zone
- X (shaded)
- Chance of flooding over 30 yrs
- 0.24%
- Est. flood insurance / yr
- $507 – $1,088
Fire risk 6/10 · Moderate
- Est. fire insurance / yr
- $1,222 – $2,270
Heat risk 9/10 · Severe
- Hot days now (above 111°F)
- 7 days/yr
- Hot days in 30 yrs
- 22 days/yr
Wind risk 8/10 · Major
- Chance of severe wind over 30 yrs
- 99.0%
Air-quality risk 3/10 · Minor
- Unhealthy air days now
- 1 days/yr
- Unhealthy air days in 30 yrs
- 4 days/yr
Risk factors via First Street. Map © Google.
Why this score? — see what drove the D grade
The composite is a weighted blend of 9 inputs, each scored 0–100. Each bar is that input's sub-score; the figure is the points it added to the 100-point composite (weight × sub-score).
- Cash flow +15.0/30.0
- ARV discount +7.5/15.0
- 1% rule +5.0/10.0
- DSCR +5.0/10.0
- Livability +3.8/5.0
- Condition / age +2.5/5.0
- Schools +2.0/10.0
- Rent growth +1.4/5.0
- Appreciation +0.4/10.0
$19,500
🖨 Deal sheet 📄 Offer letter ✓ Due diligence
Listing remarks MLS
Great Investment opportunity. Prime location, nearby Expressway. Property is Sold AS IS-home needs repairs, includes shed in the back, offers potential for the right buyer. Plenty of outdoor space for expansion.
Key facts
- 8,712 sq ft lot
- Built 1982
- Listed 6 days
Property features AI
Finance
- Other: Located at northeast corner near S. McColl Road and El Rancho Road (directions provided)
- HOA & community: No homeowners association
Exterior
- Parking: No garage or carport
- Utilities: Sewer: Other
- Home design: Not new construction
- Construction: Wood siding; Pillar/post/pier foundation; Building area listed as 616 square feet
- Exterior features: Shingle roof; Lot approximately 0.2 acres (8,712 sq ft)
Interior
- Kitchen: Water heater (other) — no conveying appliances
- Flooring: Laminate flooring
- Bathrooms: 1 full bathroom
- Interior features: Laminate countertops; Ceiling fan(s); Partial window coverings
Neighborhood map
What this means for you Summary
Snapshot
- This is a 1-bed/1.0-bath single-family listed at $20k.
Deal economics
- At list price, monthly cash flow is $648 ($8k/yr) — positive.
- The deal already cash-flows at list — no discount required.
- Meets the 1% rule at list price ($991 rent vs $20k).
- Cap rate 46.2% vs local median 3.7% in McAllen — top-decile yield for the area; either an underpriced asset or a hidden risk that comps aren't pricing in. Stress-test before assuming the spread holds.
Location & tenants
- Location reads 76/100 on livability (#119 in TX, #3,771 nationally) — a middle-class / working-renter tenant base. Strengths: cost of living A+, housing A+, health & safety A+; Watch: employment D, amenities F, commute F.
- Pharr-San Juan-Alamo ISD (suburban): math 18% / reading 30% proficiency, ranked #740 of 826 in TX (top 90%) — low school quality limits family demand, transient renter base, plan for 1-2y turnover; 72% free/reduced lunch — lower-income household profile, screen leases tightly.
- Zoned schools: Geraldine Palmer El (math 17% / reading 32%, grade F, #3,052 of 4,322 statewide, top 74%, 644 students, 88% FRL); Kennedy Middle (math 22% / reading 27%, grade F, #1,279 of 1,662 statewide, top 78%, 580 students, 94% FRL); Psja Southwest Early College H S (math 18% / reading 37%, grade F, #1,183 of 1,632 statewide, top 73%, 1,692 students, 98% FRL) — zoned schools average 93% FRL vs 72% district-wide (22 pts higher); higher-poverty schools than district average — tighter screening recommended.
- Market conditions: Rents falling (-4.2%/yr); 215 active listings in the ZIP; 2 comparable units currently listed for rent nearby; 7,378 units permitted in Hidalgo County in 2024 (641 in 5+ unit buildings).
Forward outlook
- Local home prices are declining (-3.0%/yr); year-one equity from $135 of loan paydown is wiped out by about $585 of value loss. Plan a longer hold.
- Hidalgo County population projected at +28% by 2050 — long-run rental-demand tailwind backs the buy-and-hold thesis.
- At projected returns (-3.0% appreciation + 0.0% rent growth), your $5k cash investment doubles in ~1 year — after that, you're playing with house money.
Negotiation context
- Only 6 days on market — expect competitive offers; lowballing is unlikely to land.
- 2 sale attempts with the ask held roughly flat each time — persistent listings suggest the price (not the market) is what's stuck; bring a comps-based counter.
Risks & watch-outs
- Climate carrying-cost: severe wind risk, 99% chance of damaging wind over 30y; major wildfire risk; extreme-heat days projected 7→22/yr by 2055 (HVAC capex compounding) — expect insurance premiums to compound above CPI over the hold.
Questions for the listing agent
- Is there a deadline driving the sale (1031 exchange, divorce, estate, relocation)? That informs how much negotiation room exists.
- Schools are B-rated — typically a magnet for longer-tenancy family renters. What's the average tenant stay here, and is there a school-zone premium baked into asking?
- The area grade is low — what's the realistic commute time and amenity access for the typical tenant pool here? Any planned neighborhood developments (good or bad) we should know about?
- What's the average days-on-market for RENTAL listings here right now (not sales)? A rising rental-DOM trend means longer vacancies and softer asking-rent achievability than the comps imply.
- What's the recent tenant-quality profile in this submarket — average credit score on applications, eviction rate, late-payment / NSF rate, and stable-employment percentage? A property-management company in the area should have these aggregated.
- How much new for-sale + rental construction is in the pipeline within 1–3 miles? Heavy new supply typically softens prices + rents 12–24 months out; constrained supply supports both.
Investment metrics
- 1% rule
- 5.08% ✓
- Cap rate
- 46.19%
- Cash-on-cash
- 142.48%
- DSCR
- 7.34
- GRM
- 1.6
CMA / ARV
- ARV (on-the-fly)
- $125,048
- Comps found
- 2
Show comp detail 2 sales within ~0.75 mi
| Address | Dist | Beds/Ba | Sqft | Sold | Price | $/sf | Match |
|---|---|---|---|---|---|---|---|
| 3313 S Mccoll Rd | 0.00mi | 2/1.0 (+1) | 616 (0%) | 10mo | $125,000 | $203 | 87 |
| 804 E Pineridge Ave | 0.14mi | 2/1.0 (+1) | 680 (+10%) | 12mo | $90,000 | $132 | 62 |
Match score weights: distance 35% · size 25% · config 20% · recency 20%. Top-matched comps best support the ARV.
Projected returns pro-forma
-3.0% appreciation · 0.0% rent growth · sell at horizon
- IRR
- —
- Equity multiple
- 7.45×
- Total profit
- $35,241
- Equity at exit
- $2,908
- IRR
- —
- Equity multiple
- 14.31×
- Total profit
- $72,689
- Equity at exit
- $1,686
Cash invested: $5,460 (down + closing). Projections, not guarantees.
Landlord ↔ Tenant lean methodology
- Overall (STATE)
- 87 Strongly Landlord-Friendly
- State Texas
- 87 Strongly Landlord-Friendly · R+5
- County
- — inherits STATE
- City
- — inherits STATE
ZIP-level market 78503
- Home prices YoY
- -4.2%
- Rents YoY
- -4.2%
- Active inventory
- 215
- Price-to-rent
- 1.6×
Monthly cashflow live
- Estimated rent
- $991 medium interval (Pro) →
- Mortgage (P&I)
- −$102
- Tax est. 1.5%
- −$24 /mo · $292/yr
- Insurance
- −$8
- HOA
- −$0
- Vacancy / Maint / Mgmt
- −$208
- Net cashflow
- $648
Break-even live
UW: 25.0% down · 7.5% · 30yr · 1.5% tax · 5.0% vac · 8.0% maint · 8.0% mgmt
Financing live
Cash to close
- Down payment
- $4,875
- Closing costs
- $585
- Reserves months
- —
- Total cash needed
- —
Loan-product check · same deal, 3 products live
Conventional
25% down · 7.5% · 30yr
- Down + closing
- —
- Monthly P&I
- —
- Monthly cashflow
- —
- DSCR
- —
- Eligible?
- —
Personal DTI + credit; lowest rate.
DSCR
20% down · 8.5% · 30yr
- Down + closing
- —
- Monthly P&I
- —
- Monthly cashflow
- —
- DSCR
- —
- Eligible?
- —
No personal income docs; deal must DSCR.
Hard money
10% down · 12.0% · 12mo
- Down + closing
- —
- Monthly P&I
- —
- Monthly cashflow
- —
- DSCR
- —
- Eligible?
- —
Short-term bridge; refi at stabilization.
Rent comps 2 comps
| Address | Beds | Baths | Sqft | Rent | $/sqft | DOM | Units | Dist |
|---|---|---|---|---|---|---|---|---|
| 901 E Yuma Ave McAllen, TX | 1.0–2.0 | 1.0–2.0 | 900 | $900 | $1.00 | 43d | 5 | 0.58mi |
| 901 E Yuma Ave McAllen, TX | 1.0–2.0 | 1.0–2.0 | 900 | $900 | $1.00 | 14d | 3 | 0.58mi |
Listing history 7 events
-
2026-06-18days on market $19,500 Active 6 DOM
-
2026-06-17days on market $19,500 Active 5 DOM
-
2026-06-16days on market $19,500 Active 4 DOM
-
2026-06-15remarks 83-char remark
-
2026-06-15days on market $19,500 Active 3 DOM
-
2026-06-13remarks 64-char remark
-
2026-06-13$19,500 Active 1 DOM
ⓘ Source: listings_history table (triggers on properties + properties_extension) + one-shot
backfill from property_details.listing_events for pre-trigger history.
Climate risk First Street
- Flood 4/10 Moderate FEMA zone X (shaded) · 24% chance over 30 yrs
- Wildfire 6/10 Major
- Heat 9/10 Extreme 7 d/yr ≥111°F today · 22 d/yr by 30 yrs out
- Wind 8/10 Severe 99% chance of damaging wind over 30 yrs
- Air quality 3/10 Moderate 1 unhealthy d/yr today · 4 by 30 yrs out
Nearby sold comps map
Loading sold comps map…
Walkable amenities ~0.75 mi
Loading nearby amenities…
Taxation est. · year 1
- Rental income
- $11,895
- − Mortgage interest
- −$1,092
- − Property taxes
- −$292
- − Insurance
- −$98
- − Repairs & maintenance
- −$952
- − Management
- −$952
- − Depreciation
- −$567
- Taxable income
- $7,942
- Est. tax owed @ 24.0%
- −$1,906
- After-tax cash flow
- $5,874/yr
For passive investors: Depreciation is non-cash, so a rental often shows a tax loss while cash-flowing — sheltering income. Rental losses are passive: they offset passive income freely, and up to $25,000/yr can offset ordinary (W-2) income if you actively participate and your MAGI is under $100k (phasing out to $0 by $150k); unused losses carry forward. On sale, claimed depreciation is recaptured at up to 25%, and gains may owe capital-gains tax (a 1031 exchange can defer both). Figures are a year-1 estimate at your 24.0% rate — not tax advice; consult a CPA.
Schools (NCES district)
- District
- Pharr-San Juan-Alamo ISD
- NCES district ID
- 4834860
- Math proficiency
- 18% ▼ -34.00%
- Reading proficiency
- 30% ▼ -11.00%
- Median HH income
- $33,757
- Composite
- 19.63/100
- National rank
- #8744
- State rank
- #740 of 826 in TX
Livability — McAllen
- Score
- 76/100
- State rank
- #119
- US rank
- #3771
Category grades
Schools grade is shown separately in the Schools card above.
Census & demographics
- Census place
- McAllen, TX
- County
- Hidalgo County · 623,128 people
- City population
- 144,650
- Metro
- McAllen-Edinburg-Mission, TX
- Population (ZIP)
- 22,621
- Household income
- $53,322
- Rent vs Own
- Severe rent burden
- 762.0
Population outlook (Hidalgo County) Hauer SSP2
- Today (2025)
- 955,232 people
- By 2030
- 1,009,774 · +5.7%
- By 2040
- 1,120,332 · +17.3%
- By 2050
- 1,225,036 · +28.2%
- By 2075
- 1,439,189 · +50.7%
- By 2100
- 1,533,429 · +60.5%
Race, ethnicity, and origin ACS 2023
- Neighborhood character
- Predominantly Hispanic (92%)
- Race & ethnicity
- Hispanic / Latino 92% Two or more races 34% White 3% Asian 1%
- Hispanic origin (detail)
- Mexican 88%
- Common ancestry
- Lithuanian 2%
- Foreign-born
- 29% · Canada
- Languages at home
- 13% English-only · Spanish 86%
Political lean MEDSL · Hidalgo
- 2024 margin
- Toss-up / Even · D 48.1% · R 51.0%
- 2008→2024 swing
- -41.6pp toward R · 2008: 38.7pp · 2024: -2.9pp
- All cycles
- 2024: R+2.9 2020: D+17.1 2016: D+40.5 2012: D+41.8 2008: D+38.7
Not yet ingested
- Civics
- —
Market trends
- HPI YoY
- ▼ -9.15%
- Current HPI
- 208.4757
- Rent YoY
- ▼ -4.21%
- Metro
- McAllen-Edinburg-Mission, TX
- State GDP YoY
- ▲ 3.95%
- F500 in state
- 110
Industry mix (Fortune 500 HQ in TX)
| Industry | F500 HQs | Revenue |
|---|---|---|
| Energy | 16 | $1,198B |
|
||
| Technology | 5 | $198B |
|
||
| Engineering / Construction | 4 | $72B |
|
||
| Energy Services | 3 | $60B |
|
||
| Utilities | 3 | $41B |
|
||
| Healthcare | 2 | $330B |
|
||
Price history
-84.4% since first listed5 events — show timeline
- 2026-06-12 Listed $19,500 MCALLENMLS
- 2025-08-22 Sold (Public Records) — Public Records
- 2025-08-22 Sold (MLS) — MCALLENMLS
- 2025-07-24 Pending — MCALLENMLS
- 2025-07-12 Listed $125,000 MCALLENMLS
Property tax history
+10.3%/yrLatest (2025): $2,274 · +122.4% YoY. Source: county tax records.
Cash-flow waterfall
monthlySold comps — $/sqft
last 12 mo · ≤1 miLoading sold comps…