3216 Capwood Curv · Montgomery, AL
Flood risk 1/10 · Minimal
- FEMA flood zone
- X (unshaded)
- Chance of flooding over 30 yrs
- 0.0%
- Est. flood insurance / yr
- $507 – $1,088
Fire risk 1/10 · Minimal
- Est. fire insurance / yr
- $916 – $1,700
Heat risk 7/10 · Major
- Hot days now (above 108°F)
- 7 days/yr
- Hot days in 30 yrs
- 20 days/yr
Wind risk 8/10 · Major
- Chance of severe wind over 30 yrs
- 80.0%
Air-quality risk 2/10 · Minimal
- Unhealthy air days now
- 1 days/yr
- Unhealthy air days in 30 yrs
- 3 days/yr
Risk factors via First Street. Map © Google.
Why this score? — see what drove the C grade
The composite is a weighted blend of 9 inputs, each scored 0–100. Each bar is that input's sub-score; the figure is the points it added to the 100-point composite (weight × sub-score).
- Cash flow +25.9/30.0
- DSCR +8.7/10.0
- 1% rule +6.3/10.0
- Rent growth +3.9/5.0
- ARV discount +3.3/15.0
- Livability +3.2/5.0
- Condition / age +2.5/5.0
- Schools +1.7/10.0
- Appreciation +0.0/10.0
$104,900
🖨 Deal sheet 📄 Offer letter ✓ Due diligence
Listing remarks MLS
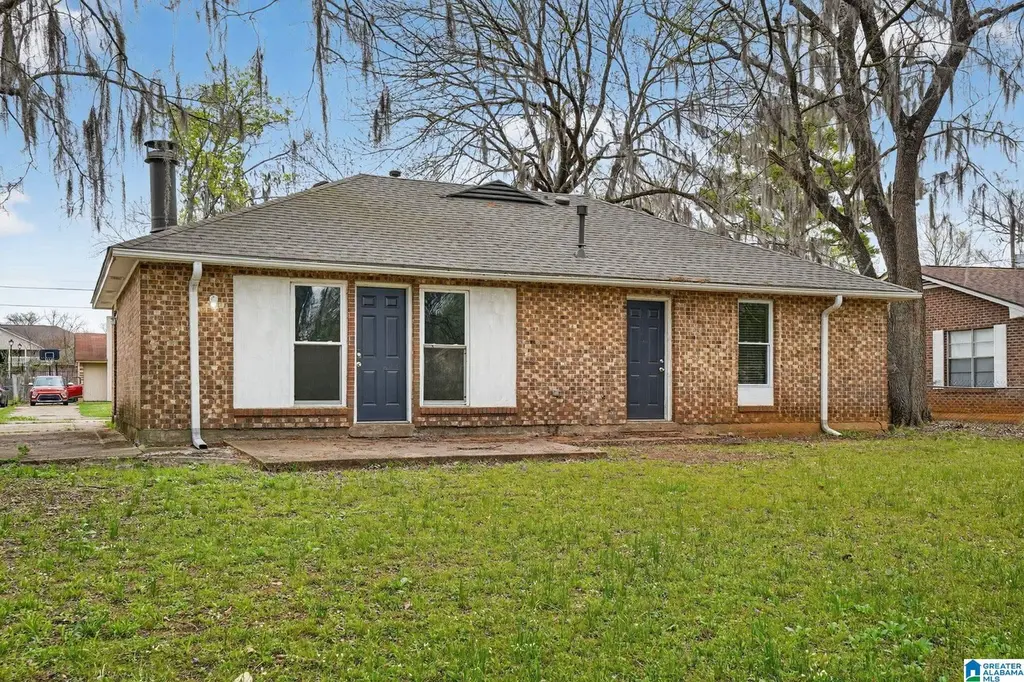
This 3-bedroom, 2-full bath brick home combines classic style with practical design on a generous 0.28-acre lot. A formal foyer entry opens to a living room featuring a focal-point stone fireplace and consistent hardwood flooring throughout the interior. The primary suite includes a private full bath and a spacious walk-in closet. For added convenience, a dedicated 3x5 laundry room is positioned directly off the kitchen. The exterior is framed by mature trees and a paved drive, providing character and shade. Located just minutes from Montgomery’s shopping and dining, this property represents a solid opportunity for anyone seeking a move-in-ready home with timeless features.
Key facts
- Hardwood flooring
- Walk-in closet
- Brick home
Tags
Neighborhood map
What this means for you Summary
Snapshot
- This is a 3-bed/2.0-bath single-family listed at $105k.
Deal economics
- At list price, monthly cash flow is $259 ($3k/yr) — positive.
- The deal already cash-flows at list — no discount required.
- Meets the 1% rule at list price ($1k rent vs $105k).
- Recommended offer: $95k (9.0% below list) — sets the bar for market timing.
- Cap rate 9.3% vs local median 6.0% in Montgomery — top-decile yield for the area; either an underpriced asset or a hidden risk that comps aren't pricing in. Stress-test before assuming the spread holds.
Location & tenants
- Location reads 65/100 on livability (#138 in AL) — a middle-class / working-renter tenant base. Strengths: cost of living A+, housing A+; Watch: schools C-, employment D, crime F.
- Montgomery County (urban): math 9% / reading 31% proficiency, ranked #106 of 129 in AL (top 82%) — low school quality limits family demand, transient renter base, plan for 1-2y turnover; 70% free/reduced lunch — lower-income household profile, screen leases tightly.
- Market conditions: Rents rising fast (+5.7%/yr); 293 active listings in the ZIP; 28 comparable units currently listed for rent nearby; rentals lingering (median 44d on market — plan ~5-8 weeks vacancy on turnover, expect pricing pressure); 64% of comp listings sitting > 30 days — soft ceiling on asking rent; 460 units permitted in Montgomery County in 2024 (37 in 5+ unit buildings).
Forward outlook
- Local home prices are declining (-3.0%/yr); year-one equity from $725 of loan paydown is wiped out by about $3k of value loss. Plan a longer hold.
- Montgomery County population projected to shrink 8% by 2050 — rents likely to lag national; underwrite the cash flow, not the appreciation.
- At projected returns (-3.0% appreciation + 5.7% rent growth), your $29k cash investment doubles in ~9 years — after that, you're playing with house money.
Negotiation context
- It's been on market 92 days — a 9% lower offer ($95k) is reasonable based on typical stale-listing flexibility.
- 3 sale attempts since 27y ago; this cycle's ask has dropped $15k (13%) from the opening price — seller is motivated, your offer sets the floor, not the list.
- Current owner paid $64k; list at $105k implies a 65% gain — meaningful room to come down on a strong offer.
Risks & watch-outs
- Climate carrying-cost: severe wind risk, 80% chance of damaging wind over 30y; extreme-heat days projected 7→20/yr by 2055 (HVAC capex compounding) — expect insurance premiums to compound above CPI over the hold.
Questions for the listing agent
- It's been on market 92 days. Have you received any prior offers? Is the seller open to a 9% concession, seller financing, or rate buy-down credit?
- Built in 1977 — when were the roof, HVAC, electrical panel, plumbing, and water heater last replaced?
- Why hasn't it sold? Are there any deal-killer items the seller is aware of (foundation, flood, title, zoning, code violations)?
- Is there a deadline driving the sale (1031 exchange, divorce, estate, relocation)? That informs how much negotiation room exists.
- Crime grade is F in this area — have there been break-ins, vandalism, or insurance claims at this property in the last 3 years? What carrier currently insures it and at what premium?
- What's the average days-on-market for RENTAL listings here right now (not sales)? A rising rental-DOM trend means longer vacancies and softer asking-rent achievability than the comps imply.
- What's the recent tenant-quality profile in this submarket — average credit score on applications, eviction rate, late-payment / NSF rate, and stable-employment percentage? A property-management company in the area should have these aggregated.
- How much new for-sale + rental construction is in the pipeline within 1–3 miles? Heavy new supply typically softens prices + rents 12–24 months out; constrained supply supports both.
Investment metrics
- 1% rule
- 1.13% ✓
- Cap rate
- 9.25%
- Cash-on-cash
- 10.57%
- DSCR
- 1.47
- GRM
- 7.4
CMA / ARV
- ARV (median comp)
- $95,890
- List price
- $104,900
- Delta
- 9.40%
- Verdict
- FAIR
- Comps
- 20 within 1.0 mi
Show comp detail 12 sales within ~0.75 mi
| Address | Dist | Beds/Ba | Sqft | Sold | Price | $/sf | Match |
|---|---|---|---|---|---|---|---|
| 3108 Fredericksburg Dr | 0.22mi | 3/2.0 | 1,326 (-2%) | 2mo | $110,000 | $83 | 85 |
| 4009 Brighton Rd | 0.31mi | 3/2.0 | 1,376 (+2%) | 6mo | $73,000 | $53 | 78 |
| 3237 Capwood Cur Curv | 0.05mi | 3/2.0 | 1,455 (+8%) | 10mo | $100,000 | $69 | 76 |
| 3212 Meadow Walk Ln | 0.51mi | 3/2.0 | 1,338 (-1%) | 4mo | $139,000 | $104 | 71 |
| 3219 Montwood Dr | 0.10mi | 3/2.0 | 1,159 (-14%) | 4mo | $75,000 | $65 | 68 |
| 3009 Montwood Ct | 0.29mi | 3/2.0 | 1,490 (+10%) | 5mo | $73,000 | $49 | 65 |
| 3021 Dobbs Cir | 0.25mi | 3/2.0 | 1,153 (-15%) | 2mo | $106,900 | $93 | 62 |
| 4012 Monterey Ct | 0.58mi | 3/1.5 | 1,288 (-5%) | 1mo | $107,000 | $83 | 62 |
| 4025 Edge Hill Ln | 0.30mi | 3/2.0 | 1,154 (-15%) | 1mo | $83,000 | $72 | 61 |
| 2817 Shenandoah Dr | 0.50mi | 4/2.0 (+1) | 1,273 (-6%) | 2mo | $135,000 | $106 | 60 |
| 2642 Jan Dr | 0.69mi | 3/2.0 | 1,254 (-7%) | 5mo | $100,000 | $80 | 51 |
| 2629 Shadowood Ct | 0.61mi | 3/2.0 | 1,150 (-15%) | 6mo | $57,000 | $50 | 41 |
Match score weights: distance 35% · size 25% · config 20% · recency 20%. Top-matched comps best support the ARV.
Projected returns pro-forma
-3.0% appreciation · 5.65% rent growth · sell at horizon
- IRR
- 2.3%
- Equity multiple
- 1.09×
- Total profit
- $2,717
- Equity at exit
- $15,641
- IRR
- 14.2%
- Equity multiple
- 2.28×
- Total profit
- $37,597
- Equity at exit
- $9,070
Cash invested: $29,372 (down + closing). Projections, not guarantees.
Landlord ↔ Tenant lean methodology
- Overall (STATE)
- 90 Strongly Landlord-Friendly
- State Alabama
- 90 Strongly Landlord-Friendly · R+15
- County
- — inherits STATE
- City
- — inherits STATE
ZIP-level market 36116
- Home prices YoY
- -9.7%
- Rents YoY
- 5.7%
- Active inventory
- 293
- Price-to-rent
- 7.4×
Monthly cashflow live
- Estimated rent
- $1,185 high interval (Pro) →
- Mortgage (P&I)
- −$550
- Tax from tax record
- −$84 /mo · $1,002/yr
- Insurance
- −$44
- HOA
- −$0
- Vacancy / Maint / Mgmt
- −$249
- Net cashflow
- $259
Break-even live
UW: 25.0% down · 7.5% · 30yr · 1.5% tax · 5.0% vac · 8.0% maint · 8.0% mgmt
Financing live
Cash to close
- Down payment
- $26,225
- Closing costs
- $3,147
- Reserves months
- —
- Total cash needed
- —
Loan-product check · same deal, 3 products live
Conventional
25% down · 7.5% · 30yr
- Down + closing
- —
- Monthly P&I
- —
- Monthly cashflow
- —
- DSCR
- —
- Eligible?
- —
Personal DTI + credit; lowest rate.
DSCR
20% down · 8.5% · 30yr
- Down + closing
- —
- Monthly P&I
- —
- Monthly cashflow
- —
- DSCR
- —
- Eligible?
- —
No personal income docs; deal must DSCR.
Hard money
10% down · 12.0% · 12mo
- Down + closing
- —
- Monthly P&I
- —
- Monthly cashflow
- —
- DSCR
- —
- Eligible?
- —
Short-term bridge; refi at stabilization.
Rent comps 28 comps
| Address | Beds | Baths | Sqft | Rent | $/sqft | DOM | Units | Dist |
|---|---|---|---|---|---|---|---|---|
| 3231 Virginia Pines Ln Montgomery, AL | 2.0 | 2.0 | 1068 | $800 | $0.75 | 44d | 1 | 0.09mi |
| 3240 Virginia Pines Ln Montgomery, AL | 3.0 | 2.0 | 1215 | $900 | $0.74 | 44d | 1 | 0.10mi |
| 4604 Virginia Loop Rd Montgomery, AL | 1.0–2.0 | 1.0–2.0 | 810 | $895 | $1.10 | 44d | 1 | 0.15mi |
| 4611 Virginia Loop Rd Montgomery, AL | 3.0 | 1.0 | 1029 | $1,195 | $1.16 | 21d | 1 | 0.21mi |
| 4025 Edge Hill Ln Montgomery, AL | 3.0 | 2.0 | 1154 | $1,350 | $1.17 | 14d | 1 | 0.31mi |
| 3110 Virginia Downs Montgomery, AL | 2.0 | 2.0 | 1068 | $800 | $0.75 | 44d | 1 | 0.44mi |
| 3220 Virginia Downs Montgomery, AL | 3.0 | 2.0 | 1215 | $900 | $0.74 | 44d | 1 | 0.44mi |
| 2699 Whispering Pine Dr Montgomery, AL | 4.0 | 2.0 | 1500 | $1,500 | $1.00 | 14d | 1 | 0.47mi |
| 3248 Meadow Walk Ln Montgomery, AL | 3.0 | 2.0 | 1114 | $1,200 | $1.08 | 44d | 1 | 0.50mi |
| 3855 Woodley Rd Montgomery, AL | 4.0 | 2.0 | 1450 | $1,450 | $1.00 | 44d | 1 | 0.67mi |
| 3633 Woodley Rd Montgomery, AL | 4.0 | 2.0 | 1734 | $1,600 | $0.92 | 21d | 1 | 0.81mi |
| 4220 Strathmore Dr Montgomery, AL | 1.0–3.0 | 1.0–2.0 | 931 | $1,099 | $1.18 | 44d | 1 | 0.87mi |
| 5917 Cherry Hill Rd Montgomery, AL | 4.0 | 2.0 | 1161 | $1,450 | $1.25 | 14d | 1 | 0.98mi |
| 2724 Forsyth Ln Montgomery, AL | 4.0 | 2.0 | 1794 | $1,400 | $0.78 | 44d | 1 | 1.02mi |
| 6028 Oakleigh Rd Montgomery, AL | 3.0 | 2.0 | 1105 | $850 | $0.77 | 44d | 1 | 1.08mi |
| 6061 Briarhurst Dr Montgomery, AL | 3.0 | 2.0 | 1124 | $1,075 | $0.96 | 44d | 1 | 1.10mi |
| 5800 Eagle Cir Montgomery, AL | 1.0–3.0 | 1.0–2.0 | 1000 | $1,051 | $1.05 | 44d | 1 | 1.15mi |
| 3252 Cheltenham Dr Montgomery, AL | 3.0 | 2.0 | 1705 | $1,200 | $0.70 | 44d | 1 | 1.15mi |
| 5931 Singleton St Montgomery, AL | 3.0 | 2.5 | 1302 | $695 | $0.53 | 44d | 1 | 1.17mi |
| 6105 Jennifer Ln Montgomery, AL | 3.0 | 2.0 | 1553 | $1,250 | $0.80 | 14d | 1 | 1.19mi |
| 3824 Glenfern Ct Montgomery, AL | 3.0 | 2.0 | 1600 | $1,450 | $0.91 | 44d | 1 | 1.25mi |
| 4590 Troy Hwy Montgomery, AL | 2.0–3.0 | 2.0 | 1330 | $1,299 | $0.98 | 14d | 1 | 1.26mi |
| 3638 Castle Ridge Rd Montgomery, AL | 3.0 | 2.0 | 1100 | $800 | $0.73 | 14d | 1 | 1.27mi |
| 4008 Oak Shadow Ln Montgomery, AL | 3.0 | 2.5 | 1741 | $1,395 | $0.80 | 21d | 1 | 1.29mi |
| 2619 Brantford Pl Montgomery, AL | 3.0 | 2.0 | 1323 | $1,200 | $0.91 | 44d | 1 | 1.33mi |
| 3580 McGehee Pl Dr S Montgomery, AL | 3.0 | 2.0 | 1200 | $1,205 | $1.00 | 44d | 1 | 1.36mi |
| 654 Mayflower Dr Montgomery, AL | 3.0 | 2.0 | 1777 | $1,400 | $0.79 | 44d | 1 | 1.39mi |
| 3388 McGehee Rd Unit B Montgomery, AL | 2.0 | 2.0 | 900 | $545 | $0.61 | 21d | 1 | 1.45mi |
Listing history 21 events
-
2026-06-18days on market $104,900 Active 92 DOM
-
2026-06-17days on market $104,900 Active 91 DOM
-
2026-06-16days on market $104,900 Active 90 DOM
-
2026-06-15days on market $104,900 Active 89 DOM
-
2026-06-14days on market $104,900 Active 87 DOM
-
2026-06-13pricedays on market $104,900 Active 86 DOM
-
2026-06-10days on market $109,900 Active 84 DOM
-
2026-06-09days on market $109,900 Active 83 DOM
-
2026-06-08days on market $109,900 Active 82 DOM
-
2026-06-07days on market $109,900 Active 81 DOM
-
2026-06-03days on market $109,900 Active 77 DOM
-
2026-06-02days on market $109,900 Active 76 DOM
-
2026-06-01days on market $109,900 Active 75 DOM
-
2026-05-31days on market $109,900 Active 74 DOM
-
2026-05-30days on market $109,900 Active 73 DOM
-
2026-03-18$119,900 Active 688-char remark
Show marketing remark (688 chars)
This 3-bedroom, 2-full bath brick home combines classic style with practical design on a generous 0.28-acre lot. A formal foyer entry opens to a living room featuring a focal-point stone fireplace and consistent hardwood flooring throughout the interior. The primary suite includes a private full bath and a spacious walk-in closet. For added convenience, a dedicated 3x5 laundry room is positioned directly off the kitchen. The exterior is framed by mature trees and a paved drive, providing character and shade. Located just minutes from Montgomery’s shopping and dining, this property represents a solid opportunity for anyone seeking a move-in-ready home with timeless features.
-
2022-02-17soldstatus $63,500
-
2007-02-23soldstatus $63,000 21-char remark
Show marketing remark (21 chars)
HUD HOMES SOLD AS IS.
-
2006-11-24$63,000 21-char remark
Show marketing remark (21 chars)
HUD HOMES SOLD AS IS.
-
1999-06-02soldstatus $65,000
-
1999-02-02$65,000
ⓘ Source: listings_history table (triggers on properties + properties_extension) + one-shot
backfill from property_details.listing_events for pre-trigger history.
Tax reassessment forecast AL · Resets to sale price
- Current annual tax
- $1,002 · $84/mo
- Projected year-2 tax
- $1,002 · $84/mo
- Expected delta
- $0/yr ($0/mo · 0.0%)
ⓘ Screening estimate from a state-policy table — verify with the county assessor before closing.
Climate risk First Street
- Flood 1/10 Low FEMA zone X (unshaded) · 0% chance over 30 yrs
- Wildfire 1/10 Low
- Heat 7/10 Severe 7 d/yr ≥108°F today · 20 d/yr by 30 yrs out
- Wind 8/10 Severe 80% chance of damaging wind over 30 yrs
- Air quality 2/10 Low 1 unhealthy d/yr today · 3 by 30 yrs out
Nearby sold comps map
Loading sold comps map…
Walkable amenities ~0.75 mi
Loading nearby amenities…
Taxation est. · year 1
- Rental income
- $14,220
- − Mortgage interest
- −$5,876
- − Property taxes
- −$1,002
- − Insurance
- −$524
- − Repairs & maintenance
- −$1,138
- − Management
- −$1,138
- − Depreciation
- −$3,052
- Taxable income
- $1,490
- Est. tax owed @ 24.0%
- −$358
- After-tax cash flow
- $2,748/yr
For passive investors: Depreciation is non-cash, so a rental often shows a tax loss while cash-flowing — sheltering income. Rental losses are passive: they offset passive income freely, and up to $25,000/yr can offset ordinary (W-2) income if you actively participate and your MAGI is under $100k (phasing out to $0 by $150k); unused losses carry forward. On sale, claimed depreciation is recaptured at up to 25%, and gains may owe capital-gains tax (a 1031 exchange can defer both). Figures are a year-1 estimate at your 24.0% rate — not tax advice; consult a CPA.
Schools (NCES district)
- District
- Montgomery County
- NCES district ID
- 0102430
- Math proficiency
- 9% ▼ -21.00%
- Reading proficiency
- 31% ▼ -1.00%
- Median HH income
- $43,902
- Composite
- 17.24/100
- National rank
- #9093
- State rank
- #106 of 129 in AL
Livability — Montgomery
- Score
- 65/100
- State rank
- #138
- US rank
- #13416
Category grades
Schools grade is shown separately in the Schools card above.
Census & demographics
- Census place
- Montgomery, AL
- County
- Montgomery County · 190,016 people
- City population
- 175,913
- Metro
- Montgomery, AL
- Population (ZIP)
- 45,250
- Household income
- $55,160
- Rent vs Own
- Severe rent burden
- 2786.0
Population outlook (Montgomery County) Hauer SSP2
- Today (2025)
- 224,008 people
- By 2030
- 221,460 · -1.1%
- By 2040
- 214,179 · -4.4%
- By 2050
- 204,912 · -8.5%
- By 2075
- 177,821 · -20.6%
- By 2100
- 145,134 · -35.2%
Race, ethnicity, and origin ACS 2023
- Neighborhood character
- Predominantly Black (80%)
- Race & ethnicity
- Black 80% White 12% Two or more races 4% Asian 3% Hispanic / Latino 2%
- Common ancestry
- Italian 1%
- Foreign-born
- 5% · Canada, South Korea
- Languages at home
- 94% English-only · Spanish 2% Other Indo-European 1% Korean 1%
Political lean MEDSL · Montgomery
- 2024 margin
- Solid D (+30.7) · D 64.8% · R 34.1% · Other 1.1%
- 2008→2024 swing
- +11.5pp toward D · 2008: 19.2pp · 2024: 30.7pp
- All cycles
- 2024: D+30.7 2020: D+31.5 2016: D+26.2 2012: D+24.3 2008: D+19.2
Not yet ingested
- Civics
- —
Market trends
- HPI YoY
- ▼ -16.31%
- Current HPI
- 151.8598
- Rent YoY
- ▲ 5.65%
- Metro
- Montgomery, AL
- State GDP YoY
- ▲ 2.94%
- F500 in state
- 4
Industry mix (Fortune 500 HQ in AL)
| Industry | F500 HQs | Revenue |
|---|---|---|
| Financial Services | 1 | $8B |
|
||
| Healthcare | 1 | $5B |
|
||
Price history
+84.5% since first listed6 events — show timeline
- 2026-03-18 Listed $119,900 Greater Alabama MLS
- 2022-02-17 Sold (Public Records) $63,500 Public Records
- 2007-02-23 Sold (MLS) $63,000 MAAR
- 2006-11-24 Listed $63,000 MAAR
- 1999-06-02 Sold (MLS) $65,000 MAAR
- 1999-02-02 Listed $65,000 MAAR
Property tax history
+6.6%/yrLatest (2025): $1,002 · +5.1% YoY. Source: county tax records.
Cash-flow waterfall
monthlySold comps — $/sqft
last 12 mo · ≤1 miLoading sold comps…